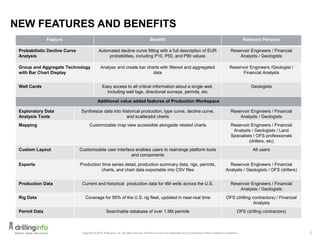
2. 2
NEW FEATURES AND BENEFITS
Feature Benefit Relevant Persona
Probabilistic Decline Curve
Analysis
Automated decline curve fitting with a full description of EUR
probabilities, including P10, P50, and P90 values
Reservoir Engineers / Financial
Analysts / Geologists
Group and Aggregate Technology
with Bar Chart Display
Analyze and create bar charts with filtered and aggregated
data
Reservoir Engineers /Geologist /
Financial Analysts
Well Cards Easy access to all critical information about a single well,
including well logs, directional surveys, permits, etc
Geologists
Additional value added features of Production Workspace
Exploratory Data
Analysis Tools
Synthesize data into historical production, type curve, decline curve,
and scatterplot charts
Reservoir Engineers / Financial
Analysts / Geologists
Mapping Customizable map view accessible alongside related charts Reservoir Engineers / Financial
Analysts / Geologists / Land
Specialists / OFS professionals
(drillers, etc)
Custom Layout Customizable user interface enables users to rearrange platform tools
and components
All users
Exports Production time series detail, production summary data, rigs, permits,
charts, and chart data exportable into CSV files
Reservoir Engineers / Financial
Analysts / Geologists / OFS (drillers)
Production Data Current and historical production data for 4M wells across the U.S. Reservoir Engineers / Financial
Analysts / Geologists
Rig Data Coverage for 95% of the U.S. rig fleet, updated in near-real time OFS (drilling contractors) / Financial
Analysts
Permit Data Searchable database of over 1.5M permits OFS (drilling contractors)
3. 3
E&P SOLUTIONS FOR RESERVOIR ENGINEERS
Responsibilities: Benchmark company performance relative to
competitors in a given area; Predict reserves/EURs; Quantify spread
in predicted remaining reserves
Features Used: Type curves, probabilistic decline curve analysis,
curve autofit technology
• Select wells in area of interest, filtering to horizontal wells in same
formation
• Quantify spread in EUR prediction (+/- bbls) and calculate P10,
P50, P90 values
Drillinginfo Solution: Create type curves, benchmark
performance by operator, use autofit technology to identify best
decline curve model, predict EURs
4. 4
E&P SOLUTION FOR GEOLOGISTS OR ENGINEERS
Responsibilities: Benchmark competition; Compare six-
month production for operators in target reservoirs
Features Used: Grouping and aggregating; bar charts
• Select wells in area of interest, filtering to horizontal wells
in same formation
• Use grouping and aggregate feature to create bar charts
comparing operator performance
Drillinginfo Solution: Compare operator performance;
Export data and integrate with internal databases for
proprietary analysis
5. 5
E&P SOLUTION FOR GEOLOGISTS OR ENGINEERS
Responsibilities: Determine correlations between well
depth, trajectory, and six-month production for a given area;
Identify best practices in drilling high performing wells
Features Used: Scatterplots
• Filter to area of interest, well depth, horizontal wells, and
six-month production
Drillinginfo Solution: Visualize scatterplot correlations
and integrate data with internal databases for proprietary
analysis
6. 6
FINANCIAL SERVICES SOLUTION: RESEARCH ANALYST
Responsibilities: Monitor portfolio companies; Make
buy/hold/sell recommendations based on company
activity; Verify company’s reported reserves
Features Used: Type curves; curve autofit technology;
probabilistic type curve analysis
• Quantify level of risk in predictions and compare
estimates to company’s reported reserves
Drillinginfo Solution: Benchmark performance by year,
use autofit technology to identify best decline curve
model, predict EURs; Quantify level of risk in
predictions and compare estimates to company’s
reported reserves
7. 7
HIGHLIGHTS OF PRODUCTION WORKSPACE FEATURES
All customers will have access to an exciting new technology within Production
Workspace that allows them to automatically fit decline curves and forecast reserves
with Drillinginfo.
With this new tool, customers will stop manually selecting decline curve models and
produce more accurate EUR predictions. The probabilistic decline curve analysis tools
allow customers to easily improve the accuracy of and manage risk around EUR
predictions. The next-generation decline curve autofit technology automatically selects
the best fit for decline curves, completely eliminating manual processes and the
possibility of human error.
The tool also produces P10, P50, and P90 values to easily analyze the likely spread
around the estimate. A suite of exploratory data analysis tools allows for easy
visualization and exportation of data. Now, customers can quantify the risk in their
reserves estimates and make confident recommendations with Drillinginfo.
Minimize risk and maximize accuracy in your EUR predictions