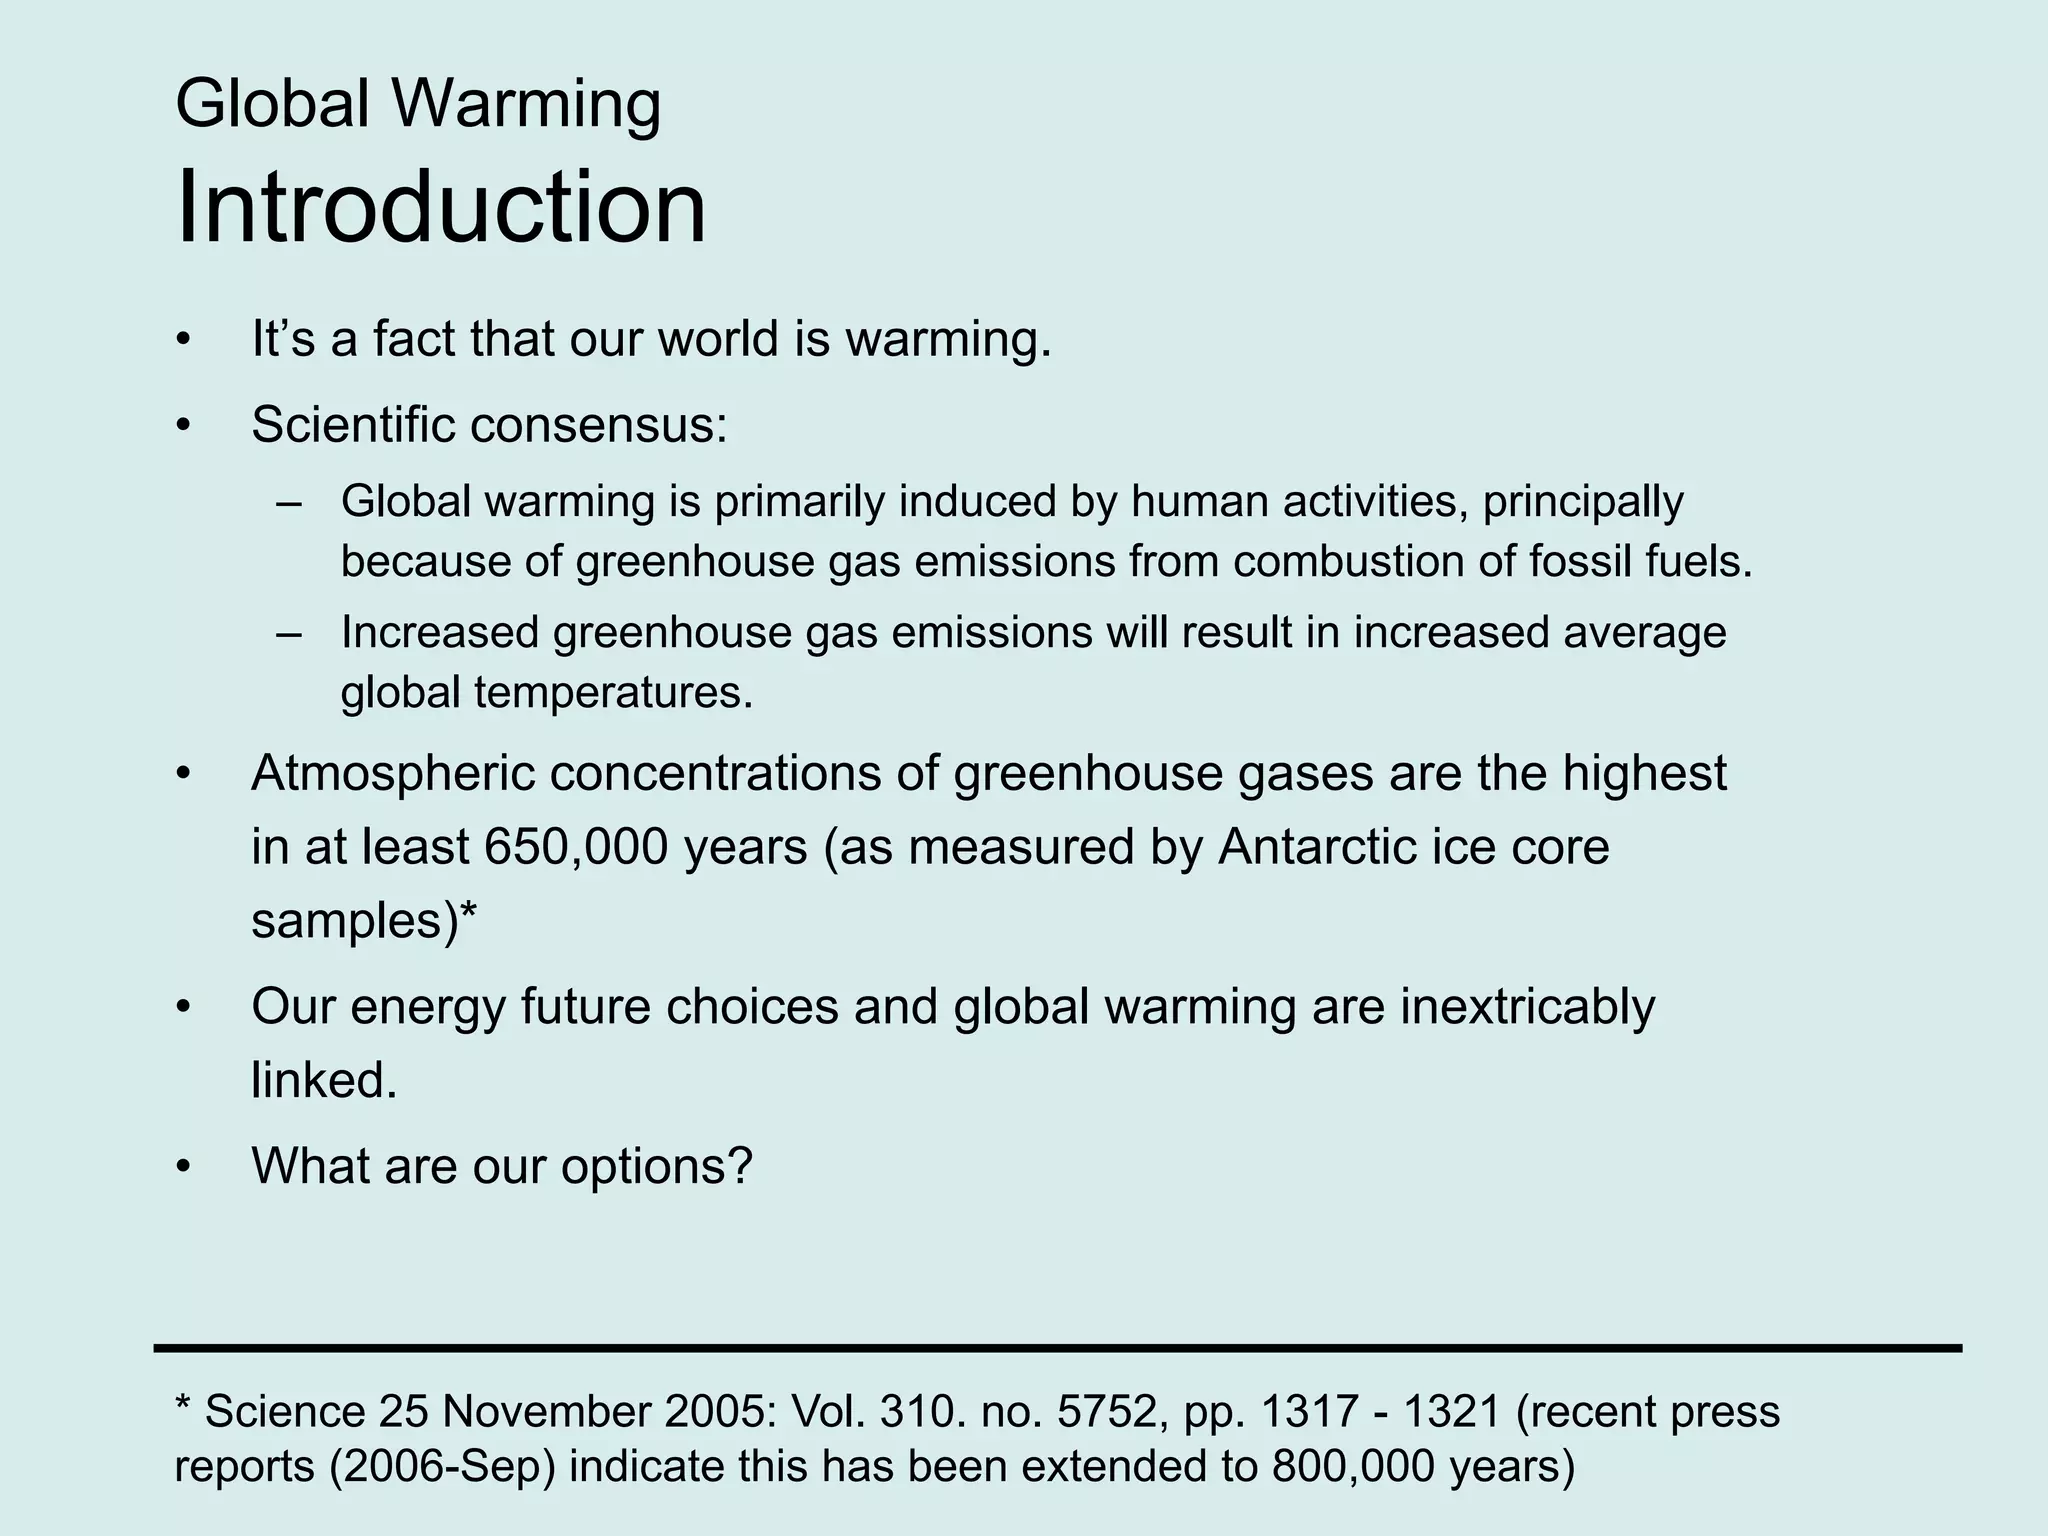
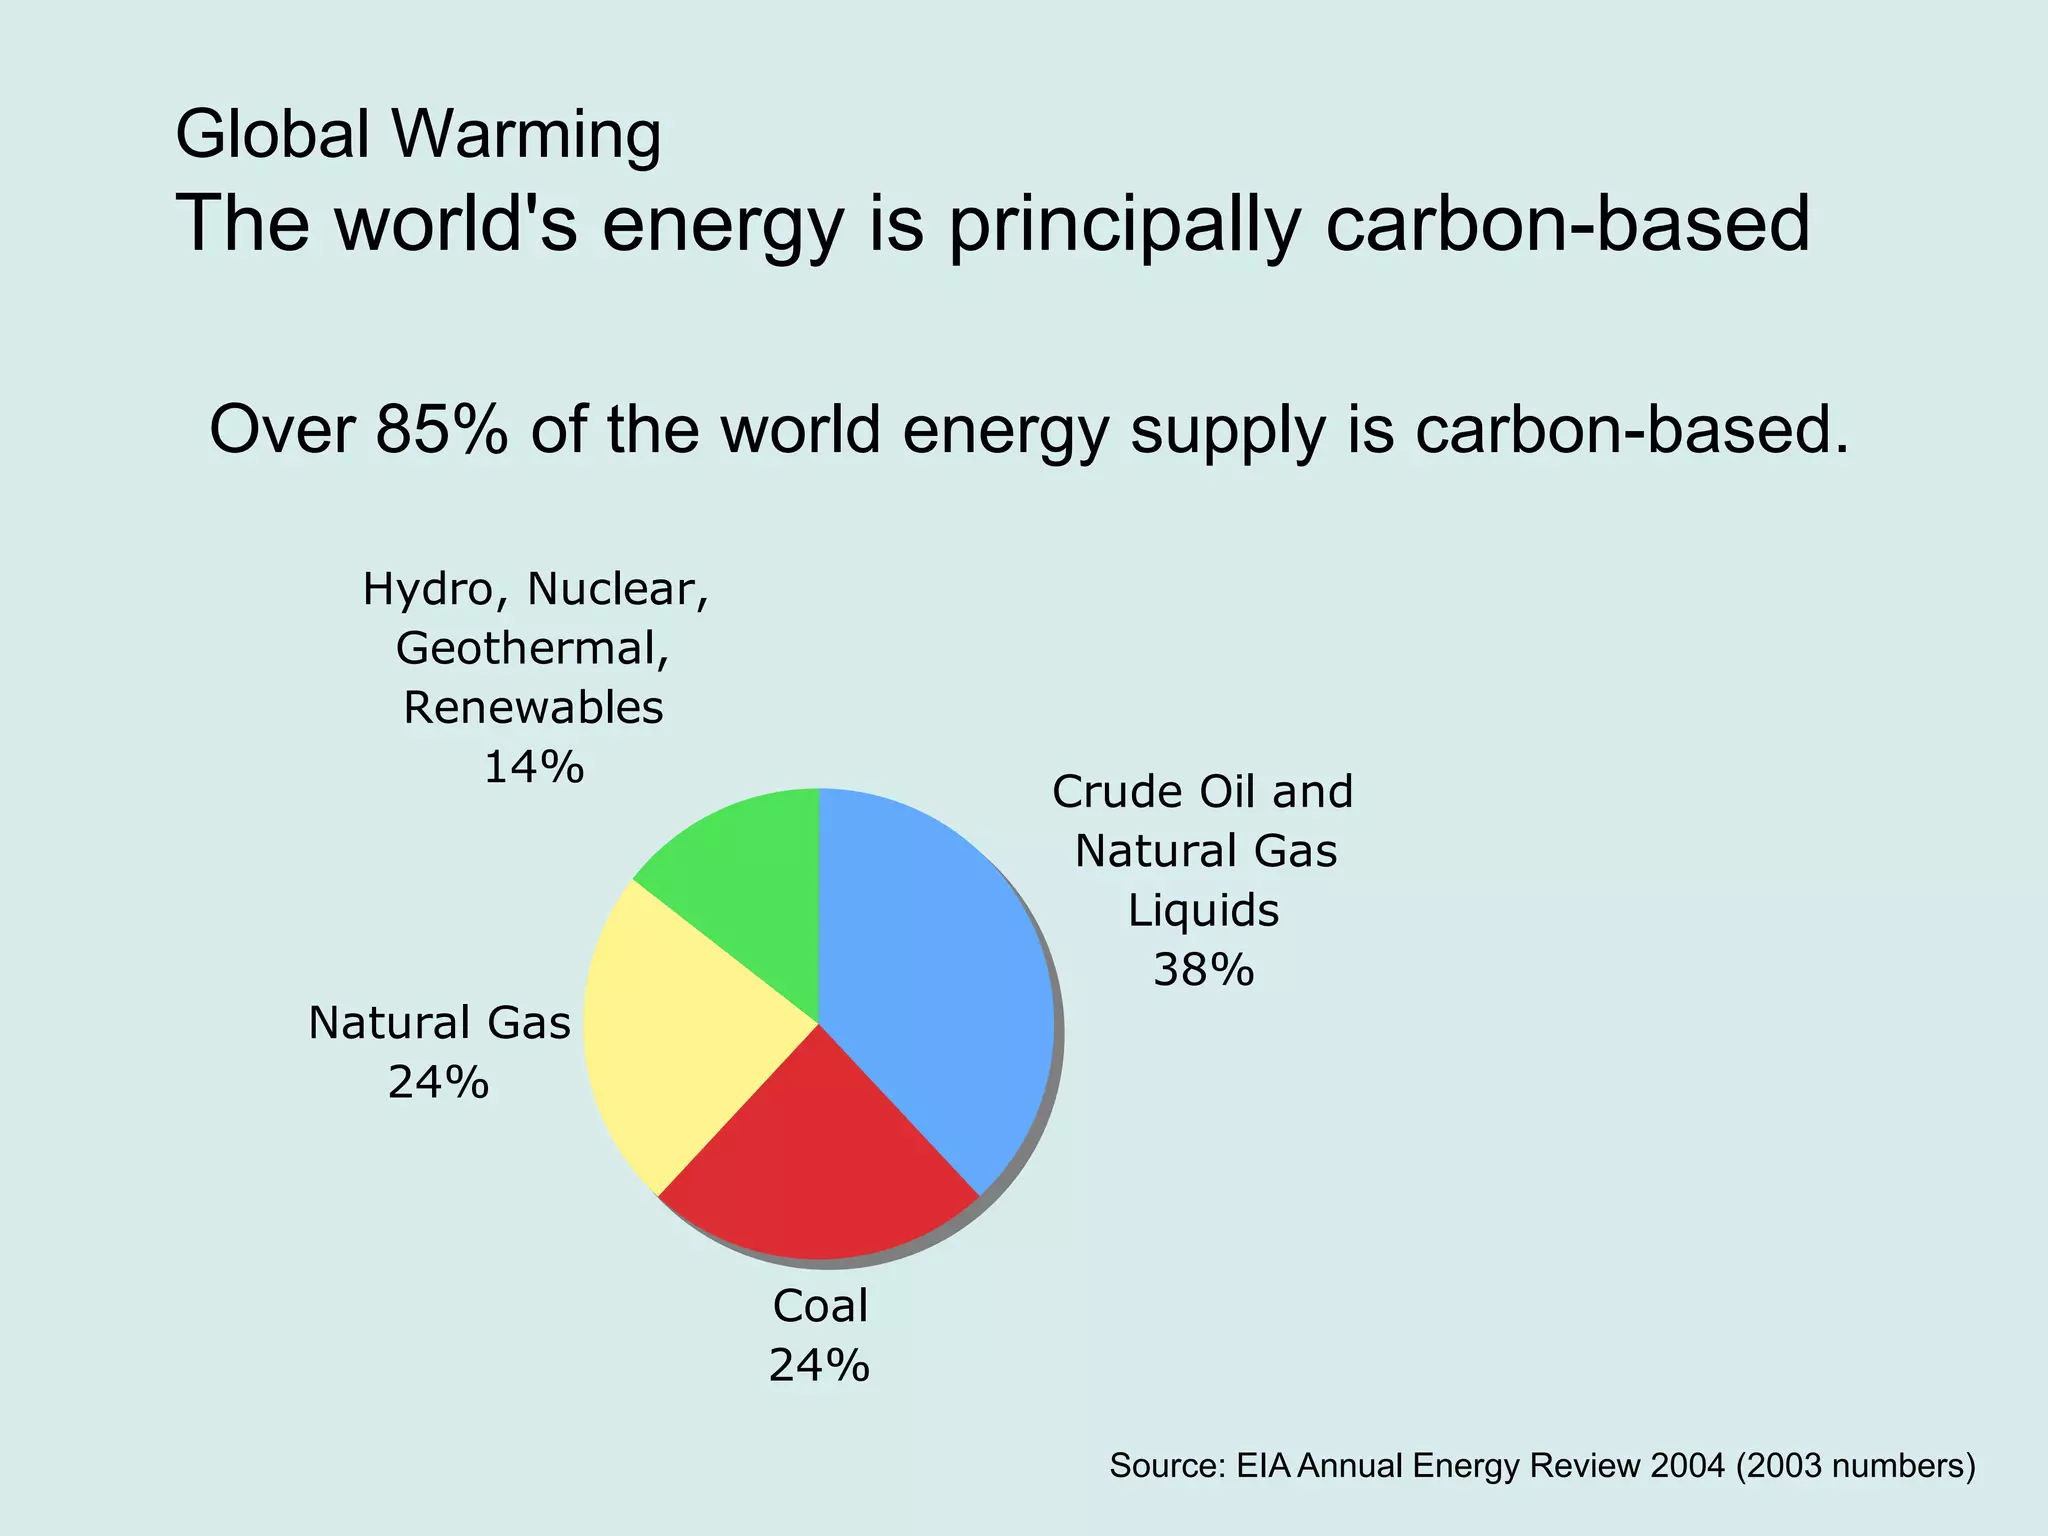
Global Warming and the Coming Peaks in
Oil, Gas and Coal Production
Carbon Mitigation Scenarios for the Next 100 Years
Bruce Hodge
June, 2006
Global Warming
Introduction
• It’s a fact that our world is warming.
• Scientific consensus:
– Global warming is primarily induced by human activities, principally
because of greenhouse gas emissions from combustion of fossil fuels.
– Increased greenhouse gas emissions will result in increased average
global temperatures.
• Atmospheric concentrations of greenhouse gases are the highest
in at least 650,000 years (as measured by Antarctic ice core
samples)*
• Our energy future choices and global warming are inextricably
linked.
• What are our options?
* Science 25 November 2005: Vol. 310. no. 5752, pp. 1317 - 1321 (recent press
reports (2006-Sep) indicate this has been extended to 800,000 years)
Global Warming
Presentation overview
• CO2 emissions and global warming
• Mitigation of CO2 emissions using stabilization
wedges
• 100 year emissions / mitigation scenarios
– Projected resource depletion curves for Oil, Gas, Coal
– Projected CO2 emissions
– Projected atmospheric CO2 concentrations
– Wedge mitigation scenarios
– Per capita impacts
• Conclusions
Crude Oil and
Natural Gas
Liquids
38%
Coal
24%
Natural Gas
24%
Hydro, Nuclear,
Geothermal,
Renewables
14%
Global Warming
The world's energy is principally carbon-based
Source: EIA Annual Energy Review 2004 (2003 numbers)
Over 85% of the world energy supply is carbon-based.
Global Warming
Historic CO2 Emissions for Oil, Gas & Coal
Source: Global, Regional,
and National Fossil Fuel
CO2 Emissions
G. Marland, T. A. Boden,
and R. J. Andres
Carbon Dioxide
Information Analysis
Center
Oak Ridge National
Laboratory
U.S. Dept. of Energy
Total CO2
emissions at
about 7GtC / yr
Global Warming
Global population (historic & projected)
Global population
will grow 50% by
2050.
Global Warming
Carbon Emissions, CO2 Concentrations and
Temperature
• Carbon emissions (measured in GtC / yr) add to the amount of
CO2 in the atmosphere (ppm), which then cause mean global
temperature to rise. 1 GtC is a giga-tonne of carbon or a billion
metric tons.
• An atmospheric concentration of 500 ppm of CO2 leads to a
projected 3ºC (±1) increase in mean global temperature
(temperature models are evolving).
• Scientists often relate CO2 concentrations to pre-industrial
emissions (280ppm) via a simple multiplier (e.g. 2x or 3x
pre-industrial concentrations).
Global Warming
Carbon Sources & Sinks
• Sources emit CO2; Sinks absorb CO2
• Historically the sinks have been able to “balance” the sources.
• Principal anthropogenic sources are emissions from burning of
oil, gas and coal.
• Natural sinks (ocean & land)
– Currently remove about 35% of anthropogenic carbon emissions
– Ocean: 2 GtC per year
– Land: 0.5 GtC per year
– Combined 2.5 GtC/yr
• Modeling future ocean & land sink rates is a research challenge
and affects calculations concerning atmospheric CO2
concentrations - uncertainty in these models is high.
Global Warming
What IS an acceptable CO2 stabilization level?
• Current CO2 concentration is 377 ppm* compared to 280 ppm at
the beginning of the industrial age.
• Up to now, many scientists have accepted the idea that
stabilizing the CO2 concentration at around 500 ppm will avoid
disastrous climate change.
• A new book by top UK scientists, Avoiding Dangerous Climate
Change**, suggests that a more aggressive target of 450 ppm is
necessary… But is that enough?
* Measured in 2004 at Mauna Loa
** Stabilising climate to avoid dangerous climate change, Hadley Centre for
Climate Change
http://www.metoffice.com/research/hadleycentre/pubs/brochures/2005/CLIMATE_
CHANGE_JOURNAL_150.pdf
Global Warming
What IS an acceptable CO2 stabilization level?
• A report commissioned by the Pentagon* suggests that abrupt
climatic change is very possible. One possible scenario
involves the interruption of the Gulf Stream because of the
effects of massive fresh water inputs from the melting Greenland
ice sheet, plunging Europe into a much colder climate (i.e. the
collapse of thermohaline circulation)
• What is an acceptable level? We don’t know...
• However, we do know that the current levels of CO2 are causing
significant impacts upon the earth’s climate, which suggests that
we need a target below current levels.
* An Abrupt Climate Change Scenario and Its Implications for United States National
Security Oct 2003, By Peter Schwartz and Doug Randall
http://www.grist.org/pdf/AbruptClimateChange2003.pdf
Climate Mitigation
Introduction
• Climate change can be mitigated by various
strategies that reduce carbon emissions.
• Let’s take a look at one methodology that allows us to
quantify the effects of mitigation strategies:
stabilization wedges.
Climate Mitigation
Stabilization Wedges
• Research papers* by R. Socolow, S. Pacala, et al (Princeton)
have introduced the concept of stabilization wedges.
• Each wedge represents a reduction of 25Gt of carbon emissions
over a 50 year period.
• Socolow, et. al present 14 different wedges that are proven
technologies that can be scaled and implemented over a 50
year period.
• Projects that the implementation of 7 wedges over the next 50
years, followed by even more significant reductions starting in
2050 will keep CO2 concentrations from rising above 500ppm.
* Stabilization Wedges: Solving the Climate Problem for the Next 50 Years with
Current Technologies, S. Pacal and R. Socolow, Aug 2004 Science
Solving the Climate Problem, R. Socolow, R. Hotinski, J.B. Greenblatt, S. Pacala,
Dec. 2004 Environment
Climate Mitigation
Stabilization Triangle
From Socolow, et al
Historical carbon emissions
with two potential pathways
for the future
“Currently
predicted
path” is
BAU, i.e.
1.5%
growth/year
Tripling in the
graph refers to a
tripling of CO2
concentrations
compared to pre-
industrial levels
of 280, and
doubling is
similarly
construed.
Climate Mitigation
Stabilization Wedges
Source: Socolow, et al
7 wedges over 50 years followed by more
aggressive measures in the following 50
years are sufficient to limit atmospheric
CO2 concentrations to around 500 ppm
Climate Mitigation
Stabilization Wedge Types
• Conservation
– I.e. using less or simply doing without
• Increased energy efficiency
– Transportation
– Buildings
– Industry
• Non-carbon energy production
– Renewables such as solar, wind and bio-fuels
– Carbon sequestration - carbon is removed from carbon based
fuels and injected into deep wells as CO2
– Nuclear power
• Natural sinks
– Planting trees, reducing deforestation
Climate Mitigation
Examples of a 50 year wedge
• Wind electricity (1 wedge)
– Deployment of 2000 GW by 2054
– I.e. about 2 million 1MW windmills
– 50 times today’s installed base
– Windmills cover an area about the size of Germany
• Photovoltaic (PV) electricity (1 wedge)
– Deployment of 2000 GW by 2054
– Only 3 GW is currently installed
– 700 times today’s installed base
– Array’s combined area roughly equal to New Jersey
• Biofuels (1 wedge)
– Requires 1/6 of the world’s cropland
– Biofuel feedstock must be grown without fossil fuel inputs
• More efficient automobiles (1 wedge)
– Increase fuel economy from 30 to 60 mpg for 2 billion cars by 2054
– Today’s installed base is about half a billion cars
Source: Socolow, et. al
Climate Mitigation
Stabilization Wedges
• Socolow’s 7 wedge projection is based on the
following critical assumption:
– Business-as-usual (BAU) energy use is 1.5% growth/year
(same as current) for the next 50 years.
• Note that:
– BAU energy use results in a doubling of the rate of global
energy use in 50 years in an era which will be characterized
by tightening energy supplies.
– This is an 80% increase of global per-capita energy use
(assuming global population peaks in 2050 at around 9
billion people).
Climate Mitigation
Carbon emissions and their mitigation
• This study…
– Models carbon emissions in more detail by breaking down
projected carbon based emissions by energy source (oil, gas,
coal) and uses plausible depletion scenarios.
– Models their mitigation by the application of different numbers
of 100 year wedges
– Models the effect of delayed implementation of wedges and
links each scenario to projected atmospheric CO2 levels and
per-capita energy services.
• Next…
– A number of scenarios that model future carbon emissions and
potential mitigation efforts over the next 100 years
Carbon-based Energy
A Tour of Carbon Based Energy Supplies
• What follows is a tour of each of the principal carbon-
based energy supplies.
• Although energy analysts will typically break down
supplies into finer detail, we simplify by examining the
broad categories of oil, natural gas, and coal.
• Let’s start with oil, which will likely be the first to
become depleted…
Carbon-based Energy
Oil Production
• Consumption to date: ~900 billion barrels
• Current consumption/production rate: ~80 million
barrels/day or ~30 billion barrels/yr.
• Supplies are currently extremely tight: production
essentially equals consumption.
• Total amount remaining (the remaining oil reserve) is
a matter of dispute for reasons that go beyond purely
technical ones.
• In effect, a giant global poker game; oil reserve
numbers are manipulated for business and political
reasons.
Carbon-based Energy
Peak Oil
• A growing chorus of oil geologists* and other analysts are
making total recoverable oil estimates of around 1.2 trillion
barrels, and estimate a peak in global oil production somewhere
between 2005 and 2030.
• Future oil production is likely to follow a depletion profile where
extraction peaks at certain point in time and declines after.
• After the peak, demand exceeds supply
– Price increases and/or instability?
– Uncharted territory
* Including but not limited to:
C.J. Campbell, Jean Laherrere - The End of Cheap Oil
Kenneth Deffeyes, Hubbert’s Peak, The Impending World Oil Shortage
Carbon-based Energy
Peak Oil
Production lags discovery Source: C.J. Campbell - Oil
Depletion - The Heart of the
Matter
Carbon-based Energy
Peak Oil
Exxon Mobil estimates a peak on non-OPEC conventional oil in 5 years!
Source: Exxon Mobil 2005 Energy Outlook
After the non-
OPEC peak
in 2010,
production
increases will
have to come
from OPEC.
OPEC’s
future
production
capabilities
are largely
unknown.
Carbon-based Energy
Peak Oil
• We can make a reasonable projection of oil depletion by
picking a peak year and a subsequent depletion rate,
knowing the total estimated reserves.
• In all of baseline projections (oil is just the first!) I’ve
used exponential growth and decay curves (the same
curves as compound interest).
• Although the actual shape of the curve for future years
may differ from the projected shape, the impact upon
CO2 concentrations is largely the same.
Carbon-based Energy
Baseline Peak Oil Scenario
Oil is almost
completely
depleted in
50 years
Carbon-based Energy
Natural Gas
• Natural gas production is likely to peak roughly 20 years after oil
peaks or somewhere between 2010 and 2025.
• Industry estimates:
– Proved reserves - 6300 Tcf (trillion cubic feet) *
– Resources (yet to be discovered) - 4200 Tcf **
• Independent estimates ***
– Total recoverable (reserves+resources) of 12,500 Tcf
– 185 GtC
• Natural gas will be under increasing production pressures as a
substitute for oil, despite transport difficulties.
* BP Statistical Review of World Energy, June 2005
** Undiscovered (EIA, International Energy Outlook 2005)
*** High Noon for Natural Gas: The New Energy Crisis, by Julian Darley
Carbon-based Energy
Baseline Peak Gas Scenario
Gas is almost
completely
depleted by 2075
Carbon-based Energy
Coal
• Predicting future coal production is difficult because the reserves
are still large in comparison with oil and gas.
• Estimated remaining coal resources: 1 trillion tons *
(~750 GtC emissions)
• Baseline scenario assumes current annual growth continues for
next 50 years, then starts a gradual decline.
• This scenario triples coal production with a peak at around 2085.
• Factors that limit coal production:
– increasing environmental costs
– decreasing EROEI (energy returned on energy invested)
• The limits to coal production will be set by carbon emission
restrictions and environmental concerns, not by the size of the
remaining reserves.
* Energy Information Administration (EIA), International Energy Annual 2003
Carbon-based Energy
Baseline Coal Scenario
Coal is almost
completely
depleted by
2200 (I.e 200
years left)
Carbon-based Energy
Unmitigated Carbon Emissions
• Peak in overall
energy production
and CO2 emissions
at ~10 GtC in
around 25 years
(compared to
Socolow BAU 14
GtC in 2050)
• By 2100, energy is
obtained exclusively
from coal as oil and
gas supplies
become exhausted
• Steep decline in
total energy
• Serious
challenges facing
global energy
supply
Carbon-based Energy
Unmitigated emissions - CO2 concentrations
• Concentrations
climb to 2.4x pre-
industrial levels by
2150
• Climate worsens
substantially or
even becomes
unstable
Sinks are roughly interpolated
based on a model described in
U. Siegenthaler and F. Joos, Use
of Simple Model for Studying
Oceanic Tracer Distributions and
the Global Carbon Cycle, Tellus
44B (1992): 186-207
Land sink: constant 0.5
GtC/year
Ocean sink: 2 GtC/year, rising to
2.5 by 2050, then declining back
to 2 by 2100
Carbon-based Energy
Unmitigated emissions - Per capita energy
Energy per capita
drops precipitously
without new energy
sources.
Carbon-based Energy
Summary of carbon-based energy future
• The coming peaks in oil and gas will contribute to a combined
peak in energy production in about 25 years.
• Coal will then become the principal driver of carbon-based
energy sources
• Allowing unfettered production of carbon-based fuels will cause
our CO2 concentrations to peak at above 650 ppm after 150
years - causing an unacceptable level of warming
• The loss of oil & gas resources along with the gradual decline of
coal will push the world towards a low-energy regime
• The likely peak of global population in 2050 of about 9 billion
people will only exacerbate energy issues
Climate Mitigation
Mitigation Scenarios
• Fortunately the implementation of wedges can both
mitigate CO2 emissions and replace our declining
and polluting energy sources with renewable sources
• Let’s take a look at how different mitigation scenarios
impact CO2 emissions and the resulting atmospheric
concentrations…
Climate Mitigation
Wedge model details
• Assumptions in allocating the CO2 reductions from
wedges:
– 50% for new non-carbon energy sources, 50% for efficiency
measures.
– Conservation is imposed by decreasing yields in oil and gas and
is not explicitly included in wedges.
– Wedges offset each primary carbon based energy source based
on the proportion consumed as predicted by the depletion
scenarios
– Wedges always displace (not augment) existing energy sources.
• Now let’s examine how the implementation of 3 wedges
will affect CO2 emissions of oil, gas, and coal…
Climate Mitigation
3 Wedges: Oil
Impact of wedges
is moderate
because the oil
supply runs out
early on, and
wedge offsets
must also be
applied to gas
and coal
Climate Mitigation
3 Wedges: Natural Gas
Impact of wedges
is more
pronounced than
oil because since
the oil supply runs
out early on,
wedge offsets can
now be applied to
only gas and coal
With mitigation,
gas emissions are
near ZERO by
~2075.
Climate Mitigation
3 Wedges: Coal
Coal emissions
can be cut to
ZERO by 2100
with 3 wedges
Note that the
wedge
contribution
increases linearly
(non-exponential
growth), for the
first 100 years and
then is held
constant
afterwards
Climate Mitigation
3 Wedges: All
It’s possible to bring
total CO2 emissions
to ZERO by 2100,
but total energy
declines by a factor
of 3.
Climate Mitigation
3 Wedges - CO2 Concentration
Climate Mitigation
3 Wedges - Per capita energy
A substantial drop in
energy services per capita
(Energy per capita calculated based on projections of 9 billion in 2050, then stable population at 9 billion)
Climate Mitigation
5 Wedges: All
5 wedges can
drive CO2
emissions to
ZERO in ~75
years
Climate Mitigation
5 Wedges - CO2 Concentration
CO2 concentrations
can fall to below
current levels in
about 150 years.
Climate Mitigation
5 Wedges - Energy Services per Capita
Energy services
can come back to
around current
levels in 100
years, after
weathering a very
steep drop that
begins in about
25 years.
Climate Mitigation
Comparison of Wedge Scenarios
Climate Mitigation
Comparison of Wedge Scenarios
Climate Mitigation
Delayed implementation
Climate Mitigation
Delayed implementation
Conclusions
An uncertain future…
• Even with aggressive mitigation measures, the world will be
significantly warmer over the next 100-200 years
• To mitigate climate change, the world will have to cope with
significantly less total available energy over the next 100
years, with a peak in roughly 25 years followed by a sharp drop in
available energy.
• Energy services per capita also faces a significant drop after the
energy peak
• The coming peaks in oil and gas production will make it somewhat
easier to mitigate climate change since there is less carbon to
offset.
• Appropriate actions can both mitigate climate change and replace
obsolete energy sources with new renewable sources.
Conclusions
Implementation of 5 Wedges without delay
Carbon
concentrations peak
at just over 450 ppm in
about 50 years, then
eventually drop to
below current levels
(350 ppm) by a
hundred years after
that (in 2155)
Peaking at ~450 ppm
reduces the risk of
severe climate
disruption
Conclusions
Implementation of 5 Wedges without delay
• Energy services per
capita declines after total
energy peak but recovers
to near current level by
2100.
• Achieving steady state
energy services per capita
at or below the current
level is a good long term
goal for energy
sustainability.
Conclusions
Wedge implementation
• Implementation of wedges can accomplish:
• A replacement for fossil energy sources that will be mostly
depleted within 100 year (oil and gas) and 200 year (coal)
ranges.
• Climate stabilization
• A far more efficient energy infrastructure that can serve as the
foundation for future innovations.
• Delays in wedge implementation cause a higher peak
in atmospheric CO2. The longer the delay, the worst the
penalty.
Conclusions
Wedge implementation
• Wedge implementation requires that we think
carefully about our future capital investments, both
institutionally and individually.
• Ideally wedges should be stepping stones to viable
long term solutions – not stop-gap measures.
• Although wedges can be implemented with non-
renewable solutions such as carbon sequestration
and nuclear power
• Those solutions are only temporary…
• Better to invest as much as possible in renewable energy
sources.
Conclusions
Challenges ahead require immediate action
• We should act to set targets and implement wedge
strategies without delay.
• Inaction or “business as usual” is not an option.
• We need to bring new energy sources online AND
mitigate global warming.
• We need to devise globally effective economic strategies
to facilitate the implementation of wedges.
• Global warming (and environmental degradation in
general) needs appropriate economic price signals.
Conclusions
Uncertainties
• CO2 concentrations may be higher than estimates if
ocean/land sink rates change for the worse.
• CO2 concentrations may also be driven higher if other
unconventional carbon sources such as oil sands come
into significant use. Hopefully, they will NOT enjoy
large-scale adoption! Otherwise we need even more
wedges!
• Sudden climate change is a distinct possibility, but the
triggers are largely unknown.
Conclusions
What can I do?
• Educate others on the links between energy & climate.
• Think locally AND globally!
• Examine personal energy use and carbon emissions
• Use less!
• Envision strategies for switching to renewable energy.
• Choose Green Power (such as PaloAltoGreen).
• Drive a HEV or PHEV (pluggable hybrid electric vehicle)*.
• Buy carbon offsets (available online).
• Urge your municipality to devise a plan for becoming carbon neutral.
* A typical HEV (hybrid electric vehicle) is a Toyota Prius or Honda Civic.
See www.calcars.org for more info on the promise of PHEVs.
Conclusions
What can I do?
• Lobby congress to:
• set wedge implementation targets.
• levy a carbon tax.
• establish a carbon budget.
• Educate yourself and others on what’s happening internationally in
this arena
• Get creative! Let’s kick-start the fixes for global warming together!
Thanks!
Send comments to:
Bruce Hodge
hodge@tenaya.com
See this presentation online at:
www.tenaya.com/globalwarming

Global warming.ppt

  • 1.
    Global Warming andthe Coming Peaks in Oil, Gas and Coal Production Carbon Mitigation Scenarios for the Next 100 Years Bruce Hodge June, 2006
  • 2.
    Global Warming Introduction • It’sa fact that our world is warming. • Scientific consensus: – Global warming is primarily induced by human activities, principally because of greenhouse gas emissions from combustion of fossil fuels. – Increased greenhouse gas emissions will result in increased average global temperatures. • Atmospheric concentrations of greenhouse gases are the highest in at least 650,000 years (as measured by Antarctic ice core samples)* • Our energy future choices and global warming are inextricably linked. • What are our options? * Science 25 November 2005: Vol. 310. no. 5752, pp. 1317 - 1321 (recent press reports (2006-Sep) indicate this has been extended to 800,000 years)
  • 3.
    Global Warming Presentation overview •CO2 emissions and global warming • Mitigation of CO2 emissions using stabilization wedges • 100 year emissions / mitigation scenarios – Projected resource depletion curves for Oil, Gas, Coal – Projected CO2 emissions – Projected atmospheric CO2 concentrations – Wedge mitigation scenarios – Per capita impacts • Conclusions
  • 4.
    Crude Oil and NaturalGas Liquids 38% Coal 24% Natural Gas 24% Hydro, Nuclear, Geothermal, Renewables 14% Global Warming The world's energy is principally carbon-based Source: EIA Annual Energy Review 2004 (2003 numbers) Over 85% of the world energy supply is carbon-based.
  • 5.
    Global Warming Historic CO2Emissions for Oil, Gas & Coal Source: Global, Regional, and National Fossil Fuel CO2 Emissions G. Marland, T. A. Boden, and R. J. Andres Carbon Dioxide Information Analysis Center Oak Ridge National Laboratory U.S. Dept. of Energy Total CO2 emissions at about 7GtC / yr
  • 6.
    Global Warming Global population(historic & projected) Global population will grow 50% by 2050.
  • 7.
    Global Warming Carbon Emissions,CO2 Concentrations and Temperature • Carbon emissions (measured in GtC / yr) add to the amount of CO2 in the atmosphere (ppm), which then cause mean global temperature to rise. 1 GtC is a giga-tonne of carbon or a billion metric tons. • An atmospheric concentration of 500 ppm of CO2 leads to a projected 3ºC (±1) increase in mean global temperature (temperature models are evolving). • Scientists often relate CO2 concentrations to pre-industrial emissions (280ppm) via a simple multiplier (e.g. 2x or 3x pre-industrial concentrations).
  • 8.
    Global Warming Carbon Sources& Sinks • Sources emit CO2; Sinks absorb CO2 • Historically the sinks have been able to “balance” the sources. • Principal anthropogenic sources are emissions from burning of oil, gas and coal. • Natural sinks (ocean & land) – Currently remove about 35% of anthropogenic carbon emissions – Ocean: 2 GtC per year – Land: 0.5 GtC per year – Combined 2.5 GtC/yr • Modeling future ocean & land sink rates is a research challenge and affects calculations concerning atmospheric CO2 concentrations - uncertainty in these models is high.
  • 9.
    Global Warming What ISan acceptable CO2 stabilization level? • Current CO2 concentration is 377 ppm* compared to 280 ppm at the beginning of the industrial age. • Up to now, many scientists have accepted the idea that stabilizing the CO2 concentration at around 500 ppm will avoid disastrous climate change. • A new book by top UK scientists, Avoiding Dangerous Climate Change**, suggests that a more aggressive target of 450 ppm is necessary… But is that enough? * Measured in 2004 at Mauna Loa ** Stabilising climate to avoid dangerous climate change, Hadley Centre for Climate Change http://www.metoffice.com/research/hadleycentre/pubs/brochures/2005/CLIMATE_ CHANGE_JOURNAL_150.pdf
  • 10.
    Global Warming What ISan acceptable CO2 stabilization level? • A report commissioned by the Pentagon* suggests that abrupt climatic change is very possible. One possible scenario involves the interruption of the Gulf Stream because of the effects of massive fresh water inputs from the melting Greenland ice sheet, plunging Europe into a much colder climate (i.e. the collapse of thermohaline circulation) • What is an acceptable level? We don’t know... • However, we do know that the current levels of CO2 are causing significant impacts upon the earth’s climate, which suggests that we need a target below current levels. * An Abrupt Climate Change Scenario and Its Implications for United States National Security Oct 2003, By Peter Schwartz and Doug Randall http://www.grist.org/pdf/AbruptClimateChange2003.pdf
  • 11.
    Climate Mitigation Introduction • Climatechange can be mitigated by various strategies that reduce carbon emissions. • Let’s take a look at one methodology that allows us to quantify the effects of mitigation strategies: stabilization wedges.
  • 12.
    Climate Mitigation Stabilization Wedges •Research papers* by R. Socolow, S. Pacala, et al (Princeton) have introduced the concept of stabilization wedges. • Each wedge represents a reduction of 25Gt of carbon emissions over a 50 year period. • Socolow, et. al present 14 different wedges that are proven technologies that can be scaled and implemented over a 50 year period. • Projects that the implementation of 7 wedges over the next 50 years, followed by even more significant reductions starting in 2050 will keep CO2 concentrations from rising above 500ppm. * Stabilization Wedges: Solving the Climate Problem for the Next 50 Years with Current Technologies, S. Pacal and R. Socolow, Aug 2004 Science Solving the Climate Problem, R. Socolow, R. Hotinski, J.B. Greenblatt, S. Pacala, Dec. 2004 Environment
  • 13.
    Climate Mitigation Stabilization Triangle FromSocolow, et al Historical carbon emissions with two potential pathways for the future “Currently predicted path” is BAU, i.e. 1.5% growth/year Tripling in the graph refers to a tripling of CO2 concentrations compared to pre- industrial levels of 280, and doubling is similarly construed.
  • 14.
    Climate Mitigation Stabilization Wedges Source:Socolow, et al 7 wedges over 50 years followed by more aggressive measures in the following 50 years are sufficient to limit atmospheric CO2 concentrations to around 500 ppm
  • 15.
    Climate Mitigation Stabilization WedgeTypes • Conservation – I.e. using less or simply doing without • Increased energy efficiency – Transportation – Buildings – Industry • Non-carbon energy production – Renewables such as solar, wind and bio-fuels – Carbon sequestration - carbon is removed from carbon based fuels and injected into deep wells as CO2 – Nuclear power • Natural sinks – Planting trees, reducing deforestation
  • 16.
    Climate Mitigation Examples ofa 50 year wedge • Wind electricity (1 wedge) – Deployment of 2000 GW by 2054 – I.e. about 2 million 1MW windmills – 50 times today’s installed base – Windmills cover an area about the size of Germany • Photovoltaic (PV) electricity (1 wedge) – Deployment of 2000 GW by 2054 – Only 3 GW is currently installed – 700 times today’s installed base – Array’s combined area roughly equal to New Jersey • Biofuels (1 wedge) – Requires 1/6 of the world’s cropland – Biofuel feedstock must be grown without fossil fuel inputs • More efficient automobiles (1 wedge) – Increase fuel economy from 30 to 60 mpg for 2 billion cars by 2054 – Today’s installed base is about half a billion cars Source: Socolow, et. al
  • 17.
    Climate Mitigation Stabilization Wedges •Socolow’s 7 wedge projection is based on the following critical assumption: – Business-as-usual (BAU) energy use is 1.5% growth/year (same as current) for the next 50 years. • Note that: – BAU energy use results in a doubling of the rate of global energy use in 50 years in an era which will be characterized by tightening energy supplies. – This is an 80% increase of global per-capita energy use (assuming global population peaks in 2050 at around 9 billion people).
  • 18.
    Climate Mitigation Carbon emissionsand their mitigation • This study… – Models carbon emissions in more detail by breaking down projected carbon based emissions by energy source (oil, gas, coal) and uses plausible depletion scenarios. – Models their mitigation by the application of different numbers of 100 year wedges – Models the effect of delayed implementation of wedges and links each scenario to projected atmospheric CO2 levels and per-capita energy services. • Next… – A number of scenarios that model future carbon emissions and potential mitigation efforts over the next 100 years
  • 19.
    Carbon-based Energy A Tourof Carbon Based Energy Supplies • What follows is a tour of each of the principal carbon- based energy supplies. • Although energy analysts will typically break down supplies into finer detail, we simplify by examining the broad categories of oil, natural gas, and coal. • Let’s start with oil, which will likely be the first to become depleted…
  • 20.
    Carbon-based Energy Oil Production •Consumption to date: ~900 billion barrels • Current consumption/production rate: ~80 million barrels/day or ~30 billion barrels/yr. • Supplies are currently extremely tight: production essentially equals consumption. • Total amount remaining (the remaining oil reserve) is a matter of dispute for reasons that go beyond purely technical ones. • In effect, a giant global poker game; oil reserve numbers are manipulated for business and political reasons.
  • 21.
    Carbon-based Energy Peak Oil •A growing chorus of oil geologists* and other analysts are making total recoverable oil estimates of around 1.2 trillion barrels, and estimate a peak in global oil production somewhere between 2005 and 2030. • Future oil production is likely to follow a depletion profile where extraction peaks at certain point in time and declines after. • After the peak, demand exceeds supply – Price increases and/or instability? – Uncharted territory * Including but not limited to: C.J. Campbell, Jean Laherrere - The End of Cheap Oil Kenneth Deffeyes, Hubbert’s Peak, The Impending World Oil Shortage
  • 22.
    Carbon-based Energy Peak Oil Productionlags discovery Source: C.J. Campbell - Oil Depletion - The Heart of the Matter
  • 23.
    Carbon-based Energy Peak Oil ExxonMobil estimates a peak on non-OPEC conventional oil in 5 years! Source: Exxon Mobil 2005 Energy Outlook After the non- OPEC peak in 2010, production increases will have to come from OPEC. OPEC’s future production capabilities are largely unknown.
  • 24.
    Carbon-based Energy Peak Oil •We can make a reasonable projection of oil depletion by picking a peak year and a subsequent depletion rate, knowing the total estimated reserves. • In all of baseline projections (oil is just the first!) I’ve used exponential growth and decay curves (the same curves as compound interest). • Although the actual shape of the curve for future years may differ from the projected shape, the impact upon CO2 concentrations is largely the same.
  • 25.
    Carbon-based Energy Baseline PeakOil Scenario Oil is almost completely depleted in 50 years
  • 26.
    Carbon-based Energy Natural Gas •Natural gas production is likely to peak roughly 20 years after oil peaks or somewhere between 2010 and 2025. • Industry estimates: – Proved reserves - 6300 Tcf (trillion cubic feet) * – Resources (yet to be discovered) - 4200 Tcf ** • Independent estimates *** – Total recoverable (reserves+resources) of 12,500 Tcf – 185 GtC • Natural gas will be under increasing production pressures as a substitute for oil, despite transport difficulties. * BP Statistical Review of World Energy, June 2005 ** Undiscovered (EIA, International Energy Outlook 2005) *** High Noon for Natural Gas: The New Energy Crisis, by Julian Darley
  • 27.
    Carbon-based Energy Baseline PeakGas Scenario Gas is almost completely depleted by 2075
  • 28.
    Carbon-based Energy Coal • Predictingfuture coal production is difficult because the reserves are still large in comparison with oil and gas. • Estimated remaining coal resources: 1 trillion tons * (~750 GtC emissions) • Baseline scenario assumes current annual growth continues for next 50 years, then starts a gradual decline. • This scenario triples coal production with a peak at around 2085. • Factors that limit coal production: – increasing environmental costs – decreasing EROEI (energy returned on energy invested) • The limits to coal production will be set by carbon emission restrictions and environmental concerns, not by the size of the remaining reserves. * Energy Information Administration (EIA), International Energy Annual 2003
  • 29.
    Carbon-based Energy Baseline CoalScenario Coal is almost completely depleted by 2200 (I.e 200 years left)
  • 30.
    Carbon-based Energy Unmitigated CarbonEmissions • Peak in overall energy production and CO2 emissions at ~10 GtC in around 25 years (compared to Socolow BAU 14 GtC in 2050) • By 2100, energy is obtained exclusively from coal as oil and gas supplies become exhausted • Steep decline in total energy • Serious challenges facing global energy supply
  • 31.
    Carbon-based Energy Unmitigated emissions- CO2 concentrations • Concentrations climb to 2.4x pre- industrial levels by 2150 • Climate worsens substantially or even becomes unstable Sinks are roughly interpolated based on a model described in U. Siegenthaler and F. Joos, Use of Simple Model for Studying Oceanic Tracer Distributions and the Global Carbon Cycle, Tellus 44B (1992): 186-207 Land sink: constant 0.5 GtC/year Ocean sink: 2 GtC/year, rising to 2.5 by 2050, then declining back to 2 by 2100
  • 32.
    Carbon-based Energy Unmitigated emissions- Per capita energy Energy per capita drops precipitously without new energy sources.
  • 33.
    Carbon-based Energy Summary ofcarbon-based energy future • The coming peaks in oil and gas will contribute to a combined peak in energy production in about 25 years. • Coal will then become the principal driver of carbon-based energy sources • Allowing unfettered production of carbon-based fuels will cause our CO2 concentrations to peak at above 650 ppm after 150 years - causing an unacceptable level of warming • The loss of oil & gas resources along with the gradual decline of coal will push the world towards a low-energy regime • The likely peak of global population in 2050 of about 9 billion people will only exacerbate energy issues
  • 34.
    Climate Mitigation Mitigation Scenarios •Fortunately the implementation of wedges can both mitigate CO2 emissions and replace our declining and polluting energy sources with renewable sources • Let’s take a look at how different mitigation scenarios impact CO2 emissions and the resulting atmospheric concentrations…
  • 35.
    Climate Mitigation Wedge modeldetails • Assumptions in allocating the CO2 reductions from wedges: – 50% for new non-carbon energy sources, 50% for efficiency measures. – Conservation is imposed by decreasing yields in oil and gas and is not explicitly included in wedges. – Wedges offset each primary carbon based energy source based on the proportion consumed as predicted by the depletion scenarios – Wedges always displace (not augment) existing energy sources. • Now let’s examine how the implementation of 3 wedges will affect CO2 emissions of oil, gas, and coal…
  • 36.
    Climate Mitigation 3 Wedges:Oil Impact of wedges is moderate because the oil supply runs out early on, and wedge offsets must also be applied to gas and coal
  • 37.
    Climate Mitigation 3 Wedges:Natural Gas Impact of wedges is more pronounced than oil because since the oil supply runs out early on, wedge offsets can now be applied to only gas and coal With mitigation, gas emissions are near ZERO by ~2075.
  • 38.
    Climate Mitigation 3 Wedges:Coal Coal emissions can be cut to ZERO by 2100 with 3 wedges Note that the wedge contribution increases linearly (non-exponential growth), for the first 100 years and then is held constant afterwards
  • 39.
    Climate Mitigation 3 Wedges:All It’s possible to bring total CO2 emissions to ZERO by 2100, but total energy declines by a factor of 3.
  • 40.
    Climate Mitigation 3 Wedges- CO2 Concentration
  • 41.
    Climate Mitigation 3 Wedges- Per capita energy A substantial drop in energy services per capita (Energy per capita calculated based on projections of 9 billion in 2050, then stable population at 9 billion)
  • 42.
    Climate Mitigation 5 Wedges:All 5 wedges can drive CO2 emissions to ZERO in ~75 years
  • 43.
    Climate Mitigation 5 Wedges- CO2 Concentration CO2 concentrations can fall to below current levels in about 150 years.
  • 44.
    Climate Mitigation 5 Wedges- Energy Services per Capita Energy services can come back to around current levels in 100 years, after weathering a very steep drop that begins in about 25 years.
  • 45.
  • 46.
  • 47.
  • 48.
  • 49.
    Conclusions An uncertain future… •Even with aggressive mitigation measures, the world will be significantly warmer over the next 100-200 years • To mitigate climate change, the world will have to cope with significantly less total available energy over the next 100 years, with a peak in roughly 25 years followed by a sharp drop in available energy. • Energy services per capita also faces a significant drop after the energy peak • The coming peaks in oil and gas production will make it somewhat easier to mitigate climate change since there is less carbon to offset. • Appropriate actions can both mitigate climate change and replace obsolete energy sources with new renewable sources.
  • 50.
    Conclusions Implementation of 5Wedges without delay Carbon concentrations peak at just over 450 ppm in about 50 years, then eventually drop to below current levels (350 ppm) by a hundred years after that (in 2155) Peaking at ~450 ppm reduces the risk of severe climate disruption
  • 51.
    Conclusions Implementation of 5Wedges without delay • Energy services per capita declines after total energy peak but recovers to near current level by 2100. • Achieving steady state energy services per capita at or below the current level is a good long term goal for energy sustainability.
  • 52.
    Conclusions Wedge implementation • Implementationof wedges can accomplish: • A replacement for fossil energy sources that will be mostly depleted within 100 year (oil and gas) and 200 year (coal) ranges. • Climate stabilization • A far more efficient energy infrastructure that can serve as the foundation for future innovations. • Delays in wedge implementation cause a higher peak in atmospheric CO2. The longer the delay, the worst the penalty.
  • 53.
    Conclusions Wedge implementation • Wedgeimplementation requires that we think carefully about our future capital investments, both institutionally and individually. • Ideally wedges should be stepping stones to viable long term solutions – not stop-gap measures. • Although wedges can be implemented with non- renewable solutions such as carbon sequestration and nuclear power • Those solutions are only temporary… • Better to invest as much as possible in renewable energy sources.
  • 54.
    Conclusions Challenges ahead requireimmediate action • We should act to set targets and implement wedge strategies without delay. • Inaction or “business as usual” is not an option. • We need to bring new energy sources online AND mitigate global warming. • We need to devise globally effective economic strategies to facilitate the implementation of wedges. • Global warming (and environmental degradation in general) needs appropriate economic price signals.
  • 55.
    Conclusions Uncertainties • CO2 concentrationsmay be higher than estimates if ocean/land sink rates change for the worse. • CO2 concentrations may also be driven higher if other unconventional carbon sources such as oil sands come into significant use. Hopefully, they will NOT enjoy large-scale adoption! Otherwise we need even more wedges! • Sudden climate change is a distinct possibility, but the triggers are largely unknown.
  • 56.
    Conclusions What can Ido? • Educate others on the links between energy & climate. • Think locally AND globally! • Examine personal energy use and carbon emissions • Use less! • Envision strategies for switching to renewable energy. • Choose Green Power (such as PaloAltoGreen). • Drive a HEV or PHEV (pluggable hybrid electric vehicle)*. • Buy carbon offsets (available online). • Urge your municipality to devise a plan for becoming carbon neutral. * A typical HEV (hybrid electric vehicle) is a Toyota Prius or Honda Civic. See www.calcars.org for more info on the promise of PHEVs.
  • 57.
    Conclusions What can Ido? • Lobby congress to: • set wedge implementation targets. • levy a carbon tax. • establish a carbon budget. • Educate yourself and others on what’s happening internationally in this arena • Get creative! Let’s kick-start the fixes for global warming together!
  • 58.
    Thanks! Send comments to: BruceHodge hodge@tenaya.com See this presentation online at: www.tenaya.com/globalwarming