This document summarizes a study of riparian bird communities along streams in the Portland, Oregon metropolitan area. The researchers surveyed birds and plants at 54 sites along streams to examine how bird community metrics related to habitat structure and levels of urbanization. They found that total and non-native bird abundance was higher in narrow forested areas, while native bird abundance was greater in narrow forests surrounded by undeveloped land. Native species richness and diversity were positively associated with less developed areas. At smaller spatial scales of 50-100 meters, most relationships between bird communities and canopy cover or road density were strongest. The results suggest that increasing urban forest canopy cover, especially within 450 meters of streams, is the most effective action for conserving native breeding
![BioOne sees sustainable scholarly publishing as an inherently collaborative enterprise connecting authors, nonprofit publishers, academic institutions, research
libraries, and research funders in the common goal of maximizing access to critical research.
RIPARIAN BIRD COMMUNITY STRUCTURE IN PORTLAND, OREGON:
HABITAT, URBANIZATION, AND SPATIAL SCALE PATTERNS
Author(s): Lori A. Hennings and W. Daniel Edge
Source: The Condor, 105(2):288-302. 2003.
Published By: Cooper Ornithological Society
DOI: 10.1650/0010-5422(2003)105[0288:RBCSIP]2.0.CO;2
URL:
http://www.bioone.org/doi/full/10.1650/0010-
5422%282003%29105%5B0288%3ARBCSIP%5D2.0.CO%3B2
BioOne (www.bioone.org) is an electronic aggregator of bioscience research content, and the online home to over
160 journals and books published by not-for-profit societies, associations, museums, institutions, and presses.
Your use of this PDF, the BioOne Web site, and all posted and associated content indicates your acceptance of
BioOne’s Terms of Use, available at www.bioone.org/page/terms_of_use.
Usage of BioOne content is strictly limited to personal, educational, and non-commercial use. Commercial inquiries
or rights and permissions requests should be directed to the individual publisher as copyright holder.](https://image.slidesharecdn.com/1f97345e-f48e-4f05-80a6-af2beec25d97-150330180253-conversion-gate01/85/Hennings-Edge-Condor-paper-1-320.jpg)
![BioOne sees sustainable scholarly publishing as an inherently collaborative enterprise connecting authors, nonprofit publishers, academic institutions, research
libraries, and research funders in the common goal of maximizing access to critical research.
RIPARIAN BIRD COMMUNITY STRUCTURE IN PORTLAND, OREGON:
HABITAT, URBANIZATION, AND SPATIAL SCALE PATTERNS
Author(s): Lori A. Hennings and W. Daniel Edge
Source: The Condor, 105(2):288-302. 2003.
Published By: Cooper Ornithological Society
DOI: 10.1650/0010-5422(2003)105[0288:RBCSIP]2.0.CO;2
URL:
http://www.bioone.org/doi/full/10.1650/0010-
5422%282003%29105%5B0288%3ARBCSIP%5D2.0.CO%3B2
BioOne (www.bioone.org) is an electronic aggregator of bioscience research content, and the online home to over
160 journals and books published by not-for-profit societies, associations, museums, institutions, and presses.
Your use of this PDF, the BioOne Web site, and all posted and associated content indicates your acceptance of
BioOne’s Terms of Use, available at www.bioone.org/page/terms_of_use.
Usage of BioOne content is strictly limited to personal, educational, and non-commercial use. Commercial inquiries
or rights and permissions requests should be directed to the individual publisher as copyright holder.](https://image.slidesharecdn.com/1f97345e-f48e-4f05-80a6-af2beec25d97-150330180253-conversion-gate01/75/Hennings-Edge-Condor-paper-1-2048.jpg)
![[288]
The Condor 105:288–302
᭧ The Cooper Ornithological Society 2003
RIPARIAN BIRD COMMUNITY STRUCTURE IN PORTLAND,
OREGON: HABITAT, URBANIZATION, AND SPATIAL
SCALE PATTERNS
LORI A. HENNINGS1 AND W. DANIEL EDGE
Department of Fisheries and Wildlife, Nash 104, Oregon State University, Corvallis, OR 97331-3803
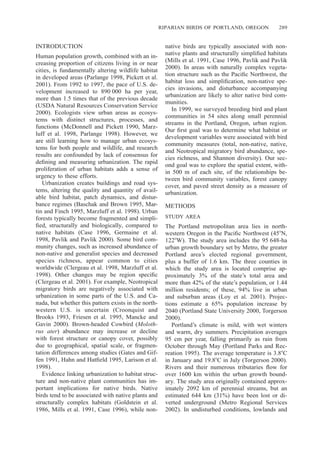
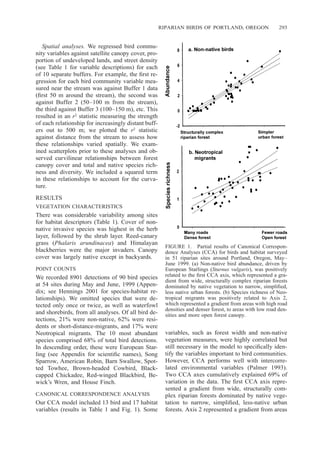
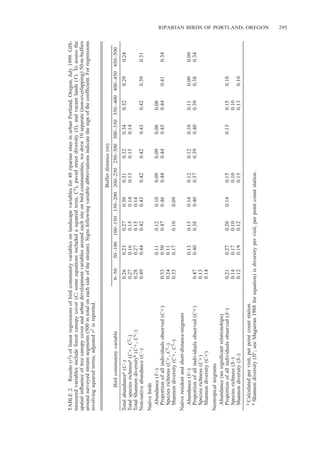
Abstract. In 1999, we surveyed breeding bird and plant communities along 54 streams
in the Portland, Oregon, metropolitan region to link bird community metrics with structural
and spatial characteristics of urban riparian areas. Canonical correspondence analysis pro-
duced two explanatory axes relating to vegetation and road density. Total and non-native
bird abundance was higher in narrow forests. Native bird abundance was greater in narrow
forests surrounded by undeveloped lands; native species richness and diversity were greater
in less-developed areas. Native resident and short-distance-migrant abundance was higher
in narrow forests, and diversity was positively associated with developed lands. Neotropical
migrant abundance, richness, and diversity were greater in open-canopied areas with fewer
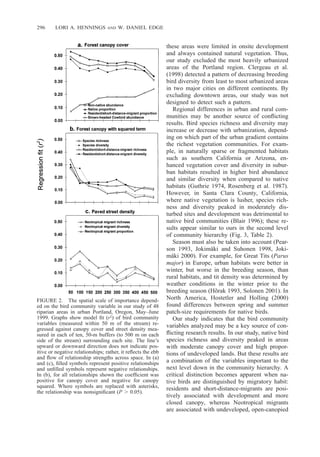
roads. We examined spatial relationships by regressing bird variables on satellite-derived
forest canopy cover, area of undeveloped lands, and street density in a series of 50-m buffers
within a 500-m radius around study sites. Non-native bird abundance decreased with in-
creasing canopy cover within 450 m, but most other relationships were strongest at smaller
scales (50–100 m). Our results suggest that increasing urban canopy cover is the most
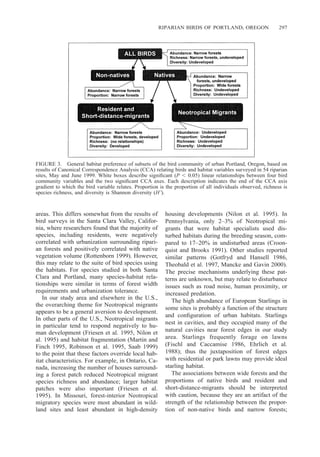
valuable land management action for conserving native breeding birds. A hierarchical
scheme for Neotropical migrant conservation might include increasing forest canopy within
450 m of streams to control non-native species and cowbirds; reducing street density within
a 100-m radius of streams; and conserving or planting onsite native trees and shrubs.
Key words: edge effects, Neotropical migrant, non-native species, riparian, spatial scale,
urban.
Estructura de Comunidades Riparias de Aves en Portland, Oregon: Ha´bitat, Urbanizacio´n y
Patrones de Escala Espacial
Resumen. Censamos las comunidades de aves reproductivas y plantas a lo largo de 54
arroyos en el a´rea metropolitana de Portland, Oregon en 1999 para conectar medidas de
comunidades de aves con caracterı´sticas estructurales y espaciales de zonas riparias urbanas.
Ana´lisis de correspondencia cano´nica produjeron dos ejes explicativos relacionados con la
vegetacio´n y la densidad de carreteras. La abundancia total de aves y la de aves no nativas
fueron mayores en bosques estrechos. La abundancia de aves nativas fue mayor en bosques
estrechos rodeados por terrenos rurales y la riqueza y diversidad de especies fueron mayores
en a´reas menos desarrolladas. La abundancia de residentes nativas y migratorias de corta
distancia fue mayor en bosques estrechos y su diversidad estuvo asociada positivamente con
terrenos desarrollados. La abundancia, riqueza y diversidad de las migratorias neotropicales
fueron mayores en a´reas de dosel abierto y con pocas carreteras. Examinamos las relaciones
espaciales mediante regresiones entre variables de aves y la cobertura del dosel derivada de
ima´genes satelitales, el a´rea de terrenos sin desarrollar y la densidad de calles en una serie
de a´reas de 50 m de ancho en un radio de 500 m alrededor de los sitios de estudio. La
abundancia de aves no nativas disminuyo´ con aumentos en la cobertura del dosel hasta 450
m, pero la mayorı´a de las dema´s relaciones fueron ma´s fuertes a escalas menores (50–100
m). Nuestros resultados sugieren que el incremento de la cobertura del dosel en a´reas urbanas
es la estrategia de manejo ma´s valiosa para conservar las aves nativas que se reproducen
en el a´rea. Un esquema jera´rquico para la conservacio´n de las migratorias neotropicales
podrı´a incluir aumentar la cobertura de bosque a menos de 450 m de los arroyos para
controlar a las especies no nativas y a los Molothrus, reducir la densidad de calles dentro
de un radio de 100 m alrededor de los arroyos y conservar o plantar a´rboles y arbustos
nativos.
Manuscript received 13 August 2001; accepted 23 December 2002.
1 Present address: Metro Regional Services, 600 NE Grand Avenue, Portland, OR 97232-2736. E-mail:
hennings@metro.dst.or.us](https://image.slidesharecdn.com/1f97345e-f48e-4f05-80a6-af2beec25d97-150330180253-conversion-gate01/85/Hennings-Edge-Condor-paper-2-320.jpg)
![RIPARIAN BIRDS OF PORTLAND, OREGON 299
LITERATURE CITED
BASCHAK, L. A., AND R. D. BROWN. 1995. An ecolog-
ical framework for the planning, design and man-
agement of urban river greenways. Landscape and
Urban Planning 33:211–225.
BLAIR, R. B. 1996. Land use and avian species diver-
sity along an urban gradient. Ecological Applica-
tions 6:506–519.
CASE, T. J. 1996. Global patterns in the establishment
and distribution of exotic birds. Biological Con-
servation 78:69–96.
CLERGEAU, P., J. JOKIMA¨ KI, AND J.-P. L. SAVARD. 2001.
Are urban bird communities influenced by the bird
diversity of adjacent landscapes? Journal of Ap-
plied Ecology 38:1122–1134.
CLERGEAU, P., J.-P. L. SAVARD, G. MENNECHEZ, AND G.
FALARDEAU. 1998. Bird abundance and diversity
along an urban-rural gradient: a comparative study
between two cities on different continents. Condor
100:413–425.
COKER, D. R., AND D. E. CAPEN. 1995. Landscape-level
habitat use by Brown-headed Cowbirds in Vermont.
Journal of Wildlife Management 59:631–637.
CROONQUIST, M. J., AND R. P. BROOKS. 1991. Use of
avian and mammalian guilds as indicators of cu-
mulative impacts in riparian-wetland areas. Envi-
ronmental Management 15:701–714.
CROONQUIST, M. J., AND R. P. BROOKS. 1993. Effects
of habitat disturbance on bird communities in ri-
parian corridors. Journal of Soil and Water Con-
servation 48:65–70.
EHRLICH, P. R., D. S. DOBKIN, AND D. WHEYE. 1988.
The birder’s handbook. Simon and Schuster, New
York.
ENVIRONMENTAL SYSTEMS RESEARCH INSTITUTE, INC.
1998. ArcView Geographic Information Systems
version 3.1. Environmental Systems Research In-
stitute, Inc., Redlands, CA.
FAUTH, P. T., E. J. GUSTAFSON, AND K. N. RABENOLD.
2000. Using landscape metrics to model source
habitat for Neotropical migrants in the midwestern
U.S. Landscape Ecology 15:621–631.
FERGUSON, H. L., K. ROBINETTE, AND K. STENBERG.
2001. Wildlife of urban habitats, p. 317–341. In
D. Johnson and T. O’Neil [EDS.], Wildlife habitats
and relationships in Oregon and Washington.
Oregon State University Press, Corvallis, OR.
FERNA´ NDEZ-JURICIC, E. 2000. Avifaunal use of wooded
streets in an urban landscape. Conservation Biol-
ogy 14:513–521.
FISCHL, J., AND D. F. CACCAMISE. 1986. Relationships of
diet and roosting behavior in the European Starling.
American Midland Naturalist 117:395–404.
FOREST ECOSYSTEM MANAGEMENT ASSESSMENT TEAM.
1993. Forest ecosystem management: an ecologi-
cal, economic and social assessment. Forest Eco-
system Management Assessment Team, report
number 1993-793-071. United States Government
Printing Office, Washington, DC.
FREEMARK, K. E., AND H. G. MERRIAM. 1986. Impor-
tance of area and habitat heterogeneity to bird as-
semblages in temperate forest fragments. Biolog-
ical Conservation 36:115–141.
FRIESEN, L. E., P. F. J. EAGLES, AND R. J. MACKAY.
1995. Effects of residential development on for-
est-dwelling Neotropical migrant songbirds. Con-
servation Biology 9:1408–1414.
GATES, J. E., AND N. R. GIFFEN. 1991. Neotropical mi-
grant birds and edge effects at a forest-stream eco-
tone. Wilson Bulletin 103:204–217.
GERMAINE, S. S., S. S. ROSENSTOCK, R. E. SCHWEINS-
BURG, AND R. W. SCOTT. 1998. Relationships
among breeding birds, habitat, and residential de-
velopment in greater Tucson. Ecological Appli-
cations 8:680–691.
GOLDSTEIN, E. L., M. GROSS, AND R. M. DEGRAAF.
1986. Breeding birds and vegetation: a quantita-
tive assessment. Urban Ecology 9:377–385.
GOTFRYD, A., AND R. I. C. HANSELL. 1986. Prediction
of bird-community metrics in urban woodlots, p.
321–326. In J. Verner, M. L. Morrison, and C. J.
Ralph [EDS.], Modeling habitat relationships of
terrestrial vertebrates. University of Wisconsin
Press, Madison, WI.
GUTHRIE, D. A. 1974. Suburban bird populations in
southern California. American Midland Naturalist
92:461–466.
HAHN, D. C., AND J. S. HATFIELD. 1995. Parasitism at
the landscape scale: cowbirds prefer forests. Con-
servation Biology 9:1415–1424.
HANSEN, A. J., S. L. GARMAN, B. MARKS, AND D. L.
URBAN. 1993. An approach for managing verte-
brate species across multiple-use landscapes. Eco-
logical Applications 3:481–496.
HENNINGS, L. A. 2001. Riparian bird communities in
Portland, Oregon: habitat, urbanization, and spa-
tial scale patterns. M.Sc. thesis, Oregon State Uni-
versity, Corvallis, OR.
HILDEN, O. 1965. Habitat selection in birds. Annales
Zoologici Fennici 2:53–75.
HO˜ RAK, P. 1993. Low fledging success of urban Great
Tits. Ornis Fennica 70:168–172.
HOSTETLER, M., AND C. S. HOLLING. 2000. Detecting
the scales at which birds respond to structure in
urban landscapes. Urban Ecosystems 4:25–42.
JOKIMA¨ KI, J. 2000. Occurrence of urban bird species in
urban parks: effects of park structure and broad
scale variables. Urban Ecosystems 3:21–34.
JOKIMA¨ KI, J., AND E. HUHTA. 2000. Artificial nest pre-
dation and abundance of birds along an urban gra-
dient. Condor 102:838–847.
JOKIMA¨ KI, J., AND J. SUHONEN. 1998. Distribution and
habitat selection of wintering birds in urban en-
vironments. Landscape and Urban Planning 39:
253–263.
LARISON, B., S. A. LAYMON, P. L. WILLIAMS, AND T. B.
SMITH. 1998. Song Sparrows vs. cowbird brood
parasites: impacts of forest structure and nest-site
selection. Condor 100:93–101.
LEV, E., AND L. SHARP. 1991. The Portland-Vancouver
natural areas inventory: field surveys and prelim-
inary wildlife data, p. 236–241. In L. W. Adams
and D. L. Leedy [EDS.], Wildlife conservation in
metropolitan environments. National Institute for
Urban Wildlife Symposium Series 2. National In-
stitute for Urban Wildlife, Columbia, MD.](https://image.slidesharecdn.com/1f97345e-f48e-4f05-80a6-af2beec25d97-150330180253-conversion-gate01/85/Hennings-Edge-Condor-paper-13-320.jpg)
![300 LORI A. HENNINGS AND W. DANIEL EDGE
LOY, W. G., S. ALLAN, A. R. BUCKLEY, AND J. E. MEA-
CHAM. 2001. Atlas of Oregon. 2nd ed. University
of Oregon Press, Eugene, OR.
MAGURRAN, A. E. 1988. Ecological diversity and its
measurement. Princeton University Press, Prince-
ton, NJ.
MANCKE, R. G., AND R. A. GAVIN. 2000. Breeding bird
density in woodlots: effects of depth and buildings
at the edge. Ecological Applications 10:598–611.
MARTIN, T. E., AND D. M. FINCH. 1995. Ecology and
management of Neotropical migratory birds, a
synthesis and review of critical issues. Oxford
University Press, New York.
MARZLUFF, J. M., F. R. GEHLBACH, AND D. A. MANU-
WAL. 1998. Urban environments: influences on
avifauna and challenges for the avian conserva-
tionist, p. 283–299. In J. M. Marzluff and R. Sa-
llabanks [EDS.], Avian conservation: research and
management. Island Press, Washington, DC.
MAY, C. M., AND R. R. HORNER. 2000. The cumulative
impacts of watershed urbanization on stream-ri-
parian ecosystems, p. 281–286. In P. J. Wigington
and R. L. Beschta [EDS.], Proceedings of the in-
ternational conference on riparian ecology and
management in multi-land use watersheds. Amer-
ican Water Resources Association, Portland, OR.
MAY, C., R. R. HORNER, J. R. KARR, B. W. MAR, AND
E. B. WELCH. 1997. Effects of urbanization on
small streams in the Puget Sound Lowland ecore-
gion. Watershed Protection Techniques 2:483–494.
MCCUNE, B., AND M. J. MEFFORD. 1999. PC-ORD for
Windows: multivariate analysis of ecological data.
Version 4.20. MjM Software, Gleneden Beach, OR.
MCDONNELL, M. J., AND S. T. A. PICKETT. 1990. Eco-
system structure and function along urban-rural
gradients: an unexploited opportunity for ecology.
Ecology 71:1232–1237.
MCINTYRE, N. E., K. KNOWLES-YANEZ, AND D. HOPE.
2001. Urban ecology as an interdisciplinary field:
differences in the use of ‘‘urban’’ between the social
and natural sciences. Urban Ecosystems 4:5–24.
METRO REGIONAL SERVICES. 2002. Metro’s technical re-
port for Goal 5. Metro Regional Services, Port-
land, OR.
METRO REGIONAL SERVICES [ONLINE]. 2003. Regional
land information system metadata viewer. Ͻhttp://
mazama.metro-region.org/metadataϾ (21 January
2003).
MILLS, G. S., J. B. DUNNING JR., AND J. M. BATES.
1991. The relationship between breeding bird den-
sity and vegetation volume. Wilson Bulletin 103:
468–479.
NILON, C. H., C. N. LONG, AND W. C. ZIPPERER. 1995.
Effects of wildland development on forest bird
communities. Landscape and Urban Planning 32:
81–92.
PALMER, M. W. 1993. Putting things in even better or-
der: the advantages of canonical correspondence
analysis. Ecology 74:2215–2230.
PARLANGE, M. 1998. The city as ecosystem. Bio-
Science 48:581–585.
PAVLIK, J., AND S. PAVLIK. 2000. Some relationships be-
tween human impact, vegetation, and birds in urban
environment. Ekologia-Bratislava 19:392–408.
PEARSON, S. M. 1993. The spatial extent and relative
influence of landscape-level factors on wintering
bird populations. Landscape Ecology 8:3–18.
PICKETT, S. T. A., M. L. CADENASSO, J. M. GROVE, C.
H. NILON, R. V. POUYAT, W. C. ZIPPERER, AND R.
COSTANZA. 2001. Urban ecological systems: link-
ing terrestrial ecology, physical, and socioeco-
nomic components of metropolitan areas. Annual
Review of Ecology and Systematics 32:333–365.
PORACSKY, J. 1991. The Portland-Vancouver natural
areas inventory: photo interpretation and map-
ping, p. 231–235. In L. W. Adams and D. L.
Leedy [EDS.], Wildlife conservation in metropoli-
tan environments. National Institute for Urban
Wildlife Symposium Series 2. National Institute
for Urban Wildlife, Columbia, MD.
PORTLAND PARKS AND RECREATION. 1995. Portland’s ur-
ban forestry management plan. Ordinance No.
168979, adopted by City Council effective July 28,
1995. Portland Parks and Recreation, Portland, OR.
PORTLAND STATE UNIVERSITY. 2000. Final population
estimates for Oregon, its counties, and incorpo-
rated cities: July 1, 1999. Center for Population
Research and Census, School of Urban and Public
Affairs, Portland State University, Portland, OR.
RALPH, C. J., G. R. GEUPEL, P. PYLE, T. E. MARTIN,
AND D. F. DESANTE [EDS.]. 1993. Handbook of
field methods for monitoring landbirds. USDA
Forest Service General Technical Report PSW-
GTR-144.
ROBINSON, S. K., F. R. THOMPSON III, T. M. DONOVAN,
D. R. WHITEHEAD, AND J. FAABORG. 1995. Re-
gional forest fragmentation and the nesting suc-
cess of migratory birds. Science 267:1987–1990.
ROSENBERG, K. V., S. B. TERRILL, AND G. H. ROSEN-
BERG. 1987. Value of suburban habitats to desert
riparian birds. Wilson Bulletin 99:642–654.
ROTTENBORN, S. C. 1999. Predicting the impacts of ur-
banization on riparian bird communities. Biolog-
ical Conservation 88:289–299.
SAAB, V. 1999. Importance of spatial scale to habitat use
by breeding birds in riparian forests: a hierarchical
analysis. Ecological Applications 9:135–151.
SOLONEN, T. 2001. Breeding of the Great Tit and Blue
Tit in urban and rural habitats in southern Finland.
Ornis Fennica 78:49–60.
TER BRAAK, C. J. F. 1986. Canonical correspondence anal-
ysis: a new eigenvector technique for multivariate
direct gradient analysis. Ecology 67:1167–1179.
THEOBALD, D. M., J. R. MILLER, AND N. T. HOBBS.
1997. Estimating the cumulative effects of devel-
opment on wildlife habitat. Landscape and Urban
Planning 39:25–36.
TORGERSON, T. 2000. The Oregon blue book. Oregon
Office of the Secretary of State Bill Bradbury, Sa-
lem, OR.
USDA NATURAL RESOURCES CONSERVATION SERVICE.
2000. 1997 natural resources inventory: highlights.
Revised December 2000. USDA Natural Resources
Conservation Service, Washington, DC.
VAN HORNE, B. 1983. Density as a misleading indi-
cator of habitat quality. Journal of Wildlife Man-
agement 47:893–901.
WIENS, J. A. 1989. Spatial scaling in ecology. Func-
tional Ecology 3:385–397.](https://image.slidesharecdn.com/1f97345e-f48e-4f05-80a6-af2beec25d97-150330180253-conversion-gate01/85/Hennings-Edge-Condor-paper-14-320.jpg)