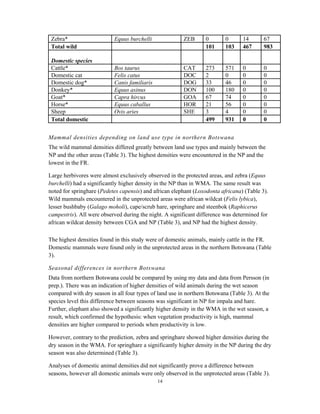
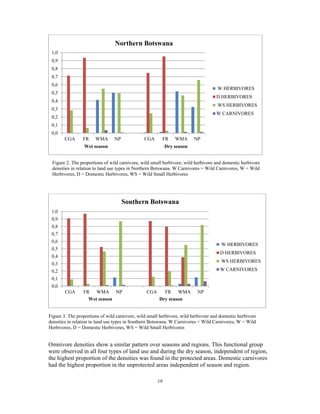
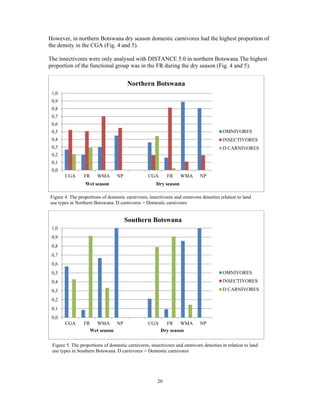
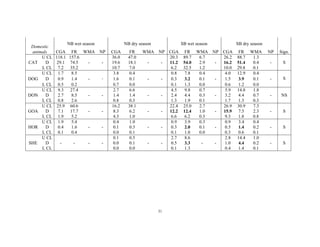
This document summarizes a study on mammal densities in the Kalahari region of Botswana and how they are impacted by seasons and land use. The study compares mammal densities across four different land use areas - Communal Grazing Areas, Fenced Ranches, Wildlife Management Areas, and National Parks. Previous studies have shown that human activities like livestock grazing can negatively impact wildlife by reducing resources and fragmenting the landscape. The goal of this study was to investigate how spatial and temporal variations in mammal densities relate to different types of human land use. Large and medium herbivores and carnivores were found to be most affected by human activities, while smaller mammals were least affected. Seasonal and regional environmental differences had less impact than the
Article 'Response of moths (Lepidoptera: Heterocera) to livestock grazing in Mongolian rangelands' by Khishigdelger Enkhtura, Martin Pfeiffera, Ariuntsetseg Lkhagvaa, Bazartseren Boldgiva
Diversity of Soil Fauna and Ecosystem Function tariqulmasud12
Soils are natural resources of utmost. Importance for a number of ecosystem and biosphere processes such as plant production, cycling of organic matter and nutrients, storage of C and water, and release of nitrous oxides, CO2 and methane. Soil degradation, through various processes, is a matter of great concern, since their integrity is absolutely critical to increasing food production (FAO, 1995), and regulating atmospheric fluxes of greenhouse gases (Jenkinson, 199 1 ; Wallace, 1994).
Time of day influences foraging behavior of waterbirds in the Kruger National...Joseph Galaske
This project, conducted under the supervision of Mduduzi Ndlovu Ph.D., was conducted within the Kruger National Park and looked at foraging behavior of waterbirds in response to time of day. Our results present evidence that time of day mediates foraging activity and supports the optimal foraging theory for waterbirds found in the Kruger National Park.
Diversity and abundance of terrestrial mammals in the northern periphery of ...Innspub Net
The Tanoé-Ehy Marsh Forest (TEMF), an unprotected forest that is about to be turn into a voluntary nature reserve is a forest block in south-eastern Côte d’Ivoire known as being of great importance for the conservation of biodiversity. But in the rainy season, that forest is largely over flooded and terrestrial mammals are likely to move to the periphery and make them vulnerable to anthropogenic threats. Our objectives are to determine the diversity, the relative abundance of terrestrial mammals and their spatial distribution in the northern periphery of the TEMF during the rainy season. We collected data by conducting recce surveys after interviews with local people. In total, we obtained 33 species among which ten primates’ species were identified. According to the recce survey, the African Civet (Civettictis civetta) and the Bushbuck (Tragelaphus scriptus) are the most common and abundant species in the study area with 12.7% and 12.0% of relative abundance respectively. In addition, six of the listed species are on the IUCN Red List, including Piliocolobus waldronae, a critically endangered species, Cercocebus lunulatus and Cercopithecus roloway endangered species, Colobus vellerosus, Phataginus tetradactyla and Phataginus tricuspis, three vulnerable species. Thus, the consideration of the periphery for the sustainable management of the TEMF is proving to be an imperative.
Tovacov lakes, and the whole area affected by mining, represents a very important refuge for many rare species of plants and animals that can’t find suitable living conditions in the surrounding intensively farmed landscape. Due to the high level of underground water and the presence of gravel bed, Tovacov lakes can be very important wetlands but also interesting xerotherm habitat in the future. Our aim is not only to identify this biodiversity, but also to support it in the future by targeted interventions.
In the first phase of the project large field survey of different habitats were carried out. These surveys will be focused on characteristic areas that differ in moisture, age and the way they were created. Apart from vascular plants and vegetation, we will be focused on major groups of organisms for which such habitats are essential and at the same time there isn’t enough historical data. These are mainly beetles, butterflies and spiders, but other groups of animals will not be left out.
In the second phase a comparison of diversity of locally rare species with their representation in the various habitats was completed. In this way the mapping of biologically valuable sites and habitats that create appropriate conditions for the occurrence of target species is done.
In the third part, created design principles of management for such areas that will support the best possible future existence of discovered organisms and will create suitable biotopes for other types of communities of plants and animals.
The project won the International contest of the Quarry Life Award 2014 in the category “Biodiversity Enhancement”
Read more: http://www.quarrylifeaward.com/project/research-biodiversity-tovacov-lakes
Regional and global elevational patterns of microbial species richness and ev...sediman
Although elevational gradients in microbial biodiversity have attracted increasing attention recently, the generality in the patterns and underlying mechanisms are still poorly resolved. Further, previous studies focused mostly on species richness, while left understudied evenness, another important aspect of biodiversity. Here, we studied the elevational patterns in species richness and evenness of stream bio lm bacteria and diatoms in six mountains in Asia and Europe. We also reviewed published results for elevational richness patterns for soil and stream microbes in a literature analysis. Our results revealed that even within the same ecosystem type (that is, stream) or geographical region, bacteria and diatoms showed contrasting patterns in diversity. Stream microbes, including present stream data, tend to show signi cantly increasing or decreasing elevational patterns in richness, contrasting the ndings for soil microbes that typically showed nonsigni cant or signi cantly decreasing patterns. In all six mountains for bacteria and in four mountains for diatoms, species richness and evenness were positively correlated. e variation in bacteria and diatom richness and evenness were substantially explained by anthropogenic driven factors, such as total phosphorus (TP). However, diatom richness and evenness were also related to di erent main drivers as richness was mostly related to pH, while evenness was most explained by TP. Our results highlight the lack of consistent elevational biodiversity patterns of microbes and further indicate that the two facets of biodiversity may respond di erently to environmental gradients.
Population: Carrying Capacity and Limiting Factors in Natural systemsPaliNalu
What is earth's planetary carrying capacity for a modern, industrialized humanity with a properous standard of living for all? Explores limits and population limiting factors in real-world and biospheric systems.
Popularly known as ‘The King of Glands’, the pituitary gland is basically a small circular gland protruding off the hypothalamus at the base of the brain. The excellent for Pituitary Tumour Surgery and Treatment in India and it should be preferred for professionalism with a personal touch.
Free Range Livestock Influence Species Richness, Occupancy, and Daily Behavio...UniversitasGadjahMada
In some developing countries, human activities in protected areas threaten wildlife populations and their habitats. This study was conducted to understand the influences of freerange livestock on the wild mammalian population in Baluran National Park, Indonesia. There were 3,852 and 1,156 cows and goats, respectively, and livestock occupied an area of approximately 55.96 km2. The species richness and probability of occupancy in areas with and without livestock were assessed, and the spatial co-occurrence and overlap of daily activity patterns among mammalian species and livestock were measured. A total of 39 camera traps were installed from August 2015 to January 2016, collecting 23,021 independent photographs. In areas with livestock, the number of mammal species (eight) was lower than in areas without livestock (11 species). The most affected species were the large herbivores Bubalus bubalis and Bos javanicus, and a large carnivore Panthera pardus, all of which were absent in areas with livestock. Regardless of the feeding guild, the probability of
occupancy of almost all species declined in areas with livestock, except the medium herbivores Paradoxurus hermaphroditus and Hystrix javanica that showed a higher probability of occupancy. The species whose probability of occupancy declined were the carnivores Cuon alpinus and Prionailurus bengalensis; the herbivores Rusa timorensis, Tracypithecus auratus and Muntiacus muntjak; and the omnivore Sus scrofa. In the presence of livestock, R. timorensis and S. scrofa changed their activities from diurnal to nocturnal. Livestock affected most wild mammals in several ways, including by reducing the species richness, lessening the probability of occupancy and changing the daily activity patterns of many animals. This research recommends a significant reduction in the size of the range area for domestic livestock.
Status of Bushbuck (Tragelaphus scriptus) and Buffalo (Syncerus caffer) in th...AI Publications
The study titled “Status of Bushbuck (Tragelaphus scriptus) and Buffalo (Syncerus caffer) in the North and South Eastern parts of the Kimbi-Fungom National Park (K-FNP) of the North West Region of Cameroon” was carried out in the rainy season from 1st May to 31st July 2015. The general objective was to contribute to the conservation of bushbuck and Buffalo in the K-FNP through the establishment of status of mammals which will serve as a guide for management decisions. The methodology employed was the “recce-walk”. Twenty seven (27) lines transects of 2 km long each were walked making a total effort of 53km. One hundred and fifty six (156) questionnaires were administered to the local population, twenty one (21) semi-structured interviews to households and seven (7) focus group discussions with local chiefs and notables were used to get local people’s perceptions about wildlife conservation in the NP. Results revealed a total of 13 species of mammals within the NP belonging to 6 families. The Bovidae family had the highest number of species represented by the buffalo (Syncerus caffer), bushbuck (Tragelaphus scriptus), the blue duiker (Cephalophus monticola) and the red duiker (Cephalophus dorsalis). The buffalo and the bushbuck recorded encounter rates of 0.85 and 0.34sign/km respectively. The Buffalo had a higher density in the North East of the South East compartment of the park while the bushbuck had a higher density in the south west of the north east compartment. There was a strong relationship (R2=0.792) between the encounter rate of mammals and anthropogenic activities. Ninety two (92.31%) of respondents recognized the importance of the NP because they depended on it for collection of NTFP’s (34.60%), hunting of Bushmeat (12.80%), fuel wood gathering (7.70%), religious activities (6.40%), agricultural land (5.10%), harvesting of medicinal plants(5.10%), source of clean water (5.10%), traditional rituals (3.80%) and traditional medicine harvesting (2.6%). Ninety seven percent (97.2%) supported wildlife conservation because of its touristic, aesthetic and for sustainability. Thirty four percent (34.60%) of the respondents were aware of community implication in managing the NP. K-FNP is poor in species abundance, species richness and flagship species. Associated benefits from ecotourism are far-fetched coupled with encroachment by grazers. We therefore recommend that the government, councils, NGOs and the local communities should step up conservation efforts.
Despite the numerous benefits and advantages gotten from biodiversity, it is under serious threat as a result of human activities. The main dangers worldwide are population growth and resource consumption, climate change and global warming, habitat conversion and urbanization, invasive alien species, over-exploitation of natural resources and environmental degradation.
The present study aims to investigate the biodiversity of woody vegetation along a gradient of human impacting region in the three constituent parts of Ferlo Biosphere Reserve (FBR): the core area, the buffer zone and the transition area. We conducted an inventory of 110 plots of 900 m² each. Total species richness was 49 species distributed in 32 genera within 16 botanical families. The analysis of contesimal frequency showed that Guiera senegalensis is the most common species with a presence of 75% of such records. Examination of species abundance spectrum showed that four most abundant species such as Guiera senegalensis (29.5%), Combretum glutinosum (15.9%), Pterocarpus lucens (11.6%) and Boscia senegalensis (10 , 5%). These four species represent 68% of the total individuals of the RBF and are also the four most common species. The spectrum of abundance of families showed that Combretaceae is the best represented family with almost half of the number of species (49.7%). The representativeness of biological types and geographical affinity of the species has been established for the woody vegetation in the study area. The study of diversity indices revealed that the buffer zone and the transition area are subjected to multiple uses and experiencing human action. It has a greater diversity and a level of organization with higher timber stand than the central area which is an integral conservation zone.
Human Wildlife Conflicts to communities surrounding Mikumi National Parks in ...IJEAB
Human wildlife interaction is not a new phenomenon, it has existed since the beginning of humankind, it is evidenced by the fact that, many national parks are surrounded by human residents. The interaction between human and wildlife is of different nature depending on the culture of the surrounding human as well as wildlife community. For decade’s human wildlife conflicts has been a great conservation challenge due to increased human population, international trade and change of policies. The challenge is more significant in a sense that it negatively affects both human and wildlife sustainability. Therefore a study was conducted to villages surrounding Mikumi national Park to assess reasons for conflicts between human and wildlife and account how communities prevent wild animals to destructs their agriculture products. Three villages were selected for study (Doma, Maharaka and Mkata, all villages surrounds Mikumi National Park Ecosystems. Different methodology includes: - Field observation, Household survey, Field interview, In-depth interview and Ethnography study were used. However descriptive analysis and non parametric test were performed by using SPSS 16 versions and Kruskal-wallis test respectively to compute mean, standard error, percentages and differences of wildlife consumption. Results suggests that, there is a gradual increase of human-wildlife conflicts which lead to loss of people’s lives, as well as their livelihoods such as farms and farms product. Statistically results depicted that the average size of the farm affected at Doma, Maharaka and Mkata villages were 3.8 ± 0.1, 2.0 ± 0.1 and 2.2 ± 0.1 acres respectively, while at Mkata village 32 goats, 24 sheep and 76 cattle were reported to be killed by wild carnivores. In other way conflicts may result to poaching activities which may threaten the existence of huge herbivores such as Elephants and Rhinoceros. Apart from that, conflicts may lead to poor performances of tourism industry in the country. Research recommends that more efforts should be taken by the government and other stakeholders to prevent conflicts around all national parks so as to create good and conducive environment for human being life and wildlife in order to allow good performance of tourism industry for economic development of the country.
Marine Biodiversity : A Global Pattern Essay
Biodiversity And Biodiversity
Big Idea Biodiversity
Biodiversity And Its Impact On Biodiversity
biodiversity Essay
Biodiversity
Biological Diversity
The Importance Of Biodiversity
Essay about The Importance of Biodiversity
Essay On Endangered Plants
Persuasive Essay On Biodiversity Conservation
Reflection Essay On Biodiversity
Biodiversity Loss And Loss Of Species Essay
Biodiversity And Its Effects On The Environment
Essay on Biodiversity
The Study of Biodiversity
Biodiversity And Its Effects On Biodiversity
Biological Diversity Essay
The Importance of Biodiversity
The Assessment of Human-Snake Interaction and its Outcome in the City of KumbaAI Publications
Throughout history humans have had an uneasy relationship with serpents. Snakes are animals that fascinate many people while frightening others, good or bad, most people have strong feelings about snakes, but few people remain neutral. Most human-snake interactions had lead to the destruction of snakes due to human inability to control fear and panic. The indiscriminate killing of snakes for presumed human safety has drastically reduced the population of many snake species to the level of extirpation. The objective of this, however, is to examine the human interaction with snakes in city of Kumba. To get this survey done, a total number of two hundred and fifty questionnaires were administered to a randomly selected population sample in the study area. The results of the survey revealed that the prevention of snake attacks and the opinion of people on snake population management is significantly related (X2 = 11.069 df=4, P<0.05).The importance of snakes and their medical need for snake venom has showed a significant agreement (X2 = 12.045 df=2, P<0.05). Also, the prevention of snake attacks and the area snakes are easily sighted showed a significant association (X2 = 29.205 df=4, P<0.05). In addition, there is a significant link between the snake-bite treatment and its prevention (R2 = 0.312, P<0.05). Moreso, a respondent score of 39.30% is recorded upon the knowledge of venomous snakes. Furthermore, the study recorded a respondent score of 39.30% on the preferable use of traditional treatment on snake-bite victim than the expected medical treatment (31.84%), creating an understanding that the people of Kumba are still very much dependent on the ancient methods of treating snake-bite victims. The Kumba city dwellers need education on the snake behaviour, venomous and non venomous species around their area and the ecological and medical importance of snakes.
Similar to MASTER THESIS, Munoz, Ref 20140536 (18)
The Assessment of Human-Snake Interaction and its Outcome in the City of Kumba
MASTER THESIS, Munoz, Ref 20140536
1. Faculty of Forest Science
Mammal densities in the Kalahari,
Botswana – impact of seasons and land
use
Vilttätheter i Kalahari, Botswana – påverkan av säsong och
markanvändning
Josefine Muñoz
Examensarbete I ämnet biologi
Department of Wildlife, Fish, and Environmental studies
Umeå
2013
2. Mammal densities in the Kalahari, Botswana – impact of seasons
and land use
Vilttätheter I Kalahari, Botswana – påverkan av säsong och markanvändning
Josefine Muñoz
Supervisor: Roger Bergström, Christina Skarpe och Märtha Wallgren
Assistant Supervisor: -
Examiner: Göran Spong, Dept. of Wildlife, Fish, and Environmental Studies
Credits: 30 HEC
Level: D
Course title: Master degree thesis in Biology at the Department of Wildlife, Fish, and
Environmental Studies
Course code: EX0317
Programme/education: Specialutformat program
Place of publication: Umeå
Year of publication: 2013
Cover picture: Josefine Muñoz
Title of series, no: Examensarbete i ämnet biologi
Number of part of series: 2013:19
Online publication: http://stud.epsilon.slu.se
Keywords: Land use, Mammal densities, Red listed species, Mammal communities, Savanna
ecology
Sveriges lantbruksuniversitet
Swedish University of Agricultural Sciences
Faculty of Forest Science
Department of Wildlife, Fish, and Environmental Studies
3. 3
Abstract
In the Kalahari, Botswana, as in many other parts of the world, wildlife is experiencing an
increased pressure from a growing human population and intensified land use with domestic
livestock. The intensified pressure on the vegetation cover induced by livestock limits the
abundance of resources and creates a fragmented landscape for wild animals. The
transformation of the landscape makes it difficult for some wildlife species to co-exist with
human activities. Mammal population densities in the Kalahari vary due to natural causes as
well. When resource availability is lowered, during the dry season, many species migrate to
adjacent and more productive areas, creating temporal variance in regional mammal density.
This project aims at investigating the spatial and temporal variation in density of mammals
and ostrich (Struthio camelus) in Botswana, and to study how this variation relates to human
land use. The results have been compared with previous studies conducted during different
season and in different regions in Botswana. All domestic and wild terrestrial mammals with
a size of tree squirrel (Paraxerus cepapi) or larger, and ostrich were counted along 10
predetermined transects located in four different land use areas; Communal Grazing Areas,
Fenced Ranches, Wildlife Management Areas and National Parks. Large and medium sized
herbivores and carnivores are most affected by human activities and smaller mammals least.
The seasonal and regional differences in the environment did not prove to affect the wildlife
as much as human land use. This study shows that human land use has a great impact on
wildlife and has the potential to determine its distribution. Different types of wildlife respond
differently to environmental changes and my study shows the need to maintain protected
areas for the existence of many species.
Keywords: Land use, Mammal densities, Red listed species, Mammal communities, Savanna
ecology
4. 4
Introduction
The world’s biological diversity is a source of genetic variation, biological relationships and
ecological services, crucial for the development and existence of life on earth. It is also a
resource that human communities, nations and future generations depend upon for survival. It
provides food, medicine, housing and many other commodities. The diversity of organisms
and processes is therefore important to preserve, or alternatively, exploit sustainably
(Secretariat of the Convention of Biological Diversity 2000). However, today biodiversity is
lost at a rate, which threatens human survival. Since the loss of biodiversity is irreversible it is
important that we aim for a co-existence of humans and nature (Earth in focus et al. 2010).
Hence, the United Nations (UN) has declared that “The achievement of sustainable
development requires the integration of its economic, environmental and social components
at all levels” (Division for Sustainable Development 2011). However, it is frequently
observed that human transformation of the environment may lead to enormous negative
impact on for example the success of wildlife conservation (Moleele & Mainah 2003). A
common impact from land management in many countries is overly fragmented landscapes
(Verlinden 1997; Hobbs et al. 2008) and habitat loss, which are one of the main threats to
wildlife today (IUCN 2011).
Human activities may cause various impacts with regards to wildlife, either directly or
indirectly. Direct impact is best exemplified by harvest, either through legal or illegal hunt.
An example is the killing of large predators to protect livestock (Romañach et al. 2007).
Indirect impact includes changes of vegetation cover and composition by livestock grazing,
and competition for resources such as space and water (Wallgren et al. 2009). For example,
90% of the biomass of large herbivores on the African savannas is domestic livestock, leaving
10% for the wild herbivores (du Toit 1995). Due to such anthropogenic changes in the
environment many wild species have declined to critical population levels (IUCN 2011).
However, there are many reasons why some wildlife species are more threatened by human
impact than others. In order to protect and draw attention to these species and the threat to the
biodiversity, the International Union for Conservation of Nature, IUCN, generated the “IUCN
red list of threatened species”. The red list is a global system, which describes and evaluates
the conservation status of most known species on earth today, with the main focus on those
threatened with extinction (IUCN 2011).
If we are to understand how human transformation of the environment influences wild
animals, it is important to first look at how animal species interact and what their traits are
with regards to food and habitat choice etc. (Wallgren et al. 2008). Mammal communities in
general are complex systems and the characteristics (e.g. composition and function) of a
community often change seasonally as the environment changes (Wallgren et al. 2008). In
this respect, the savanna ecosystem is no exception as it includes a large number of interacting
species, a majority of which are herbivores but also including for example omnivores and
predators (e.g. du Toit & Cumming 1999). The abundance of herbivores is mainly determined
by the availability and nutritive quality of vegetation, which is governed by soil nutrient
content, rainfall, fire incidents, as well as grazing or browsing pressure (du Toit 1995; Skarpe
1990). Water accessibility is also important. For the smaller mammal species the access to
5. 5
shelter can also be important (Blaum et al. 2007). The abundance of predators is, in turn,
directly linked to the abundance of prey (often herbivores; du Toit 1995). Consequently the
community structure may change if the balance between the different functional groups is
disturbed. For example, if the predator density increases rapidly when herbivore food is
scarce there may be pronounced effects on herbivore abundance. On the contrary, if herbivore
numbers boom due to lower predation there can be severe negative effects on the vegetation
(Begon et al. 1996).
In the Kalahari, Botswana, as in many other parts of the world, wildlife is experiencing an
increased pressure from a growing human population and intensified land use (Romañach et
al. 2007; Bergström & Skarpe 1999). For one thing, human activities are important factors
controlling seasonal mammal distribution in the Kalahari (Wallgren et al. 2009). On a larger
and regional scale, migration of mammals is affected by veterinary cordon fences and other
fences that divide the country in different regions. The fences have been constructed in order
to control the foot- and mouth disease carried by the wild buffalo (Syncerus caffer). The
veterinary cordon fences restrict wildlife migrations, and with increasing occurrences of
droughts in southern Kalahari, this has caused large declines in many herbivore species
(Spinage 1992; Pearce 1993). Hence, it is important to seek solutions and develop
conservation plans for each region to ensure future existence of the wildlife (Crowe 1994).
The small-scale movements among herbivores in Botswana are also restricted by local cattle
fences that have created patches where the wildlife can exist (Fjeldså et al. 2004; Perkins
2004). This applies primly to the northern and eastern parts of the country, whereas the
southwestern part is less affected by human activities. Moreover, the cattle farming also
transforms the vegetation towards increased dominance of woody vegetation as opposed to
herbaceous vegetation, a phenomenon called bush encroachment. These changes in the
vegetation cover can be detected in the southern Kalahari many decades after livestock
grazing has ceased in an area (Skarpe 1986). Since the system is poorly investigated it is
difficult to determine what impact such changes have on wildlife (Verlinden 1997).
In order to conserve wildlife and separate livestock production from wild animals, state lands
in Botswana have been divided into different land use zones, protected areas and unprotected
areas. The National Parks and the Wildlife Management Areas were formed to give wild
animals protection. The National Parks give wildlife full protection, i.e. hunting is prohibited,
whereas Wildlife Management Areas provide living space, i.e. most livestock is prohibited,
although limited hunting is allowed (Twyman 2001; Central Statistics Office, 2005). The
Communal Grazing Areas and Fenced Ranches are land use areas without any type of wildlife
protection from human land use activities. These areas were created to enhance livestock
production in Botswana and are often grazed all year round. The intense year round grazing
has caused changes in the environment which has had a significant effect on the savanna
ecosystem (Bergström et al. 1999). This is especially true in the Fenced Ranches, which are
relatively small (often about 8 km x 8 km) enclosed areas for livestock (Wallgren et al. 2009).
In Communal Grazing Areas, livestock can move freely close to the villages, within about
20km (Moleele & Mainah 2003; Verlinden 1997).
6. 6
The transformation of the land cover in the unprotected areas makes it difficult for some
wildlife species to co-exist with human activities (Moleele & Mainah 2003). For example,
studies have shown that large wild herbivores are uncommon in areas where there are humans
and livestock in permanently large numbers (Wallgren et al. 2008). It is suggested that the
domestic herbivores outcompete some wild herbivores for resources. The intensified pressure
on the vegetation cover induced by livestock limits the abundance of resources for wild
herbivores (du Toit & Cumming 1999) and creates a fragmented landscape (Fjedså et al.
2004). Hunting may also be a reason why not only large wild herbivores (Wallgren et al.
2008), but also large carnivores are uncommon in areas with human activities (Romañach et
al. 2007). Large carnivores are particularly difficult to conserve in areas where humans have
settled, since these species conflict directly with human interest and may be killed by humans
(Woodroffe 2000). Large carnivores have higher prey densities (livestock) in domesticated
areas, but studies have shown that the carnivore densities tend to go down in areas where
human densities are high (Woodroffe 2000).
There are also other causes of variation in mammal population densities in Kalahari. For
example, when resource availability is lowered, during the dry season, many herbivores
migrate to adjacent and more productive areas, creating temporal variance in regional
mammal density (Andrews & O’Brien 2000; Smithers 2000). In southern Kalahari, which is
the driest region in Botswana (Department of Meteorological Services Botswana, 2003), these
density fluctuations are more pronounced compared to the situation in the wetter northern part
of the country, where droughts are less common (Andrews & O’Brien 2000). Particularly
water dependent herbivore species are largely restricted to the north (Scholes et al. 2002),
since the fluctuations in water availability and temperature are more pronounced in the drier
south (Andrews & O’Brien 2000). These variations create environmental gradients for the
wildlife (Olff et al. 2002) and suggest a greater range of resource access in the northern
Kalahari region, this is followed by a higher species diversity in the north than in the drier
south (Andrews & O’Brien 2000). For example in open savanna landscapes there are plenty
of resources for different species and the total animal density is high. This may explain the
distribution of mammals with different functional traits, since the resource requirements vary
for each species (Olff et al. 2002). Mammals with different functional traits are expected to
respond differently to the environmental gradients (Andrews & O’Brien 2000). This is
important to take into account when making conservation plans and, further, it is a way to
analyse the anthropogenic effect in a region.
Objectives
This project aims at investigating the spatial and temporal variation in density of mammals
and ostrich in Botswana, and to study how this variation relates to human land use. My first
two questions relates to northern Botswana only, since the corresponding questions for
southern Botswana have been published elsewhere (Jakobsson 2006). The third question deals
with a comparison between two seasons and two regions. My questions were:
7. 7
1. a) Do population densities of different mammal species and ostrich differ
between areas with different types of land use?
b) Are there differences between seasons of population densities of different
mammal species and ostrich in areas with different types of land use?
2. Do red listed species show other population density patterns in relation to land
use compared to more common species?
3. Does composition of mammal communities, with regards to functional traits,
differ between types of land use depending on season and region?
I predict that there will be a negative impact on wild mammal and ostrich densities from
livestock-related activities. I therefore hypothesize that the density of wild mammals is higher
in protected than non-protected areas (hypothesis 1). It is believed that human-related
activities have strongest negative impact on the red listed species. Hence, I hypothesize that
these species will be more sensitive to differences in land use than common species
(hypothesis 2). It is also believed that mammal densities are higher in northern compared to
southern Kalahari, independent of season. I hypothesize that during periods when and in
regions where vegetation productivity is high, effects from competition induced by livestock
are smaller compared to periods when and regions where productivity is low (hypothesis 3).
Study area
Kalahari ecology
The Kalahari is a semi-arid savanna in Southern Africa, with diverse vegetation and irregular
distribution of water resources (Bergström & Skarpe 1999). Geologically it is a ca 2.5 million
ha basin covered with sand (Thomas & Shaw 1993, Scholes et al. 2002; Thomas et al. 2002)
at an altitude of about 1000 m above sea level (Skarpe 1990). The wet season lasts from
October/November to April (Scholes et al. 2002) with daily mean temperatures ranging
between 20 – 35°C in Maun in the north and 12 – 34°C in Tshabong in the south (Botswana
environment statistics 2008). The precipitation ranges from 250 mm/year in the south to 600
mm/year in the north (Department of Meteorological Services Botswana, 2003). Dry season
temperatures vary between 8 – 33°C in Maun and 0.7 – 20°C in Tshabong (Botswana
environments statistics 2008). During the dry season, occasional rainfall has been recorded
and night frost is common (Scholes et al. 2002). The seasonal differences in temperature are
greatest in the southern Kalahari where also fires are more frequent (Scholes et al. 2002).
The Kalahari soils are generally nutrient poor (Skarpe 1990) and permanent surface water is
scarce (Verlinden et al. 1998). The vegetation is dominated by shrubs in the southern drier
part and woodlands dominate in the northern wetter part.
The study areas
In order to investigate the variation of mammal and ostrich densities in the Kalahari,
Botswana, the study was made in areas with four different types of land use: National Parks
(NP), Wildlife Management Areas (WMA), Communal Grazing Areas (CGA) and Fenced
8. 8
Ranches (FR). In the 1970s the government of Botswana changed the policy of land use, and
the three latter land use types were formed (WMA, CGA and FR) (Moleele & Mainah 2003;
Verlinden 1997). In the CGA, FR and to some extent the WMA boreholes have been
established (in areas where there were not yet established) to make water available for year-
round grazing livestock (Perkins1996). This was done mainly in the CGA and the FR which
often lie beside each another. In CGA there are normally some sedentary human settlements,
with free-ranging livestock within a range of about 30 km from the villages. The FR are
formed in square blocks that are 16 km2
or larger, with land usually leased from the
government (Moleele & Mainah 2003; Verlinden 1997). These two types of area are without
any form of wildlife protection, except the general legislation. In the WMA human
settlements with agriculture are allowed, but restricted and regulated hunting is allowed
during certain periods of the year. The WMAs are to some extent placed adjacent to the NPs
and function in that case as buffer zones, or corridors for moving animals (Twyman 2001;
Central Statistics Office, 2005). The NP was formed in the 1960s to create an area void of
human disturbance (Twyman 2001).
The present study was based in Maun in Botswana (19°59'S, 23°25'E). Mammals were
counted along road transects in areas with the four types of land use described above.
Transects in the CGA were located around Nxaraga village and Shorobe village. Several
ranches between Maun and Makalamabedi represented FR. The WMA studied here are
managed by a trust called Sankuyo Tshwaragano Management Trustland and called NG33
and NG34 (in which the village Sankuyo lies). The WMA is adjacent to Moremi game reserve
and close to Shorobe village. The investigation was also conducted in Savuti within the
Chobe National Park (18˚34’S, 24˚03’E). Our study areas include all four of the different
types of land use (see Fig. 1).
Studies conducted in the southern Botswana were situated around the Matsheng villages
(24˚04’S, 21˚40’E) in the northern part of the Kgalagadi district and Kgalagadi Transfrontier
Park (e.g. Viio 2003; Jakobsson 2006). CGA and FR were found in the vicinity of the
Matsheng villages, including Hukuntsi, Lokgwabe, Lehututu and Tshane, as well as close to
Ncojane. The rest of the southern study area was WMA and NP, the latter in the far south-
west, the driest region in Botswana (Chanda et al. 2003). For a more detailed description of
the areas see Wallgren (2001), Viio (2003), Carlsson (2005) and Jakobsson (2006).
9. 9
Figure 1. Map of Botswana, with land use types shown. The study areas are marked with black squares. The
study was performed within the northern square. Source: Märtha Wallgren 2013.
Method
As a part of the SIDA-financed PhD-project “Mammal community structure in a world of
gradients, effects of resource availability and disturbance across scales and biomes” (Märtha
Wallgren at the Swedish University of Agricultural Sciences) the present study was conducted
as a SIDA-financed research project (SWE-2006-136). Two of the previous studies of animal
densities were conducted in the southern Kalahari during the dry and the wet season in 2002
and 2004 (Jakobsson 2006; Viio 2003). The third study was conducted in the northern
Kalahari during the dry season in 2007, and performed in the same study area as the present
investigation (Persson (in prep.)). The present study is the fourth part and the final survey of
animal densities in Kalahari in this project.
10. 10
Field method
My study was performed in the northern part of Botswana from the end of January until the
beginning of April 2008, i.e. during the second half of the wet season (Fig. 1). Domestic and
wild terrestrial mammals with a size of tree squirrel (Paraxerus cepapi) or larger, and ostrich
were counted along 10 predetermined transects (Table 1) located in the four different land use
areas - CGA, FR, WMA and a NP (see above for definitions). Transects were monitored by
three persons using a Toyota Hilux 4x4. The vehicle was driven at an average speed of
approximately 25 km/h to make sure that most animals were spotted. One person was driving
and also spotting animals on the road. The other two stood at the back of the vehicle
observing each side in an angle of 90° from the side to the front of the car. The observers
rotated place (e.g. from driving the vehicle to standing on the back of the vehicle on the right
side), each time a transect was driven. Observations were recorded using Distance method
(Buckland et al. 1993). When an animal or a group of animals were detected the vehicle was
stopped. At every observation, distance and direction to the animal observed were measured
with a rangefinder and the group size was recorded. With these values, perpendicular distance
from the driven line to each observation could be calculated. If an animal was observed
further away than an estimated 30 m from another animal of the same species they were noted
as separate observations. The direction of the road was also recorded at each observation.
Species identification followed Smithers (2000).
To compare seasonal differences, most of the transects were the same as those used in
previous studies by Persson (in prep.) in the dry season 2007. Heavy rainfall and biotic effects
(such as high grass, fallen trees) had made many tracks and transects impossible to use.
Therefore a number of the transects from 2007 had to be replaced with new transects of
similar type. The transects, which remained unchanged from 2007 were mainly transects in
the CGA. The other transects were placed as near as possible to those used in 2007. Transects
followed tracks and small roads to prevent possible disturbance from traffic. Further, driving
on tracks instead of off road made both day and night drives easier and quicker. The length of
the transects varied from 7.0 km in the FR to 48.2 km in the NP (Table 1). All transects were
driven several times. Short transects were repeated so that a comparable number of km were
driven in each transect. It was assumed that the rainfalls were more frequent during the
beginning of the field period than at the end. Since water availability and vegetation cover
changed with the frequencies of rainfall, the replicates of each transect were divided as
equally as possible during this period.
The sampling was made both during day (08 – 17h) and night (20 – 05h), making it possible
to group animals observed during the day from those observed during the night. Spotlights
were used to scan the area at night. The night observations and the day observations were not
combined in the statistical analyses, since the detection function (Buckland et al. 2000)
differs.
11. 11
Distance sampling and analyses
Statistical analyses were performed using a program (DISTANCE 5.0) for handling data from
the distance sampling method. This method is commonly used to estimate population
densities (Fewster et al. 2009), i.e. the number of individuals per unit area (Buckland et al
1993). In this case the unit area was km2
. We observed mammals and ostriches by using line
transect, and therefore I will focus on that technique.
When practising distance sampling, the observer moves along a line transect, observing both
sides of the line. When making an observation, the perpendicular distance between the animal
and the line transect is measured. However, since it is more difficult for the observer to spot
an animal far away than one close by, the probability of making an observation will differ
with the perpendicular distances from the road. This is taken into account in the statistical
calculations when using distance analysis technique. The method assumes that all animals on
the line transect is observed (Sutherland 2006), while the chance of failing to observe animals
increases with the distance away from the line. The function that determines the probability of
detecting an animal at different distances from the line transect, is called the detection
function (Buckland et al. 2000) and is a central component in analysing distance sampling
data (Thomas et al. 2002).
Using the perpendicular distance the detection function can be calculated by estimating the
number of missed observations (Buckland et al. 2000). This is possible only if you assume
that the density of an observed animal is constant in an area, i.e. the observations made on the
transect line reflect the average number of observations. By repeating the sampling at the line
transect, different observations will be made at different distances. The method then uses the
variation from these observations to estimate the detection function and hence the density of
the observed animals in an area (Thomas et al. 2002; Sutherland 2006). At least 60
observations of each species are recommended to make the density estimate reasonably
accurate and the more observations the more precise estimates (Buckland et al.1993).
However, we have chosen to estimate densities of species with at least 30 observations in total
for all types of land use areas, so that results will be available for a large number of species.
The small number of observations will be taken into consideration when discussing the
results. To minimize statistical bias it is important that transects are representative of the area
as a whole, e.g. far away from main roads or other infrastructure, since many animals tend to
avoid artificial sound, light and people (Sutherland 2006).
To compare species occurrences and densities between the four different types of land use
(CGA, FR, WMA, and NP) data were statistically analysed. Statistically significant
differences between the land use types were determined with 95% confidence intervals in
DISTANCE 5.0. Diurnal and nocturnal observations were separated since the detection
functions may be different depending on the time of day.
The seasonal and regional differences were analysed using additional data published in
previous studies by Viio (2003), Jakobsson (2006) and Persson (in prep.) (Table 1). In these
studies the same sampling method was used as described above. This made it possible to look
12. 12
at differences in densities (using 95% confidence intervals) between both seasons and land
use types.
The species, which were tested with DISTANCE 5.0 in northern and southern Botswana,
were divided into different groups according to their functional trait. The traits that I am
focusing on in this report are food preference, body mass and domesticated or wild animals,
e.g. wild small herbivores (Appendix 2). Species with similar functional traits have formed
functional groups by summing the densities in each type of land use in each region and
season. The density of each functional group in every type of land use, season and region, has
been compared to other functional groups in the same type of land use, season and region.
From this the proportion of each functional group has been established in comparison to other
functional groups.
Table 1. Kilometres driven per land use type for each season (2002, 2004, 2007 and 2008) and region
(Northern and Southern Botswana) and the corresponding number of observations (No. obs.), as well as
the total distance driven and number of observations per land use type.
Southern Botswana
Dry season 2002 Wet season 2004
Land use type Km No. of obs. Km No. of obs. Total km Total obs.
CGA 1,015 777 1,165 638 2,180 1,415
FR 397 472 1,093 1,155 1,490 1,627
WMA 1,463 607 1,528 568 2,991 1,175
NP 761 336 1,490 536 2,251 872
Sum 3,636 2,192 5,276 2,897 8,912 5,089
Northern Botswana
Dry season 2007 Wet season 2008
Land use type Km. No. of obs. Km No. of obs. Total km Total obs.
CGA 770 491 732 600 1,501.9 1,091
FR 796 458 671 1034 1,466.5 1,492
WMA 814 621 796 467 1,609.6 1,088
NP 794 980 761 983 1,554.5 1,963
Sum 3,174 2,550 2,960 3,084 6,134 5,634
13. 13
Results
In my study, observations were made along 135 transects encompassing over 2,959 km of
driving (Table 1). Totally I obtained 3,084 observations including 22,844 animals of 44
species in the four different types of land use (Table 2). Approximately 82% of the number of
wild mammals and ostriches were observed in protected areas (WMA and NP).
Table 2. Species observed and number of observations per species in each type of land use. Species marked with *
were analysed with DISTANCE 5.0. Names according to Smithers 2000.
Species Scientific name Abbr. CGA FR WMA NP
Wild species
African elephant* Loxodonta africana ELE 2 0 17 195
African wildcat* Felis lybica AWC 3 1 16 11
Banded mongoose Mungos mungo BMG 0 0 0 1
Bat-eared fox Otocyon megalotis BFX 1 0 0 4
Black-backed jackal Canis mesomelas BBJ 3 13 0 2
Blue wildebeest* Connochaetes taurinus WIL 0 0 0 65
Cape fox Vulpes chama CFX 0 0 1 1
Cape/Scrub hare* Lepus capensis/saxatilis HAR 13 11 4 26
Common duiker Sylvicapra grimmia CDU 3 1 2 2
Dwarf mongoose Helogale parvula DMG 0 0 1 0
Giraffe* Giraffa camelopardalis GIR 0 0 29 64
Greater kudu Tragelaphus strepsiceros KUD 0 5 9 8
Ground squirrel Xerus inauris GSQ 0 3 0 0
Hippopotamus Hippopotamus amphibius HIP 1 0 0 0
Honey badger Mellivora capensis HBG 1 0 0 0
Impala* Aepyceros melampus IMP 0 0 251 307
Large spotted genet Genetta tigrina LSG 1 1 10 7
Leopard Panthera pardus LEO 0 0 1 2
Lesser bushbaby* Galago moholi BUB 34 5 21 19
Lion Panthera leo LIO 0 0 1 2
Ostrich Struthio camelus OST 3 4 0 16
Porcupine Hystrix africaeaustralis POR 2 2 2 0
Roan Hippotragus equinus ROA 0 0 0 1
Sable Hippotragus niger SAB 0 0 0 1
Side-striped jackal Canis adustus SSJ 1 0 0 0
Slender mongoose Galerella ssp. SMG 0 1 3 1
Small spotted genet Genetta genetta SGN 3 3 4 4
Spotted hyena Crocuta crocuta SHY 0 0 1 7
Springhare* Pedetes capensis SPH 20 24 42 131
Steenbok* Raphicerus campestris STE 5 10 26 12
Striped polecat Ictonyx striatus SPC 1 1 0 0
Tree squirrel Paraxerus cepapi TSQ 2 17 7 0
Tsessebe (Topi) Damaliscus lunatus TSE 0 0 2 5
Warthog Phacochoerus aethiopicus WAR 0 0 3 21
Wild dog Lycaon pictus WDG 0 0 0 1
Yellow mongoose Cynictis penicillata YMG 2 1 0 0
14. 14
Zebra* Equus burchelli ZEB 0 0 14 67
Total wild 101 103 467 983
Domestic species
Cattle* Bos taurus CAT 273 571 0 0
Domestic cat Felis catus DOC 2 0 0 0
Domestic dog* Canis familiaris DOG 33 46 0 0
Donkey* Equus asinus DON 100 180 0 0
Goat* Capra hircus GOA 67 74 0 0
Horse* Equus caballus HOR 21 56 0 0
Sheep Ovis aries SHE 3 4 0 0
Total domestic 499 931 0 0
Mammal densities depending on land use type in northern Botswana
The wild mammal densities differed greatly between land use types and mainly between the
NP and the other areas (Table 3). The highest densities were encountered in the NP and the
lowest in the FR.
Large herbivores were almost exclusively observed in the protected areas, and zebra (Equus
burchelli) had a significantly higher density in the NP than in WMA. The same result was
noted for springhare (Pedetes capensis) and african elephant (Loxodonta africana) (Table 3).
Wild mammals encountered in the unprotected areas were african wildcat (Felis lybica),
lesser bushbaby (Galago moholi), cape/scrub hare, springhare and steenbok (Raphicerus
campestris). All were observed during the night. A significant difference was determined for
african wildcat density between CGA and NP (Table 3), and NP had the highest density.
The highest densities found in this study were of domestic animals, mainly cattle in the FR.
Domestic mammals were found only in the unprotected areas in the northern Botswana (Table
3).
Seasonal differences in northern Botswana
Data from northern Botswana could be compared by using my data and data from Persson (in
prep.). There was an indication of higher densities of wild animals during the wet season
compared with dry season in all four types of land use in northern Botswana (Table 3). At the
species level this difference between seasons was significant in NP for impala and hare.
Further, elephant also showed a significantly higher density in the WMA in the wet season, a
result, which confirmed the hypothesis: when vegetation productivity is high, mammal
densities are higher compared to periods when productivity is low.
However, contrary to the prediction, zebra and springhare showed higher densities during the
dry season in the WMA. For springhare a significantly higher density in the NP during the dry
season was also determined (Table 3).
Analyses of domestic animal densities did not significantly prove a difference between
seasons, however all domestic animals were only observed in the unprotected areas (Table 3).
15. 15
Table 3. Species densities over seasons in northern Botswana. LD = Low density (less than 0.01 animal
species/km2
; U CL = upper confidential limits; L CL = lower confidential limits (Data from the dry
season has been analyzed by Persson in prep.)
Wet season Dry season
Wild animals CGA FR WMA NP CGA FR WMA NP
U CL 0.4 2.1 8.9 0.8 0.2 0.2 0.8 1.2
AWC D 0.2 0.1 1.1 0.6 LD 0.1 0.4 0.7
L CL 0.1 LD 0.1 0.5 LD LD 0.2 0.4
U CL 0.5 3.7 0.1 0.0 0.0 0.4 0.3 0.9
BBJ D 0.2 0.7 0.1 0.0 0.0 0.1 0.1 0.4
L CL 0.1 0.1 0.1 0.0 0.0 LD LD 0.2
U CL 0.0 0.0 0.0 0.0 0.2 0.4 0.5 1.0
BFX D 0.0 0.0 0.0 0.0 0.1 0.1 0.1 0.5
L CL 0.0 0.0 0.0 0.0 0.0 LD LD 0.2
U CL 3.2 4.1 3.0 0.5 1.6 0.2 2.6 1.9
BUB D 0.9 0.2 0.7 0.4 0.8 LD 1.5 0.4
L CL 0.3 LD 0.1 0.3 0.4 LD 0.9 0.1
U CL 0.0 0.0 0.0 0.0 0.1 0.0 0.2 0.0
CFX D 0.0 0.0 0.0 0.0 LD 0.0 LD 0.0
L CL 0.0 0.0 0.0 0.0 LD 0.0 LD 0.0
U CL 0.0 0.0 0.0 0.0 0.6 0.6 0.2 0.2
CDU D 0.0 0.0 0.0 0.0 0.3 0.3 0.1 LD
L CL 0.0 0.0 0.0 0.0 0.2 0.1 LD LD
U CL 0.0 0.0 1.1 2.7 0.1 0.0 0.1 2.5
ELE D 0.0 0.0 0.3 1.8 LD 0.0 LD 1.6
L CL 0.0 0.0 0.1 1.2 LD 0.0 LD 1.0
U CL 0.0 0.0 1.0 1.3 0.0 0.0 2.2 2.5
GIR D 0.0 0.0 0.5 0.8 0.0 0.0 0.9 1.4
L CL 0.0 0.0 0.3 0.5 0.0 0.0 0.4 0.8
U CL 0.0 0.0 0.0 0.0 0.0 1.2 0.0 0.0
GSQ D 0.0 0.0 0.0 0.0 0.0 0.1 0.0 0.0
L CL 0.0 0.0 0.0 0.0 0.0 LD 0.0 0.0
U CL 19.2 56.3 37.9 31.8 8.1 4.0 6.5 9.3
HAR D 9.2 6.4 3.0 18.6 5.3 0.5 3.5 5.2
L CL 4.4 0.7 0.2 10.9 3.5 0.1 1.9 2.9
U CL 0.0 0.0 22.0 33.7 0.0 0.0 12.7 17.6
IMP D 0.0 0.0 11.5 25.2 0.0 0.0 6.3 10.7
L CL 0.0 0.0 6.0 18.8 0.0 0.0 3.2 6.6
U CL 0.0 0.0 2.6 0.7 0.0 0.3 0.9 2.4
KUD D 0.0 0.0 0.3 0.4 0.0 0.1 0.2 1.1
L CL 0.0 0.0 LD 0.2 0.0 LD 0.1 0.5
U CL 0.0 0.0 0.0 0.0 0.5 0.2 1.2 0.7
LGN D 0.0 0.0 0.0 0.0 0.2 LD 0.6 0.3
L CL 0.0 0.0 0.0 0.0 0.1 LD 0.3 0.1
U CL 0.4 0.6 0.0 0.9 0.3 0.7 0.1 0.9
OST D LD LD 0.0 0.5 0.1 0.3 LD 0.3
L CL LD LD 0.0 0.3 LD 0.1 LD 0.1
U CL 0.0 0.0 0.0 0.0 0.6 0.6 1.1 0.3
SGN D 0.0 0.0 0.0 0.0 0.2 0.3 0.7 0.1
16. 16
L CL 0.0 0.0 0.0 0.0 0.1 0.1 0.4 LD
U CL 0.0 0.0 0.0 0.0 0.6 1.3 0.7 1.9
SMG D 0.0 0.0 0.0 0.0 0.2 0.4 0.2 0.5
L CL 0.0 0.0 0.0 0.0 LD 0.1 0.1 0.2
U CL 3.4 3.3 1.3 4.4 1,0 1.4 7.7 33.8
SPH D 0.5 0.7 1.0 3.5 0.6 0.2 5.0 23.7
L CL 0.1 0.1 0.8 2.8 0.3 0.0 3.3 16.6
U CL 1.4 5.1 1.4 0.8 0.4 2.6 1.1 1.7
STE D 0.2 0.5 0.9 0.6 0.2 1.7 0.8 1,0
L CL LD 0.1 0.6 0.4 0.1 1.1 0.6 0.6
U CL 38.6 0.0 43.4 30.8 8.4 0.0 7.1 6.9
TSQ D 5.9 0.0 13.2 18.6 3.7 0.0 4.4 2.6
L CL 0.9 0.0 4,0 11.3 1.6 0.0 2.7 1,0
U CL 0.0 0.0 1.2 3.4 0.0 0.1 0.7 1.4
WAR D 0.0 0.0 0.1 1.8 0.0 LD 0.3 0.6
L CL 0.0 0.0 LD 1,0 0.0 LD 0.1 0.3
U CL 0.0 0.0 0.0 3.1 0.0 0.0 0.0 1.3
WIL D 0.0 0.0 0.0 1.9 0.0 0.0 0.0 0.7
L CL 0.0 0.0 0.0 1.1 0.0 0.0 0.0 0.3
U CL 0.0 0.0 0.0 0.0 0.6 0.7 0.7 1.8
YMG D 0.0 0.0 0.0 0.0 0.1 0.2 0.1 0.8
L CL 0.0 0.0 0.0 0.0 LD 0.1 LD 0.3
U CL 0.0 0.0 1.8 25.6 0.0 0.0 13.8 0.0
ZEB D 0.0 0.0 0.4 11.0 0.0 0.0 6.8 0.0
L CL 0.0 0.0 0.1 4.8 0.0 0.0 3.3 0.0
Wet season Dry season
Domestic
mammals
CGA FR WMA NP CGA FR WMA NP
U CL 7.2 35.2 0.0 0.0 10.7 7.0 0.0 0.0
CAT D 29.1 74.5 0.0 0.0 19.6 18.1 0.0 0.0
L CL 118.1 157.6 0.0 0.0 36.0 47.0 0.0 0.0
U CL 0.5 0.2 0.0 0.0 0.7 0.0 0.0 0.0
DOG D 0.9 1.4 0.0 0.0 1.6 0.1 0.0 0.0
L CL 1.7 8.5 0.0 0.0 3.8 0.4 0.0 0.0
U CL 0.8 2.6 0.0 0.0 0.8 0.3 0.0 0.0
DON D 2.7 8.5 0.0 0.0 1.4 1.4 0.0 0.0
L CL 9.3 27.4 0.0 0.0 2.7 6.6 0.0 0.0
17. 17
U CL 1.9 5.2 0.0 0.0 4.3 1.0 0.0 0.0
GOA D 7.1 17.7 0.0 0.0 8.3 6.2 0.0 0.0
L CL 25.9 60.6 0.0 0.0 16.2 38.1 0.0 0.0
U CL 0.1 0.4 0.0 0.0 0.0 0.1 0.0 0.0
HOR D 0.4 1.6 0.0 0.0 0.1 0.3 0.0 0.0
L CL 1.9 5.4 0.0 0.0 0.4 1.0 0.0 0.0
U CL 0.0 0.0 0.0 0.0 0.0 0.0 0.0 0.0
SHE D 0.0 0.0 0.0 0.0 0.0 0.1 0.0 0.0
L CL 0.0 0.0 0.0 0.0 0.1 0.5 0.0 0.0
Red listed species
The data for the red listed species in northern Botswana wet season were compared with data
from Persson (in prep.). There were three predators and two large herbivores (see Table 4).
Lion (Panthera leo), leopard (Panthera pardus) and wild dog (Lycaon pictus) were recorded
only a few times and hippopotamus (Hippopotamus amphibius) once during wet season. As
hypothesized, most of the observations of the red listed species were made in the WMA and
the NP, where the red listed carnivores were exclusively observed independent of season. At
three occasions red listed species were observed in CGA but never in the FR (Table 4.).
Table 4. Recorded red listed species in northern Botswana, with the number of observations in each
land use type over seasons. The total number of observations of each species is also shown.
Wet season Dry season
Species Latin name CGA FR WMA NP CGA FR WMA NP Sum
African
elephant
Loxodonta
africana
2 0 17 195 0 0 1 181 396
Hippopotamus
Hippopotamus
amphibius
1 0 0 0 0 0 0 0 1
Leopard
Panthera
pardus
0 0 1 2 0 0 1 4 8
Lion Panthera leo 0 0 1 2 0 0 2 2 7
Wild dog Lycaon pictus 0 0 0 1 0 0 0 1 2
Northern Kalahari in comparison to southern Kalahari
The total dataset from northern and southern Botswana during four study periods includes
5,656 observations of wild animals and 4,844 observations of domestic animals. A total of
82,505 mammals and ostriches were encountered. Many species observed in the north have
not been observed in the south and the other way around. However, the composition of
animals with different functional traits of the whole community was relatively similar in both
regions (Appendix 2). Overall, 82% of the wild animals were observed in protected areas.
Regional differences in densities of wild animals indicated higher densities in northern
18. 18
compared to southern Kalahari (current results compared with Jakobsson 2006) (Appendices
1 and 2).
The highest proportions of all herbivore densities were encountered in the unprotected areas
independent of season and region. The domestic herbivores dominated, mostly in the FR, with
the exception of southern Botswana dry season, where the highest proportions were recorded
for CGA. In southern Botswana, domestic herbivores were also encountered in the WMA,
although they constituted a small proportion of the total animal density of this functional
group (Fig. 2 and 3).
The wild small herbivores varied across all of the different land use types. In southern
Botswana the highest proportions where found in the protected areas with the peak in the NP,
independent of season. In the north the proportion of the densities varied less between the
seasons. During the wet season the WMA had higher proportion of the density than the NP, in
contrary to the dry season in northern Botswana (Fig. 2 and 3).
The large wild herbivores compromised their highest proportion of the densities in the
protected areas independent of season and region. In southern Botswana they were found in
both unprotected and protected land use areas with the highest proportion of the densities in
the NP. In the wet season a low proportion could be seen in the CGA and during the dry
season in the FR. In the northern region during the wet season the NP had the highest
proportions, but this functional group was also found in the WMA. In northern Botswana dry
season large wild herbivores were encountered in all four types of land use, the highest
estimated density proportions were found in the WMA followed by the NP. The CGA and the
FR had very low proportions of the densities (Fig. 2 and 3).
The proportions of wild carnivore densities were highest in the protected areas independent of
season and region, but encountered in both unprotected and protected areas. In northern
Botswana wet season the estimated proportions density of the wild carnivore were found in all
four types of land use with the peak in the WMA. During the dry season in northern Botswana
this functional group were encountered in the FR, WMA and the NP, with the highest
proportion in the protected areas. In southern Kalahari, during the wet season the proportion
of the wild carnivores densities were only encountered in the protected areas (the highest
proportion of the densities in the NP). During the dry season in southern Botswana wild
carnivores were found in the unprotected areas as well, but with very low proportions of
densities (Fig. 2 and 3).
19. 19
Figure 3. The proportions of wild carnivore, wild small herbivore, wild herbivore and domestic herbivore
densities in relation to land use types in Southern Botswana. W Carnivores = Wild Carnivores, W = Wild
Herbivores, D = Domestic Herbivores, WS = Wild Small Herbivores
Figure 2. The proportions of wild carnivore, wild small herbivore, wild herbivore and domestic herbivore
densities in relation to land use types in Northern Botswana. W Carnivores = Wild Carnivores, W = Wild
Herbivores, D = Domestic Herbivores, WS = Wild Small Herbivores
Omnivore densities show a similar pattern over seasons and regions. This functional group
were observed in all four types of land use and during the dry season, independent of region,
the highest proportion of the densities was found in the protected areas. Domestic carnivores
had the highest proportion in the unprotected areas independent of season and region.
0,0
0,1
0,2
0,3
0,4
0,5
0,6
0,7
0,8
0,9
1,0
CGA FR WMA NP CGA FR WMA NP
Wet season Dry season
Northern Botswana
W HERBIVORES
D HERBIVORES
WS HERBIVORES
W CARNIVORES
0,0
0,1
0,2
0,3
0,4
0,5
0,6
0,7
0,8
0,9
1,0
CGA FR WMA NP CGA FR WMA NP
Wet season Dry season
Southern Botswana
W HERBIVORES
D HERBIVORES
WS HERBIVORES
W CARNIVORES
20. 20
Figure 5. The proportions of domestic carnivores, insectivores and omnivore densities in relation to land
use types in Southern Botswana. D carnivores = Domestic carnivores
Figure 4. The proportions of domestic carnivores, insectivores and omnivore densities relation to land
use types in Northern Botswana. D carnivores = Domestic carnivores
However, in northern Botswana dry season domestic carnivores had the highest proportion of
the density in the CGA (Fig. 4 and 5).
The insectivores were only analysed with DISTANCE 5.0 in northern Botswana The highest
proportion of the functional group was in the FR during the dry season (Fig. 4 and 5).
0,0
0,1
0,2
0,3
0,4
0,5
0,6
0,7
0,8
0,9
1,0
CGA FR WMA NP CGA FR WMA NP
Wet season Dry season
Northern Botswana
OMNIVORES
INSECTIVORES
D CARNIVORES
0,0
0,1
0,2
0,3
0,4
0,5
0,6
0,7
0,8
0,9
1,0
CGA FR WMA NP CGA FR WMA NP
Wet season Dry season
Southern Botswana
OMNIVORES
INSECTIVORES
D CARNIVORES
21. 21
Discussion
Impact of land use types on mammal densities, northern Kalahari
This study suggests that human related activities have a negative influence on wildlife in the
Kalahari. Similar results were shown by previous studies (e.g. Moleele & Mainah 2003;
Wallgren et al. 2009; Bergström & Skarpe 1999). The majority of the wild animal species had
low densities or were not encountered at all in the unprotected areas, while the highest
densities were encountered in the protected areas, specifically in the NP. This result is also
emphasized by the fact that the highest densities found in this study were of domestic animals,
mainly cattle, in the FR. Since the domestic animals are held in high densities in relatively
small areas, hardly without any large movement pattern (Moleele & Mainah 2003; Verlinden
1997), the transformation of the landscape and competition for resources may cause an
avoidance among many wild animals, as it reduces their fitness (Hobbs et al. 2008). Elephant
and zebra confirmed the preference of protected areas over unprotected and no wild animal
showed a preference for the unprotected areas. Hence the first hypothesis can be confirmed.
In northern Kalahari the wet season densities were higher than the dry season densities for
most wild and domestic animals. The suggested more abundant vegetation during the wet
season (Andrews & O’Brien 2000) and a subsequent better food situation will benefit the
animals. An assumption could be that the higher animal densities observed during the wet
season probably came from the same population. The population may have increased in
number (giving birth e. g. impala) due to the higher resource availability during the wet
season (Smithers 2000). Also, wild migratory animals tend to move away from areas with
permanent water and better food quality, during the wet season (Bergström & Skarpe 1999).
However, most of the wildlife was still found in the protected areas which suggest that the
higher resource availability during the wet season in unprotected areas is of less significance.
Human land use activities are more important than seasonal variations for the distribution of
wildlife.
It is difficult to understand underlying factors to these types of differences. The seasonal
variations of animal densities were mainly observed in the protected areas. It is easier for
animals to move in the protected areas where there are no fences or other boundaries (roads,
villages etc.; Fjeldså et al. 2004). However, since small-scale movements in unprotected areas
are limited in Botswana (Perkins 1996) it may be an explanation for why the differences in
seasonal variations were restricted to the protected areas. My results show that wild animals
have a preference for the protected areas. The result indicates that human activities are a
determining factor for the wildlife. As hypothesized, there is still a preference for the
protected areas among the wild animals independent of season, which still confirms the first
hypothesis.
22. 22
Anthropogenic influence on red listed species
Most of the observations of red listed species were made in the protected areas independent of
season, a result which confirms hypothesis number 2. Since these species already are more
sensitive to human impact (direct/indirect conflict with human interest, resource competition
etc.) than others, it is especially important to maintain and conserve the protected areas. The
red listed carnivores were exclusively observed in the protected areas since it may be difficult
for them to exist in areas with human activities. Large carnivores are particularly sensitive
and their populations are expected to decrease even further, as the human population grows
(Woodroffe 2000). These species require large areas to find enough resources and as top
predators they play an important part in the ecosystem (Begon et al. 1996; Woodroffe 2000).
As described previously in this report wild large carnivores conflict directly and indirectly
with human activities and as my results show, they have difficulties to survive outside
protected areas.
Most elephants were also observed in the protected areas, a few also in the unprotected areas.
However, the largest population of elephants (approximately 100,000 animals) in the world is
presently seen in northern Botswana and adjacent parts of Namibia, Zambia and Zimbabwe
(Skarpe et al. 2004). The protected areas seem to be too small for the current population
density and behaviour, hence, they probably have no choice but to move out to the
unprotected areas.
Northern Kalahari in comparison to southern Kalahari
On regional scale the northern part of Botswana had higher densities of wild mammals and
ostriches due to the overall higher productivity of vegetation and water availability (Andrews
& O’Brien 2000). Also, most of the wildlife preferred the protected areas over other areas on
a regional scale, which proves that wildlife avoid areas with human activities. This was true
for all of the functional group, independent of season and region. Hypothesis 3 was thereby
confirmed.
Among the studied functional groups, the gradients in the environment, caused by human land
use activities, were responded differently for mammals with different functional traits. The
wild herbivores dominated the protected areas and the domestic herbivores the unprotected.
Today the domestic herbivores dominate the savannas in the Kalahari (Moleele & Mainah
2003) and the changes in the landscape they cause, has both direct and indirect effects on the
wildlife. It seems like domestic herbivores outcompete large herbivores for resources.
Livestock areas are many times overgrazed (Perkins 1996) and the savannas of the Kalahari
support a higher herbivore density than it ever has done (du Toit & Cumming 1999). Wild
animals tend to keep a distance to villages in a range of approximately 20 km (Bergström &
Skarpe 1999) which suggest that the environment has changed close to areas with human
activities. Wild animal densities have declined the past decades (Verlinden 1997) which may
be since livestock areas are expanding in Botswana (Moleele & Mainah 2003; Wallgren et al.
2008). The increasing livestock production fragments the landscape and restricts the wildlife
23. 23
to other areas (Fjeldså et al. 2004). Hence, it is crucial to preserve the protected areas and find
ways to make wild animals co-exist with human activities.
Wild animals encountered in the unprotected areas were mainly omnivores, insectivores and
to some extent small herbivores. As mention earlier in this report the changes in the landscape
in livestock areas, causes bush encroachment (Skarpe 1986). Bush encroachment may give
some of these animals protection from predators, but on the other hand, many of the species
have less food availability (beetles, grasshoppers etc.) in these areas. This is especially true
where the bush encroachment is severe (Blaum et al. 2007). However, the highest proportions
of the densities of these functional groups were still found in the protected areas which
confirm hypothesis number 3.
Many similar studies have been made (Wallgren 2008; Persson in prep.; Träff in prep.;
Jakobsson 2006; Carlsson 2006; Viio 2003) given similar result as in my study, showing that
human land use strongly affects the wild animals. Both climatic and anthropogenic effects on
the environment the past 30 years have caused large declines in many wildlife species
(Spinage 1992). Even though, almost a one fourth of the country is set aside as protected areas
in Botswana (Twyman 2001). Indicator species may be an option to measure the ecological
impact human land use activities have outside the protected areas. Carnivores may be a good
example to use, due to their vulnerability (Blaum et al. 2007). Also, the WMA is a good
example for involving local livelihoods. They may benefit and in the same way preserve wild
animals. Wildlife is proven to be able to occur in high densities in areas with a low human
influence. This is a fact that may benefit both local communities and the future existence of
wild animals in the African savannas (du Toit 2002).
Conclusion
This study is a comparative study of wildlife densities over environmental gradients, seasons
and regions. Conclusively, the research shows that human land use have an influence on wild
mammals as well as ostriches in Botswana. Large and medium sized herbivores and
carnivores are most affected by human activities and smaller mammals least. Wild animals
did not exist, or existed in low densities in the same areas as the domestic animals did. The
seasonal and regional differences in the environment did not prove to affect the wildlife as
much as human activity, which also was confirmed by Wallgren et al. (2009).
This study shows that human land use has a great impact on wildlife and has the potential to
determine its distribution. Different types of wildlife will respond differently to environmental
changes and my study shows the need to maintain protected areas for the existence of many
species. It is important to focus on the influence that human-related activities cause, but also
on the benefit we can make by conservation plans and preservation of wildlife. In general
terms, little attention has been given to the fact that biodiversity has an economic value, and
by sustainably develop and conserve natural ecosystems human wellbeing may improve.
24. 24
However, a wider understanding and more research is needed both on local and global level
on this matter (IUCN 2011).
Acknowledgement
First of all I would like to thank Märtha Wallgren who gave me the opportunity to go to
Botswana and conduct this study. You were there from the beginning to the end with support,
advice and feedback.
I also thank SIDA for the financial support and promoting the opportunity to go to Botswana.
In addition I would like to acknowledge the Office of the President of Botswana and the
Department of Wildlife and National Parks for giving us the research permit to perform the
investigation.
I also thank Malin Gustafsson with whom I conducted the investigation. You were a perfect
field companion. Thank you for your patience, support and invaluable friendship; it would not
have been the same without you. I also thank our field assistant Karin Carlsson who guided us
into the Botswana wilderness, we shared some unforgettable moments!
Many thanks to Christina Skarpe and Roger Bergström for many advices and tips. Both
Christina and Roger have been giving invaluable help with an unbelievable patience. I
couldn’t have made it without your help!
Thank you to Score and the Sankuyo Tshwaragano Management Trust who allowed us to
perform our investigation in their area. They also provided us with guides and information
during the field work. Thank you for teaching us how to drive through deep water and handle
wild elephants, it was priceless! I also thank Dr Shimane for support in Botswana and for
being our external supervisor. I am very grateful to the Seamans’ who gave us a secure
housing and came to help us when the car broke down. Thank you for advice and many
laughs!
Thank you Magnus Persson, Henrik Träff, Tobias Jakobsson, Karin Carlsson and Tanja Viio
for letting me use your data in various comparisons.
I thank my family and friends who always have been around to support and encourage me.
Last but not least a special thanks to my brother-in-law Carl-Johan Svensson for invaluable
tips, feedback and inspiration!
25. 25
References
Andrews P. & O’Brien E. M. 2000. Climate, vegetation, and predictable gradients in
mammal species richness in the southern Africa. J. Zool., Lond. 251: 205 – 231.
Begon M., Harper J.L. & Townsend C. R. 1996. Ecology: Individuals, Populations and
communities. 3rd
edition. Blackwell Science. Oxford.
Bergström R. & Skarpe C. 1999. The abundance of large wild herbivores in a semi-arid
savanna in relation to seasons, pans and livestock. Afr. J. Ecol. 37: 12 – 26.
Blaum N., Rossmanith E., Popp A. & Jeltsch F. 2007. Shrub encroachment affects
mammalian carnivore abundance and species richness in semiarid rangelands. Acta
Oecologica 31: 86 – 92.
Buckland S.T., Goudie I. B. J. & Borchers D. L. 2000. Wildlife Population Assessment: Past
Developments and Future Directions. Biometrics 56: 1-12
Buckland S.T., Anderson. D.R., Burnham K.P. & Laake J.L. 1993. Distance Sampling:
Estimating Abundance of Biological Populations. Chapman and Hall. London. 446pp.
Carlsson K. 2005. Mammal communities in the southern Kalahari: differences between land
use types and seasons. Master thesis. Uppsala University.
Central Statistics Office. Botswana environment Statistics 2008. Department of printing and
publishing service, Gaborone.
Central Statistics Office. Wildlife statistics 2004. Department of printing and publishing
service, Gaborone.
Chanda R., Totolo O., Moleele N., Setshogo M. & Mosweo S. 2003. Prospects for
subsistence livelihood and environmental sustainability along the Kalahari Transect: The
case of Matsheng in Botswana’s Kalahari rangelands. Journal of Arid Environments 54:
425 – 445.
Crowe 1994. Status of selected wildlife resources in Botswana and recommendations for
conservation action. An analysis prepared by the research division of the Department of
Wildlife and National parks. Botswana.
Department of Meteorological Services Botswana. 2003. http://www.weather.info.bw/
Division for Sustainable Development, United Nations Secretariat 2011.
http://sustainabledevelopment.un.org/
du Toit J.T. & Cumming D.H.M. 1999. Functional significance of ungulate diversity in
African savannas and the ecological implications of the spread of pastoralism.
Biodiversity and conservation 8: 1643 – 1661.
du Toit J.T. 2002 Wildlife harvesting guidelines for community-based wildlife management:
a southern African perspective. Biodiversity and Conservation 11: 1403 – 1416.
du Toit J.T. 1995. Determinants of the composition and distribution of wildlife communities
in Southern Africa. Ambio 24 (1): 2 – 6.
Earth in focus, Global Environment Facility, iLCP 2010. Defying extinction: Partnership to
Safeguard Global Biodiversity.
Fewster R. M., Buckland S. T., Burnhamn K. P., Borchers D. L., Jupp P. E., Laake J. L. &
Thomas L. 2009. Estimating the encounter rate variance in distance sampling. Biometrics
65: 225 – 236.
26. 26
Fjeldså J., Burgess N. D., Blyth S., Klerk H. M. 2004. Where are the major gaps in the
reserve network for Africa’s mammals? Oryx 38
Hobbs N. T., Galvin K. A., Stokes C. J., Lackett J. M., Ash A. J., Boone R. B., Reid R. S.,
Thornton P. K 2008. Fragmentation of rangelands: Implications for humans. Animals and
landscape. Global Environmental Change 18: 776 – 785.
IUCN. 2011 http://www.iucn.org
IUCN Red list of Threatened Species. 2009 http://www.iucnredlist.org/
Jakobsson T. 2006. Influence of land use intensity on mammal densities in an African
savanna. Master thesis Uppsala University.
Moleele N. M. & Mainah J. 2003. Resource conflicts: the future of the Kalahari ecosystem.
Journal of Arid environments 54: 405 – 423
Olff H., Ritcie M. E. & Prins H. H. T. 2002. Global environmental controls of diversity in
large herbivores. Nature 415: 901 – 904.
Pearce F. 1993. Botswana: enclosing for beef. The ecologist 23.
Perkins J. S. 1996. Botswana: fencing out the equity issue. Cattleposts and cattle ranching in
the Kalahari Desert. Journal of arid environments 33: 503 – 517.
Romañach S. S., Lindsey P. A., Woodroffe R. 2007. Determinants of attitudes towards
predators in central Kenya and suggestions for increasing tolerance in livestock
dominated landscapes. Oryx 41 (2): 185 – 195.
Scholes R.J., Dowty P.R., Caylor K. Parsons D.A.B., Frost P.G.H. & Shugart H.H. 2002.
Trends in savanna structure and composition along an aridity gradient in the Kalahari.
Journal of vegetation science 13: 419 – 428.
Secretariat of the Convention of Biological Diversity 2000. Sustaining life on Earth. How
the Convention of Biological Diversity promotes nature and human well-being.
http://www.cbd.int/
Skarpe C. 1986. Plant community structure in relation to grazing and environmental changes
along a north-south transect in the western Kalahari. Vegetation 68: 3 – 18
Skarpe C. 1990. Shrub layer dynamics under different herbivore densities in an arid
savanna. Botswana. Journal of applied ecology 27: 873 – 885.
Skarpe C., Aarrestad P. A., Andreassen H. P., Dhillion S. S., Dimakatso T., du Toit J. T.,
Halley D. J., Hytteborn H., Makhabu S., Mari. M. Marokane W., Masunga G., Modise
D., Moe S. R., Mojaphoko R., Mosugelo D., Motsumi S., Neo-Mahupeleng G.,
Ramotadima. M., Rutina L., Sechele L., Sejoe T. B., Stokke S., Swenson J. E., Taolo C.,
Vanderwalle M. & Wegge P. 2004. The return of the giants: Ecological effects of an
increasing elephant population. Ambio 33.
Smithers 2000. Mammals of Southern Africa a field guide. Struik Publishers.
Spinage C.A. 1992. The decline of the Kalahari wildebeest. Oryx 26.
Sutherland W. J. 2006. Ecological census techniques, a handbook. Second edition.
Cambridge: 143 – 145.
Thomas L., Buckland S. T., Burnham K. P., Anderson D. R., Laake J. L., Borchers D. L. &
Strindberg S. 2002. Encyclopedia of Environmetrics 1: 544 – 552.
Thomas D.S.G & Shaw P.A 1993. Evolution and characteristics of the Kalahari, southern
Africa. Journal of Arid environments 25: 97 – 108.
27. 27
Twyman. C. 2001. Natural resource use and livelihoods in Botswana’s Wildlife
Management Areas. Applied Geography 21: 45 – 68.
Verlinden A. 1997. Human settlements and wildlife distributions in the southern Kalahari of
Botswana. Biological conservation 82: 129 – 136.
Verlinden A., Perkins J. S., Murray M. & Masunga G. 1998. How are people affecting the
distribution of less migratory wildlife in the southern Kalahari of Botswana? A spatial
analysis. Journal of Arid Environments 38: 129 – 141.
Viio. T. 2004. Does land use affect mammal diversity in the savannah ecosystems? Master
thesis. Uppsala University.
Wallgren M. 2001. Mammal communities in the Southern Kalahari – distribution and
species composition. Master thesis. Uppsala University.
Wallgren M., Skarpe C., Bergström R., Danell K., Granlund L. & Bergström A. 2008.
Mammal community structure in relation to disturbance and resource gradients in
southern Africa. Afr. J. Ecol. 47: 20 – 31.
Wallgren M., Skarpe C., Bergström R., Danell K., Bergström A., Carlsson K., Jakobsson T.
& Strand T. 2009. Influence of land use on the abundance of wildlife and livestock in the
Kalahari, Botswana. Journal of arid savannas 73: 314 – 321.
Woodroffe R. 2000. Predators and people: using human densities to interpret declines of
large carnivores. Animal Conservation 3: 165 – 173.
28. 28
Appendix 1
Densities of wild and domestic mammals and ostriches in different types of land use (CGA, FR, WMA, NP) over different regions and seasons in Botswana. LD = Low
density (less than 0.01 animal animals/km2
; U CL = upper confidential limits; L CL = lower confidential as well as statistical significant (S = significant, NS = no statistical
significant) NB = Northern Botswana; SB = Southern Botswana. For species abbreviation see table 2.
Wild animals
NB wet season NB dry season SB wet season SB dry season
CGA FR WMA NP CGA FR WMA NP CGA FR WMA NP CGA FR WMA NP Sign.
U CL 0.4 2.1 8.9 0.8 0.2 0.2 0.8 1.2 0.1 0.1 0.1 0.1 0.3 0.8 0.2 0.7
AWC D 0.2 0.1 1.2 0.6 LD 0.1 0.4 0.7 LD LD LD LD 0.1 0.3 0.1 0.3 S
L CL 0.1 LD 0.1 0.5 LD LD 0.2 0.4 LD LD LD LD LD 0.1 0.1 0.1
U CL 0.5 3.7 0.1 0.4 0.3 0.9 0.2 0.7 0.2 0.4 0.4 0.8 0.2 0.6
BBJ D 0.2 0.7 0.1 - - 0.1 0.1 0.4 0.1 0.3 0.1 0.3 0.2 0.2 0.1 0.3 NS
L CL 0.1 0.1 0.1 LD LD 0.2 LD 0.1 0.1 0.2 0.1 LD 0.1 0.1
U CL 0.2 0.4 0.5 1.0 0.5 0.9 0.9 0.6 0.7 0.5 0.9
BFX D - - - - 0.1 0.1 0.1 0.5 - 0.1 0.4 0.5 0.2 0.2 0.2 0.5 NS
L CL 0.0 LD LD 0.2 LD 0.2 0.3 0.1 LD 0.1 0.2
U CL 3.2 4.1 3.0 0.5 1.6 0.2 2.6 1.9
BUB D 0.9 0.2 0.7 0.4 0.8 LD 1.5 0.4 - - - - - - - - NS
L CL 0.3 LD 0.1 0.3 0.4 LD 0.9 0.1
U CL 0.1 0.2 0.1 0.1 0.2 0.3 0.1 0.8 0.4 0.3
CFX D - - - - LD - LD - LD LD 0.1 0.1 LD 0.3 0.2 0.2 NS
L CL LD LD LD LD LD 0.1 LD 0.1 0.1 0.1
U CL 0.6 0.6 0.2 0.2 0.1 0.1 0.1 0.1 0.1 0.8 0.2
CDU D - - - - 0.3 0.3 0.1 LD 0.1 LD LD LD LD 0.1 0.1 - S
L CL 0.2 0.1 LD LD LD LD LD LD LD LD LD
29. 29
U CL 1.1 2.7 0.1 0.1 2.5
ELE D - - 0.3 1.8 LD - LD 1.6 - - - - - - - - S
L CL 0.1 1.2 LD LD 1.0
U CL 0.2 0.1 1.2 0.2 0.1 1.2
GEM D - - - - - - - - - LD LD 0.7 - LD 0.1 0.6 NS
L CL LD LD 0.4 LD LD 0.3
U CL 1.0 1.3 2.2 2.5
GIR D - - 0.5 0.8 - - 0.9 1.4 - - - - - - - - NS
L CL 0.3 0.5 0.4 0.8
U CL 1.2 1.3 1.0 1.3 0.7 1.7 33.7 1.0 2.2
GSQ D - - - - - 0.1 - - 0.5 0.2 0.5 0.3 0.7 9.8 0.4 0.4 S
L CL LD 0.2 0.1 0.2 0.2 0.3 2.8 0.2 0.1
U CL 19.2 56.3 37.9 31.8 8.1 4.0 6.5 9.3 1.8 4.2 1.5 1.9 3.9 11.4 3.2 5.0
HAR D 9.2 6.4 3.0 18.6 5.3 0.5 3.5 5.2 0.9 1.9 0.8 1.1 2.2 4.9 2.0 2.7 S
L CL 4.4 0.7 0.2 10.9 3.5 0.1 1.9 2.9 0.5 0.8 0.4 0.7 1.3 2.1 1.3 1.5
U CL 22.0 33.7 12.7 17.6
IMP D - - 11.5 25.2 - - 6.3 10.7 - - - - - - - - S
L CL 6.0 18.8 3.2 6.6
U CL 0.3 0.9 2.4 0.4 0.4
KUD D - - - - - 0.1 0.2 1.1 - - - - - - 0.1 0.1 S
L CL LD 0.1 0.5 LD LD
U CL 0.5 0.2 1.2 0.7
LGN D - - - - 0.2 LD 0.6 0.3 - - - - - - - - NS
L CL 0.1 LD 0.3 0.1
U CL 0.3 0.7 0.1 0.9 1.5 0.1 0.2 0.3 0.8 0.3 0.2
OST D - - - - 0.1 0.3 LD 0.3 0.3 LD 0.1 0.1 0.2 - 0.2 0.1 S
L CL LD 0.1 LD 0.1 0.1 LD LD LD 0.1 0.1 LD
U CL 0.2 0.7 0.2 0.2 0.2 0.3 1.0
RHB D - - - - - - - - LD - 0.4 0.1 LD LD 0.1 0.2 NS
L CL LD 0.2 LD LD LD LD 0.1
31. 31
Domestic
animals
NB wet season NB dry season SB wet season SB dry season
CGA FR WMA NP CGA FR WMA NP CGA FR WMA NP CGA FR WMA NP Sign.
U CL 118.1 157.6 36.0 47.0 20.3 89.7 6.7 26.2 88.7 1.3
CAT D 29.1 74.5 - - 19.6 18.1 - - 11.2 54.0 2.9 - 16.2 51.4 0.4 - S
L CL 7.2 35.2 10.7 7.0 6.2 32.5 1.2 10.0 29.8 0.1
U CL 1.7 8.5 3.8 0.4 0.8 7.8 0.4 4.0 12.9 0.4
DOG D 0.9 1.4 - 1.6 0.1 - - 0.3 3.2 0.1 - 1.5 3.9 0.1 - S
L CL 0.5 0.2 0.7 0.0 0.1 1.3 0.0 0.6 1.2 0.0
U CL 9.3 27.4 2.7 6.6 4.5 9.8 0.7 5.9 14.8 1.8
DON D 2.7 8.5 - - 1.4 1.4 - - 2.4 4.4 0.3 - 3.2 4.4 0.7 - NS
L CL 0.8 2.6 0.8 0.3 1.3 1.9 0.1 1.7 1.3 0.3
U CL 25.9 60.6 16.2 38.1 22.4 25.0 2.7 26.9 30.9 7.3
GOA D 7.1 17.7 - - 8.3 6.2 - - 12.2 12.4 1.0 - 15.9 7.5 2.3 - S
L CL 1.9 5.2 4.3 1.0 6.6 6.2 0.3 9.3 1.8 0.8
U CL 1.9 5.4 0.4 1.0 0.9 3.9 0.3 0.9 3.4 0.4
HOR D 0.4 1.6 - - 0.1 0.3 - - 0.3 2.0 0.1 - 0.5 1.4 0.2 - S
L CL 0.1 0.4 0.0 0.1 0.1 1.0 0.0 0.3 0.6 0.1
U CL 0.1 0.5 2.7 8.6 2.8 14.4 1.0
SHE D - - - - 0.0 0.1 - - 0.5 3.3 - - 1.0 4.4 0.2 - S
L CL 0.0 0.0 0.1 1.3 0.4 1.4 0.1
32. 32
Appendix 2
Functional groups of animals analyzed with DISTANCE 5.0 during the wet and dry seasons, in northern
and southern Botswana.
Wild animals
Species Scientific name Abbr. Functional group Body mass (kg)
Bat-eared fox
Otocyon
megalotis
BFX Insectivores
3.0 - 5.4
Slender
mongoose
Galerella ssp. SMG Insectivores
0.4 - 0.8
Yellow
mongoose
Cynictis
penicillata
YMG Insectivores
0.6 - 0.8
Black-backed
jackal
Canis mesomelas BBJ Omnivores
5.0 - 12.0
Large spotted
genet
Genetta tigrina LSG Omnivores
1.4 - 2.5
Lesser bushbaby Galago moholi BUB Omnivores 0.1 - 0.2
Ostrich Struthio camelus OST Omnivores 90.0 - 100.0
Small spotted
genet
Genetta genetta SGN Omnivores
1.5 - 2.6
Warthog
Phacochoerus
aethiopicus
WAR Omnivores
44.0 - 104.0
Cape/Scrub hare
Lepus
capensis/saxatilis
HAR Small herbivores
1.4 - 2.5
Ground squirrel Xerus inauris GSQ Small herbivores 0.5 - 1.0
Springhare Pedetes capensis SPH Small herbivores 2.9 - 3.9
Tree squirrel Paraxerus cepapi TSQ Small herbivores 0.8 - 0.3
African wildcat Felis lybica AWC Wild carnivore 2.4 - 6.4
Cape fox Vulpes chama CFX Wild carnivore 2.3 - 4.2
African elephant
Loxodonta
africana
ELE
Wild large and
medium sized
herbivore
2,500.0 - 6,000.0
Blue wildebeest
Connochaetes
taurinus
WIL
Wild large and
medium sized
herbivore
180.0 - 250.0
Common duiker
Sylvicapra
grimmia
CDU
Wild large and
medium sized
herbivore
15.3 - 25.4
Giraffe
Giraffa
camelopardalis
GIR
Wild large and
medium sized
herbivore
700.0 - 1,400.0
Greater kudu
Tragelaphus
strepsiceros
KUD
Wild large and
medium sized
herbivore
120.0 - 305.0
33. 33
Impala
Aepyceros
melampus
IMP
Wild large and
medium sized
herbivore
32.0 - 66.0
Gemsbok Oryx gazella GEM
Wild large and
medium sized
herbivore
210.0 - 260.0
Springbok
Antidorcas
marsupialis
SPR
Wild large and
medium sized
herbivore
30.4 - 48.0
Steenbok
Raphicerus
campestris
STE
Wild large and
medium sized
herbivore
3.9 - 13.2
Zebra Equus burchelli ZEB
Wild large and
medium sized
herbivore
260.0 - 340.0
Domestic
animals
Cattle Bos taurus CAT
Domestic large and
medium sized
herbivores
300.0 - 400.0
Donkey Equus asinus DON
Domestic large and
medium sized
herbivores
140.0
Goat Capra hircus GOA
Domestic large and
medium sized
herbivores
30.0
Horse Equus caballus HOR
Domestic large and
medium sized
herbivores
250.0
Sheep Ovis aries SHE
Domestic large and
medium sized
herbivores
30.0
Domestic dog Canis familiaris DOG Domestic carnivore 15.0 - 25.0
34. SENASTE UTGIVNA NUMMER
2013:6 The influence of forestry stands treatments on brown bears (Ursus arctos) habitat
selection in Sweden – an option for Alberta forestry?
Författare: Anna Maria Petré
2013:7 The effects of Gotland pony grazing on forest composition and structure in Lojsta
hed, south eastern Sweden.
Författare: Emma Andersson
2013:8 Social and economic consequences of wolf (Canis lupus) establishments in
Sweden.
Författare: Emma Kvastegård
2013:9 Manipulations of feed ration and rearing density: effects on river migration
performance of Atlantic salmon smolt.
Författare: Mansour Royan
2013:10 Winter feeding site choice of ungulates in relation to food quality.
Författare: Philipp Otto
2013:11 Tidningen Dagens Nyheters uppfattning om vildsvinen (Sus scrofa)? – En innehålls
analys av en rikstäckande nyhetstidning.
Författare: Mariellé Månsson
2013:12 Effects of African elephant (Loxodonta africana) on forage opportunities for local
ungulates through pushing over trees.
Författare: Janson Wong
2013:13 Relationship between moose (Alces alces) home range size and crossing wildlife
fences.
Författare: Jerk Sjöberg
2013:14 Effekt av habitat på täthetsdynamik mellan stensimpa och ung öring I svenska
vattendrag.
Författare: Olof Tellström
2013:15 Effects of brown bear (Ursus arctos) odour on the patch choice and behaviour of
different ungulate species.
Författare: Sonja Noell
2013:16 Determinants of winter kill rates of wolves in Scandinavia.
Författare: Mattia Colombo
2013:17 The cost of having wild boar: Damage to agriculture in South Southeast Sweden.
Författare: Tomas Schön
2013:18 Burnt forest clear cuts a breeding habitat for Ortolan Bunting Emberiza hortulana
in northern Sweden?
Författare; Cloé Lucas
Hela förteckningen på utgivna nummer hittar du på www.slu.se/viltfiskmiljo