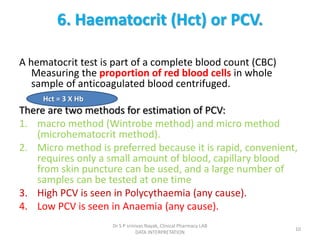
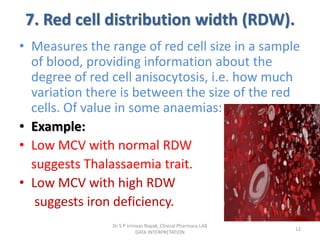
Call Girls Cuttack Just Call 9907093804 Top Class Call Girl Service Available
hematologicallaboratorytests-210309102024.pdf
1. CLINICAL LABORATORY TESTS USED
IN THE EVALUATION OF DISEASE
STATES AND INTERPRETATION OF
TEST RESULTS
Presented by:
Dr. S P SRINIVAS NAYAK,
Assistant Professor, SUCP
1
Dr S P Srinivas Nayak, Clinical Pharmacy
LAB DATA INTERPRETATION
2. Why ask for a CBC?
• It is also called as complete blood picture/complete
blood count(CBP/CBC)
• The FBC assesses several different parameters and can
provide a great deal of information.
• The red cell variables will determine whether or not
the patient is anaemic. If anaemia is present the MCV
is likely to provide clues as to the cause of the anaemia.
• The white cells are often raised in infection
neutrophilia in bacterial infections and lymphocytosis
in viral (but not always so).
• Platelets (size or number) may be abnormal either as a
direct effect of underlying blood disease.
Dr S P srinivas Nayak, Clinical Pharmacy LAB
DATA INTERPRETATION
2
3. A. Haematological TESTS
• Main parameters measured
• 1. Hb concentration.
• 2. Red cell count (RCC).
• 3. MCV (Mean cell volume)
• 4. MCH.
• 5. MCHC.
• 6. Haematocrit (Hct) or PCV.
• 7. Red cell distribution width (RDW).
• 8. White cell count.
• 9. WBC differential.
• 10.Platelet count
3
Dr S P srinivas Nayak, Clinical Pharmacy LAB
DATA INTERPRETATION
4. 1. Haemoglobin concentration (Hb)
Haemoglobin concentration (Hb) Hemoglobin is the protein
molecule in red blood cells that carries oxygen from the
lungs to the body's tissues and returns carbon dioxide
from the tissues back to the lungs. Hemoglobin is made up
of four protein molecules (globulin chains) that are
connected together. It mainly Defines Anaemia
Normal values:
Male: 14 – 18 g/dl or g %
Female: 12 - 16 g/dl or g %
Values differ between males and females since
androgens drive RBC production and hence adult
males has higher Hb, PCV and RCC than adult
females.
Dr S P srinivas Nayak, Clinical Pharmacy LAB
DATA INTERPRETATION
4
5. 2. Red cell count (RCC).
Normal values:
male: 4.5 – 5.5 × 10¹²/L. or 4.5 – 5.5 × 10⁶/ml
Female: 4 – 5× 10¹²/L. or 4 – 5 × 10⁶/ml
• Most clinicians pay little attention to the red cell
count but this parameter is useful in the diagnosis
of polycythaemic disorders and thalassaemias
(the latter results in the increased production of
red cells that are smaller than usual and contain
low quantities of haemoglobin, i.e. are microcytic
and hypochromic).
Dr S P srinivas Nayak, Clinical Pharmacy LAB
DATA INTERPRETATION
5
6. Abnormalities in RBC count
Causes of a low red cell count
include
• Hypoproliferative
anaemias, e.g. iron, vitamin
B12 and folate deficiencies.
• Aplasias e.g. idiopathic or
drug-induced (don’t forget
chemotherapy).
• Parvovirus B19 infection-
induced red cell aplasia
resulting in transient
marked anaemia.
Causes of high red cell count
include
• PRV. (Polycythaemia Rubra
Vera)
• Thalassaemia.
Dr S P srinivas Nayak, Clinical Pharmacy LAB
DATA INTERPRETATION
6
7. 3. MCV. (Mean cell volume)
Mean cell volume or Mean corpuscular volume
(MCV) is the average volume of red cells in a
specimen. MCV is elevated or decreased in
accordance with average red cell size
low MCV indicates microcytic (small average
RBC size), normal MCV indicates normocytic
(normal average RBC size), and high MCV
indicates macrocytic (large average RBC size).
Dr S P srinivas Nayak, Clinical Pharmacy LAB
DATA INTERPRETATION
7
8. Dr S P srinivas Nayak, Clinical Pharmacy LAB
DATA INTERPRETATION
8
9. Mean cell haemoglobin concentration (MCHC)
MCHC is High in
• Severe prolonged dehydration.
• Hereditary spherocytosis.
• Cold agglutinin disease.
MCHC is Low in
• Iron deficiency anaemia.
• Thalassaemia.
Dr S P srinivas Nayak, Clinical Pharmacy LAB
DATA INTERPRETATION
9
10. 6. Haematocrit (Hct) or PCV.
A hematocrit test is part of a complete blood count (CBC)
Measuring the proportion of red blood cells in whole
sample of anticoagulated blood centrifuged.
There are two methods for estimation of PCV:
1. macro method (Wintrobe method) and micro method
(microhematocrit method).
2. Micro method is preferred because it is rapid, convenient,
requires only a small amount of blood, capillary blood
from skin puncture can be used, and a large number of
samples can be tested at one time
3. High PCV is seen in Polycythaemia (any cause).
4. Low PCV is seen in Anaemia (any cause).
Dr S P srinivas Nayak, Clinical Pharmacy LAB
DATA INTERPRETATION
10
Hct = 3 X Hb
11. Dr S P srinivas Nayak, Clinical Pharmacy LAB
DATA INTERPRETATION
11
12. 7. Red cell distribution width (RDW).
• Measures the range of red cell size in a sample
of blood, providing information about the
degree of red cell anisocytosis, i.e. how much
variation there is between the size of the red
cells. Of value in some anaemias:
• Example:
• Low MCV with normal RDW
suggests Thalassaemia trait.
• Low MCV with high RDW
suggests iron deficiency.
Dr S P srinivas Nayak, Clinical Pharmacy LAB
DATA INTERPRETATION
12
13. 8. White cell count.
• Quantitative estimation of total WBC in human by manual method
using Hemocytometer.
• Total WBC count is increased (Leukocytosis) in transiently in
bacterial, viral, protozoal infections parasitic infections such as
Filaria, and also in severe hemorrahage. The degree of leukocytosis
depends on the severity and type of infection.
• Leukopenia (decrease in leukocyte count) occurs in certain
viral infections such as Hepatitis, Influenza and Measles,
Protozoal infections such as Malaria and
bacterial infections such as Typhoid fever
Sometimes in Leukemias, bone marrow depression due to any cause
and in iron deficiency and megaloblastic anemias.
Dr S P srinivas Nayak, Clinical Pharmacy LAB
DATA INTERPRETATION
13
14. White cell count.
• REFERENCE RANGE
• Adults : 4000 – 11,000 cells/cu.mm
• At birth : 10,000 – 25,000 cells/cu.mm
• Infants : (one year) 6000–18000 cells/cu.mm
• 4–7 years : 6000 – 15,000 cells/cu.mm
• 8–12 years : 4,500 – 13,500 cells/cu.mm
The 5 main white cell subtypes in peripheral blood which
include:
1. Neutrophils. 2. Lymphocytes.
3. Monocytes. 4. Eosinophils.
5. Basophils
Dr S P srinivas Nayak, Clinical Pharmacy LAB
DATA INTERPRETATION
14
15. 1. Neutrophils :
2–7.5 ≈ 109 /L (40–75% of white blood cells but values
are more meaningful than percentages)
Increased in (ie. neutrophilia)
• Bacterial infections.
• Inflammation, eg: myocardial
infarction, polyarteritis
nodosa.
• Myeloproliferative disorders.
• Drugs (steroids).
• Disseminated malignancy.
• Stress, eg trauma, surgery,
burns, haemorrhage, seizure
Decreased in (ie neutropenia)
• Viral infections.
• Drugs, eg post chemotherapy,
cytotoxic agents, carbimazole,
sulfonamides.
• Severe sepsis.
• Neutrophil antibodies (SLE,
haemolytic anaemia)
• INCREASED destruction.
• Hypersplenism eg Felty’s
syndrome
• Bone marrow failure
REDUCED production
Dr S P srinivas Nayak, Clinical Pharmacy LAB
DATA INTERPRETATION
15
16. 2. Lymphocytes.
Normal range: 1.5 – 4.5 X 10⁹ /L (20–45%)
Increased (lymphocytosis) in:
Acute viral infections.Chronic infections, eg TB, Brucella, hepatitis,
syphilis.
Leukaemias and lymphomas, especially chronic lymphocytic
leukaemia.
Decrease (lymphopenia) in:
Steroid therapy, SLE;
Uraemia, Legionnaire’s disease;
HIV infection, marrow infiltration
post chemotherapy or radiotherapy.
Dr S P srinivas Nayak, Clinical Pharmacy LAB
DATA INTERPRETATION
16
17. MONOCYTES:
• Monocytosis is the state of excess monocytes in the peripheral blood. It may be
indicative of various disease states.
Examples of processes that can increase a monocyte count include:
• chronic inflammation
• diabetes
• stress response
• Cushing's syndrome (hyperadrenocorticism)
• immune-mediated disease
• granulomatous disease
• atherosclerosis
• necrosis
• red blood cell regeneration
• viral fever
• sarcoidosis
• chronic myelomonocytic leukemia (CMML)
Dr S P srinivas Nayak, Clinical Pharmacy LAB
DATA INTERPRETATION
17
18. Monocytopenia
• Monocytopenia
• Monocytopenia is a form of leukopenia associated
with a deficiency of monocytes. A very low count of
these cells is found after therapy with immuno-
suppressive glucocorticoids.
• Also, non-classical slan+ monocytes are strongly
reduced in patients with Hereditary diffuse
leukoencephalopathy with spheroids (HDLS), a
neurologic disease associated with mutations in the
macrophage colony-stimulating factor receptor gene
Dr S P srinivas Nayak, Clinical Pharmacy LAB
DATA INTERPRETATION
18
19. EOSINOPHILS
• In normal individuals, eosinophils make up
about 1–3% of white blood cells, and are
about 12–17 micrometres in size with bilobed
nuclei
• Along with mast cells and basophils, they also
control mechanisms associated with allergy
and asthma.
• In normal individuals, eosinophils make up
about 1–3% of white blood cells
Dr S P srinivas Nayak, Clinical Pharmacy LAB
DATA INTERPRETATION
19
20. EOSINOPHILIC DISORDERS
EOSINOPHILIA
• An increase in eosinophils, i.e., the
presence of more than 500
eosinophils/microlitre of blood is called
an eosinophilia,
It is typically seen in people with
• A parasitic infestation of the intestines;
• Autoimmune and collagen vascular
disease (such as rheumatoid arthritis)
and
• Systemic lupus erythematosus;
• malignant diseases such as eosinophilic
leukemia, clonal hypereosinophilia, and
Hodgkin's disease; lymphocyte-variant
hypereosinophilia.
EOSINOPENIA
• Eosinopenia is a form of
agranulocytosis where the
number of eosinophil
granulocytes is lower than
NORMAL RANGE
• Leukocytosis with eosinopenia
can be a predictor of bacterial
infection.
• It can be induced by stress
reactions,Cushing's syndrome,
or the use of steroids.
• Pathological causes include
burns and acute infections.
Dr S P srinivas Nayak, Clinical Pharmacy LAB
DATA INTERPRETATION
20
21. BASOPHILS
• Basophils are responsible for inflammatory
reactions during immune response, as well as in
the formation of acute and chronic allergic
diseases, including anaphylaxis, asthma, atopic
dermatitis and hay fever.
• They also produce compounds that co-ordinate
immune responses, including histamine and
serotonin that induce inflammation, heparin that
prevents blood clotting.
Dr S P srinivas Nayak, Clinical Pharmacy LAB
DATA INTERPRETATION
21
22. SUCP
THANK YOU
Dr S P srinivas Nayak, Clinical Pharmacy LAB
DATA INTERPRETATION
22