Healthcare in 2030
•
1 like•1,140 views

We think it is important to think ahead and to consider what issues the medical industry will be facing in the future. As we near 2015 we’ve decided to use this as a half-way point. In this infographic we’ve reflected on significant global changes over the last 15 years and looked at the forecasts for the next 15. The result is a glimpse of what challenges healthcare will face in 2030. Can we do anything today to change the future? Or if we accept this vision of the future what do we need to do now to best prepare?
Recommended

Recommended
More Related Content
What's hot
What's hot (13)
Similar to Healthcare in 2030
Similar to Healthcare in 2030 (20)
More from Team Consulting Ltd
More from Team Consulting Ltd (20)
Recently uploaded
Recently uploaded (20)
Healthcare in 2030
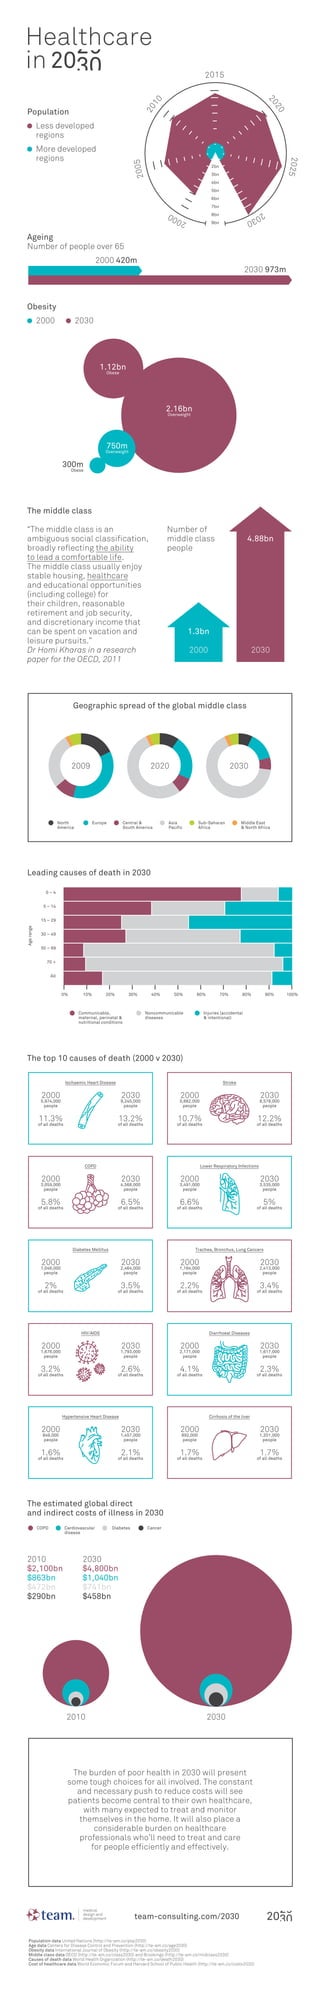
- 1. Healthcare in Po pulation Less developed r egions M ore developed regions The middle class “The middle class is an ambiguous social classification, broadly reflecting the ability t o lead a comfortable life. The middle class usually enjoy stable housing, healthcare a nd educational opportunities (including college) for their children, reasonable retirement and job security, and discretionary income that c an be spent on vacation and l eisure pursuits.” D r Homi Kharas in a research paper for the OECD, 2011 The burden of poor hea lth in 2030 will present some tough choices for a ll involved. The constant and necessary push to reduce costs will see patients become central to their own healthcare, with many expected to treat and monitor themselves in the hom e. It will also place a considerable burd en on healthcare professionals who’ll n eed to treat and care for people efficiently and effectively. Leading causes of death in 2030 The top 10 causes of death (2000 v 2030) The estimated global direct and indirect costs of illness in 2030 Number of middle class people Ageing N umber of people over 65 2000 420m 2030 973m Obesity 2000 2030 2000 2005 2010 2015 2020 2025 2030 4.88 bn 2030 1.3bn 2000 Geographic spread of the global middle class 2009 2020 2030 North America Europe Central & South America Asia Pacific Sub-Saharan Africa Middle East & North Africa 0 – 4 5 – 14 15 – 29 30 – 49 50 – 69 70 + All 0% 10% Communicable, maternal, perinatal & nutritional conditions Noncommunicable diseases Injuries (accidental & intentional) 20% 30% 40% 50% 60% 70% 80% 90% 100% Age range Ischaemic Heart Disease COPD Hypertensive Heart Disease Stroke Lower Respiratory Infections Cirrhosis of the liver 2000 5,974,000 people 11.3% of all deaths 2000 3,059,000 people 5.8% of all deaths 2000 849,000 people 1.6% of all deaths 2000 5,662,000 people 10.7% of all deaths 2000 3,491,000 people 6.6% of all deaths 2000 892,000 people 1.7% of all deaths 2030 9,245,000 people 13.2% of all deaths 2030 4,568,000 people 6.5% of all deaths 2030 1,457,000 people 2.1% of all deaths 2030 8,578,000 people 12.2% of all deaths HIV/AIDS Diarrhoeal Diseases 2000 1,678,000 people 3.2% of all deaths 2000 2,171,000 people 4.1% of all deaths 2030 1,793,000 people 2.6% of all deaths 2030 1,617,000 people 2.3% of all deaths 2030 3,535,000 people 5% of all deaths 2030 1,201,000 people 1.7% of all deaths Diabetes Mellitus Trachea, Bronchus, Lung Cancers 2000 1,046,000 people 2% of all deaths 2000 1,164,000 people 2.2% of all deaths 2030 2,464,000 people 3.5% of all deaths 2030 2,413,000 people 3.4% of all deaths 2.16bn Overweight 1.12bn Obese 750 m Overweight 300m Obese COPD Cardiovascular disease Diabetes Cancer 2030 $4,800bn $1,040bn $741bn $458bn 2010 $ 2,100bn $863bn $472bn $290bn Population data United Nations (http://te-am.co/pop2030) Age data Centers for Disease Control and Prevention (http://te-am.co/age2030) Obesity data International Journal of Obesity (http://te-am.co/obesity2030) Middle class data OECD (http://te-am.co/class2030) and Brookings (http://te-am.co/midclass2030) Causes of death data World Health Organization (http://te-am.co/death2030) Cost of healthcare data World Economic Forum and Harvard School of Public Health (http://te-am.co/costs2030) team-consulting.com/2030 2bn 3bn 4bn 5bn 6bn 7bn 8bn 9bn 2010 2030