Download to read offline

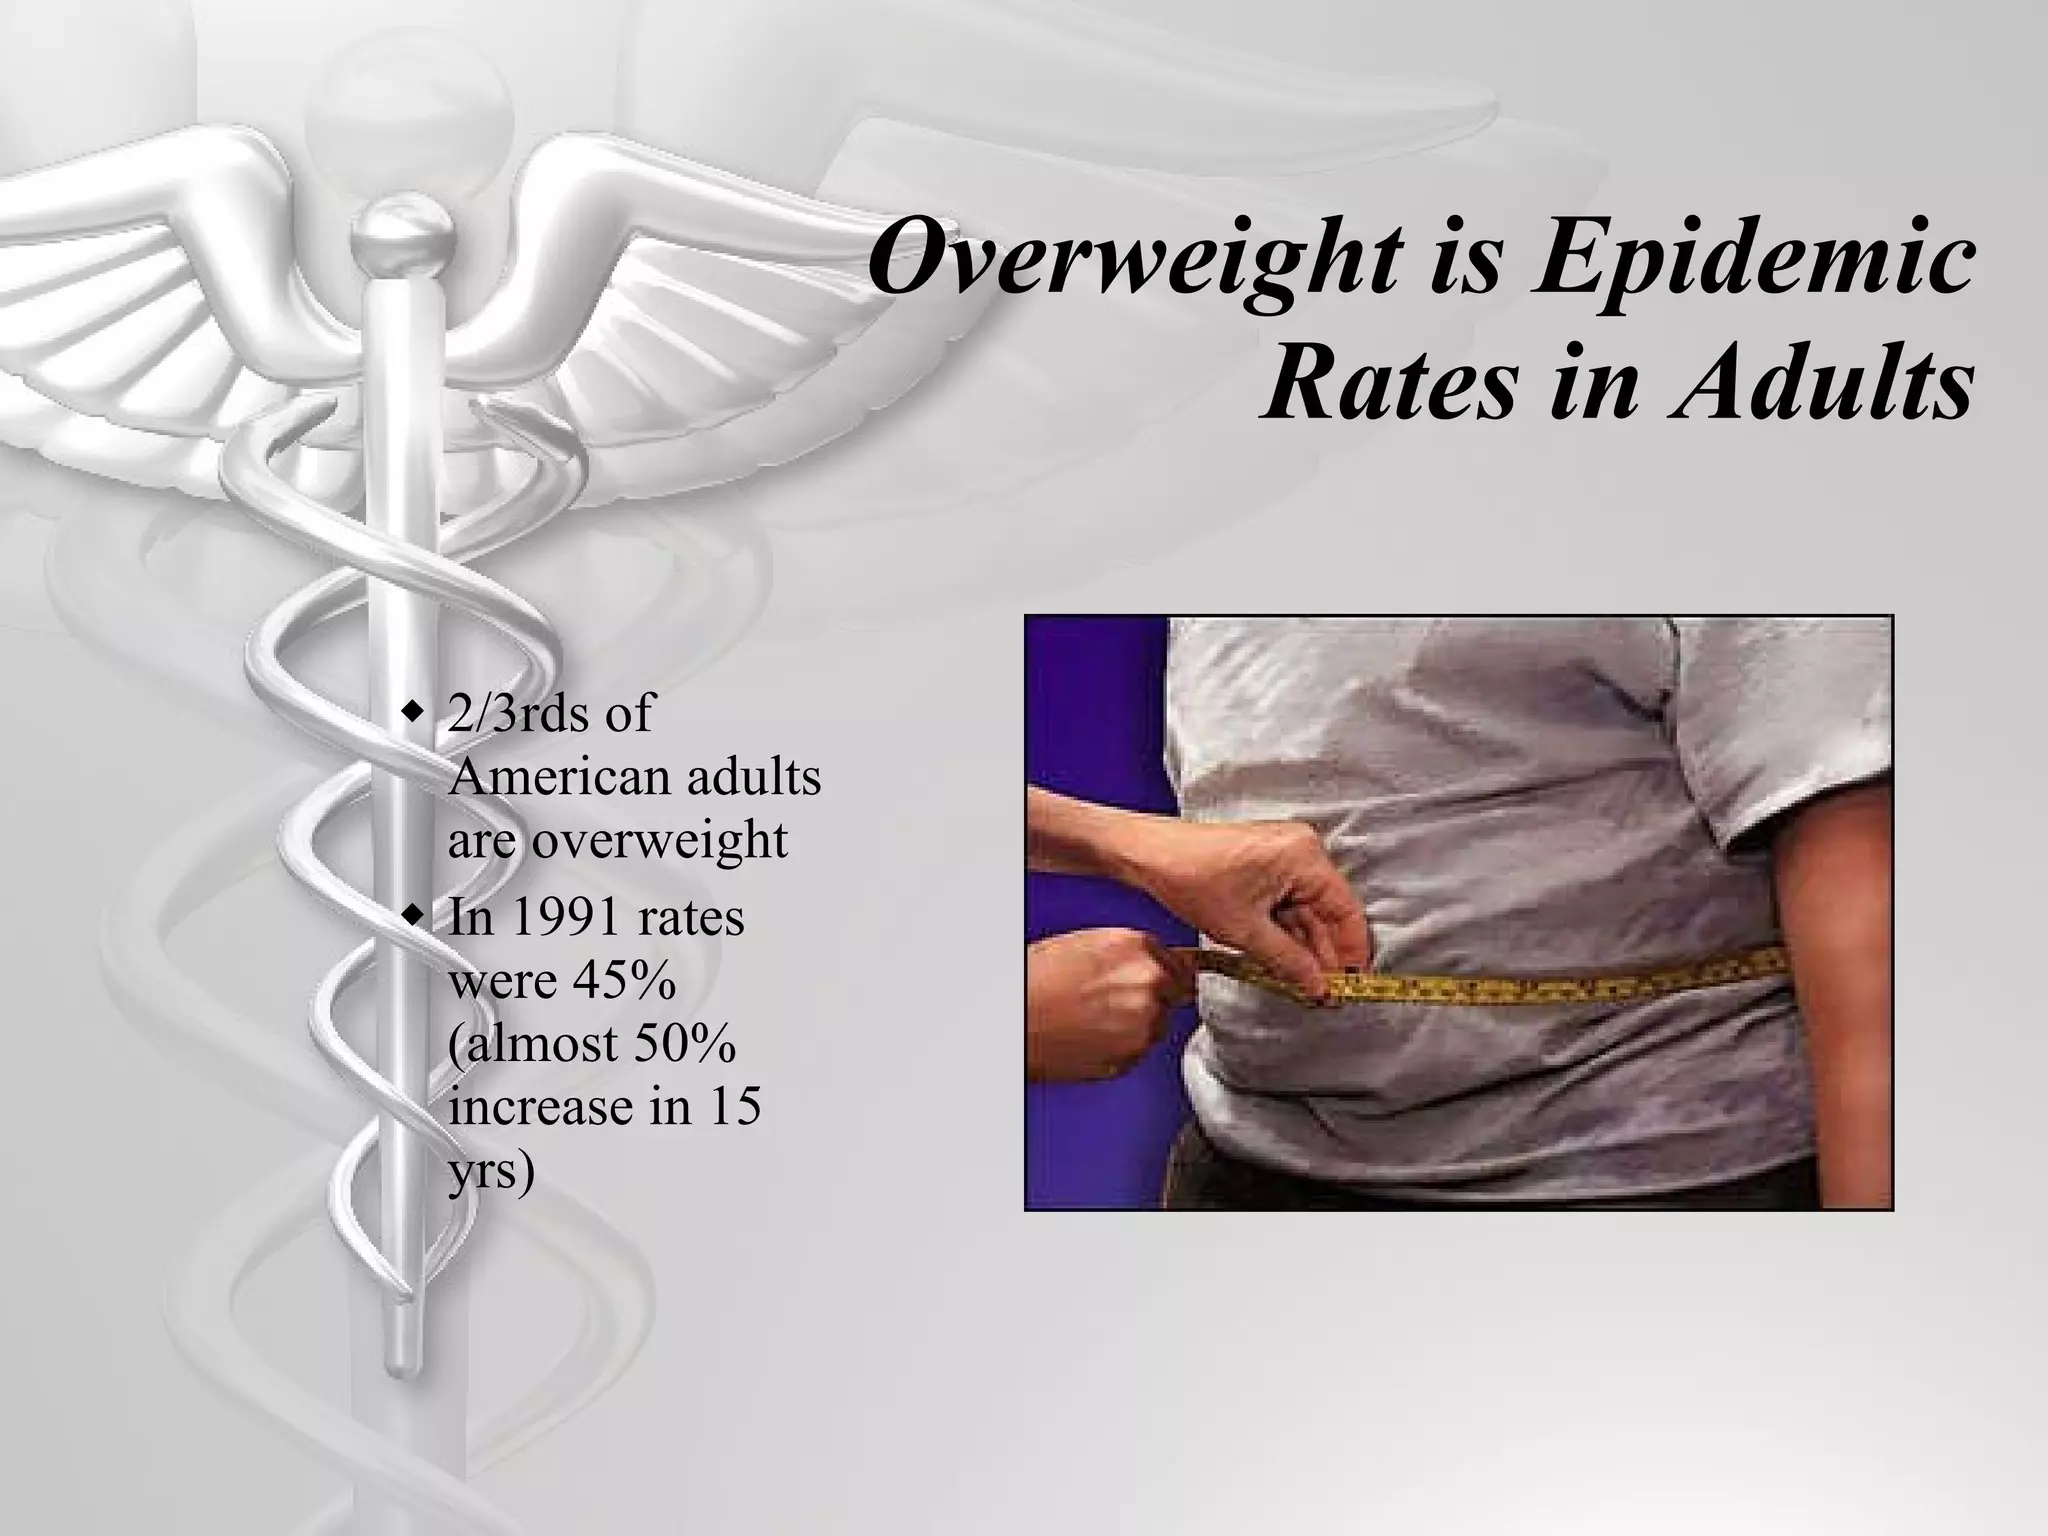
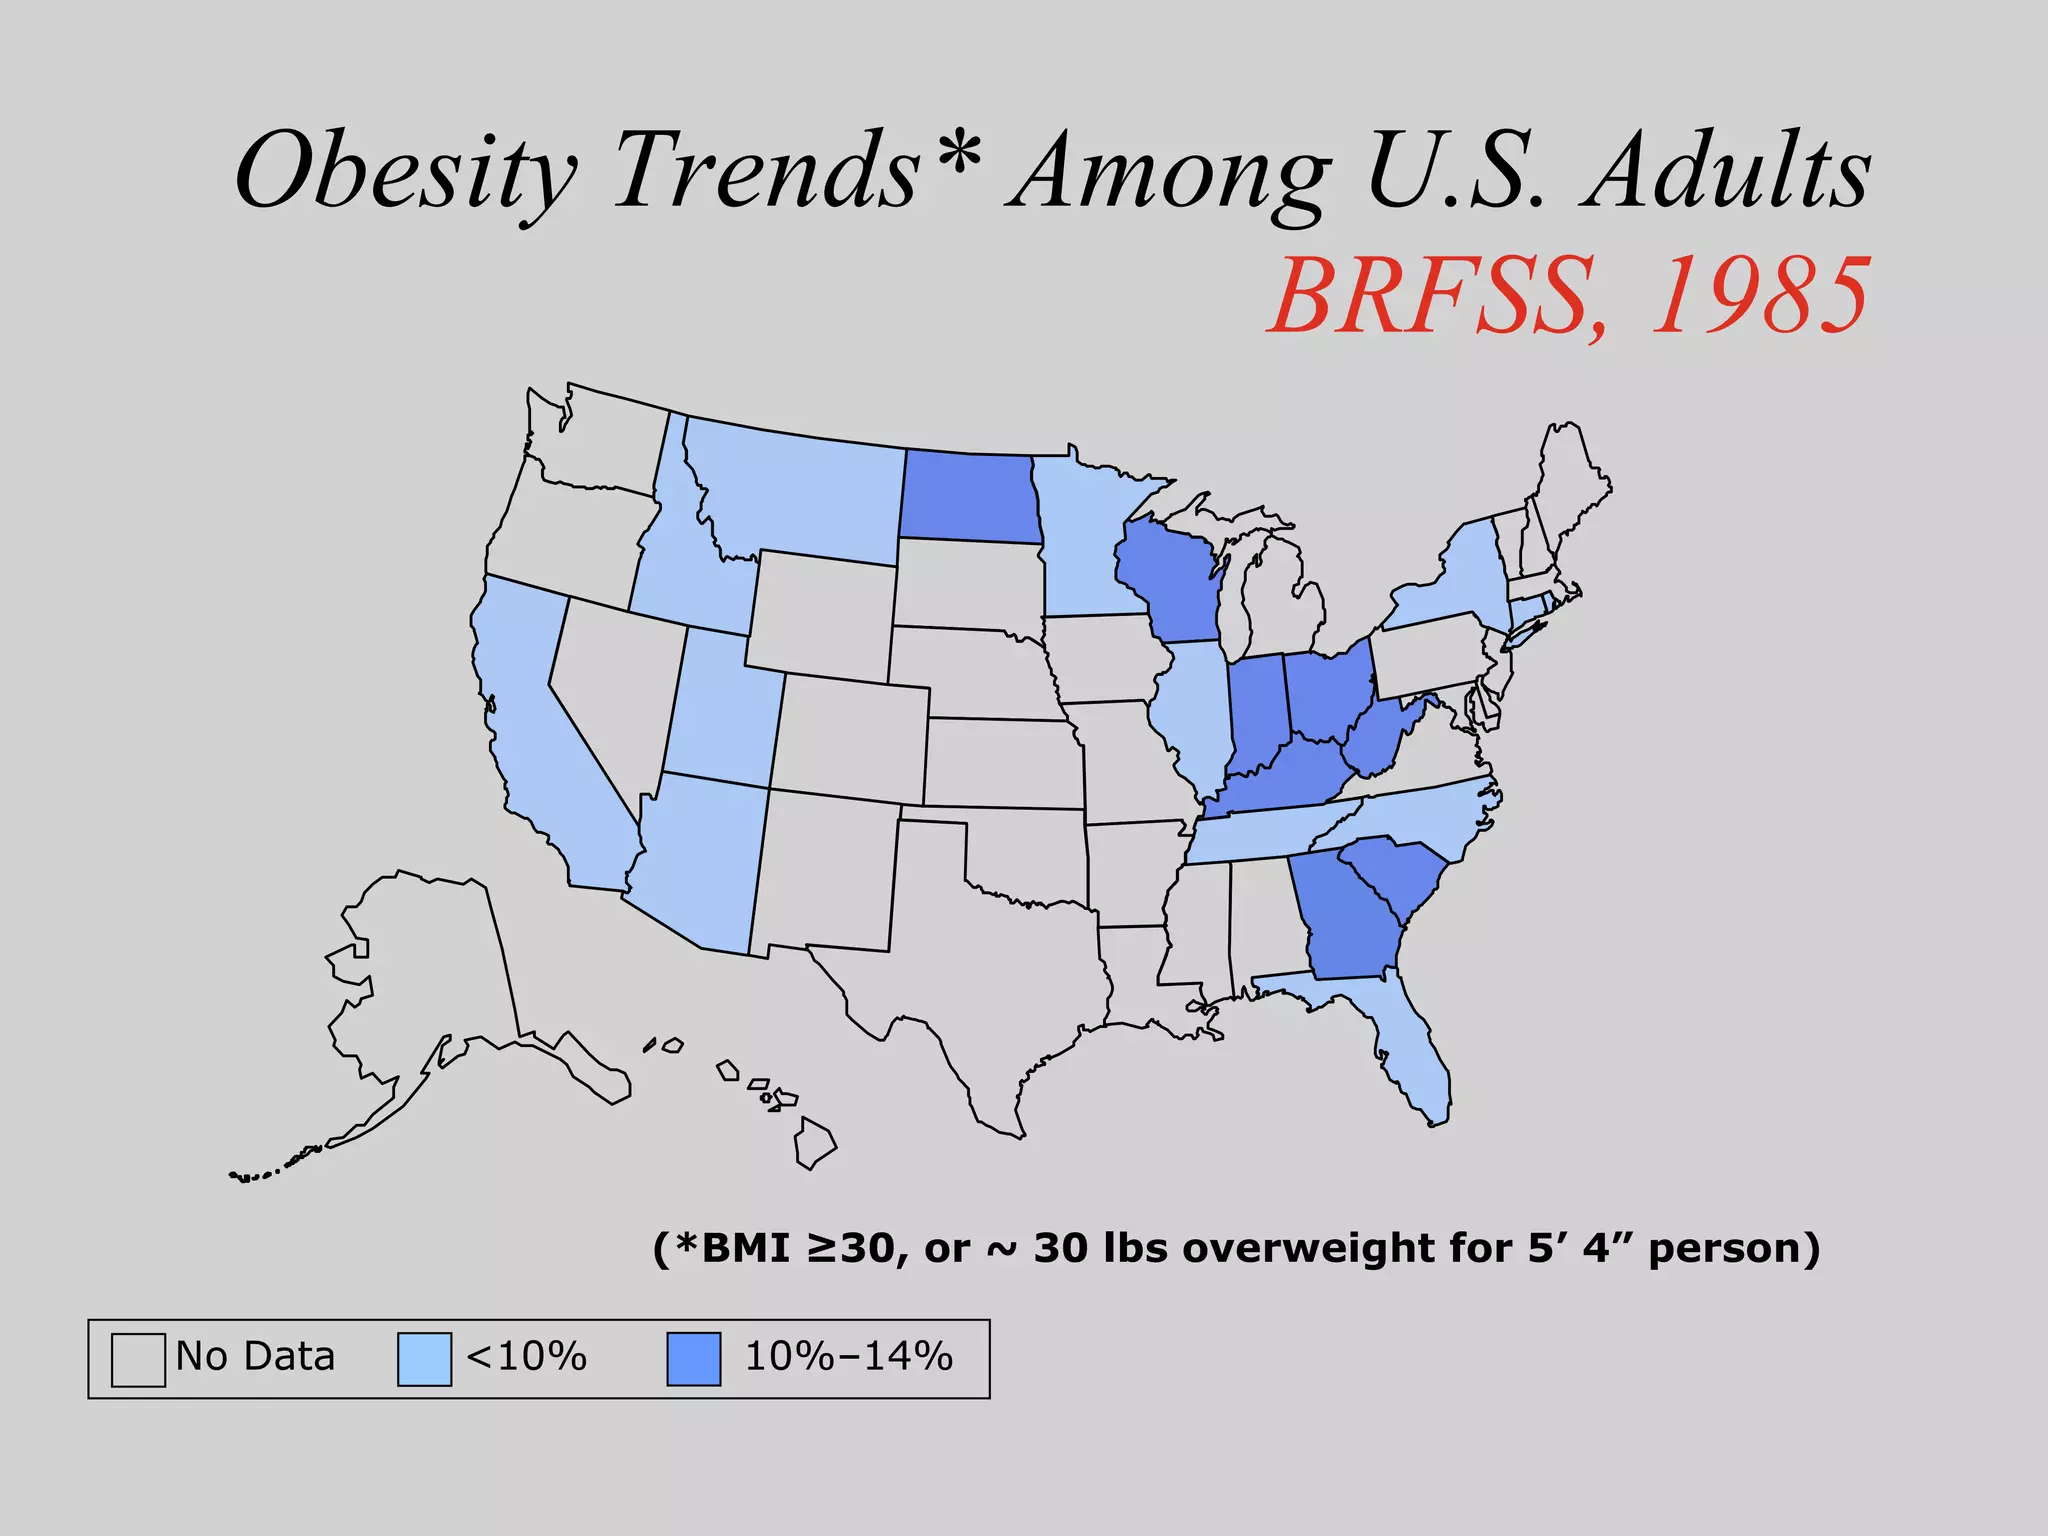
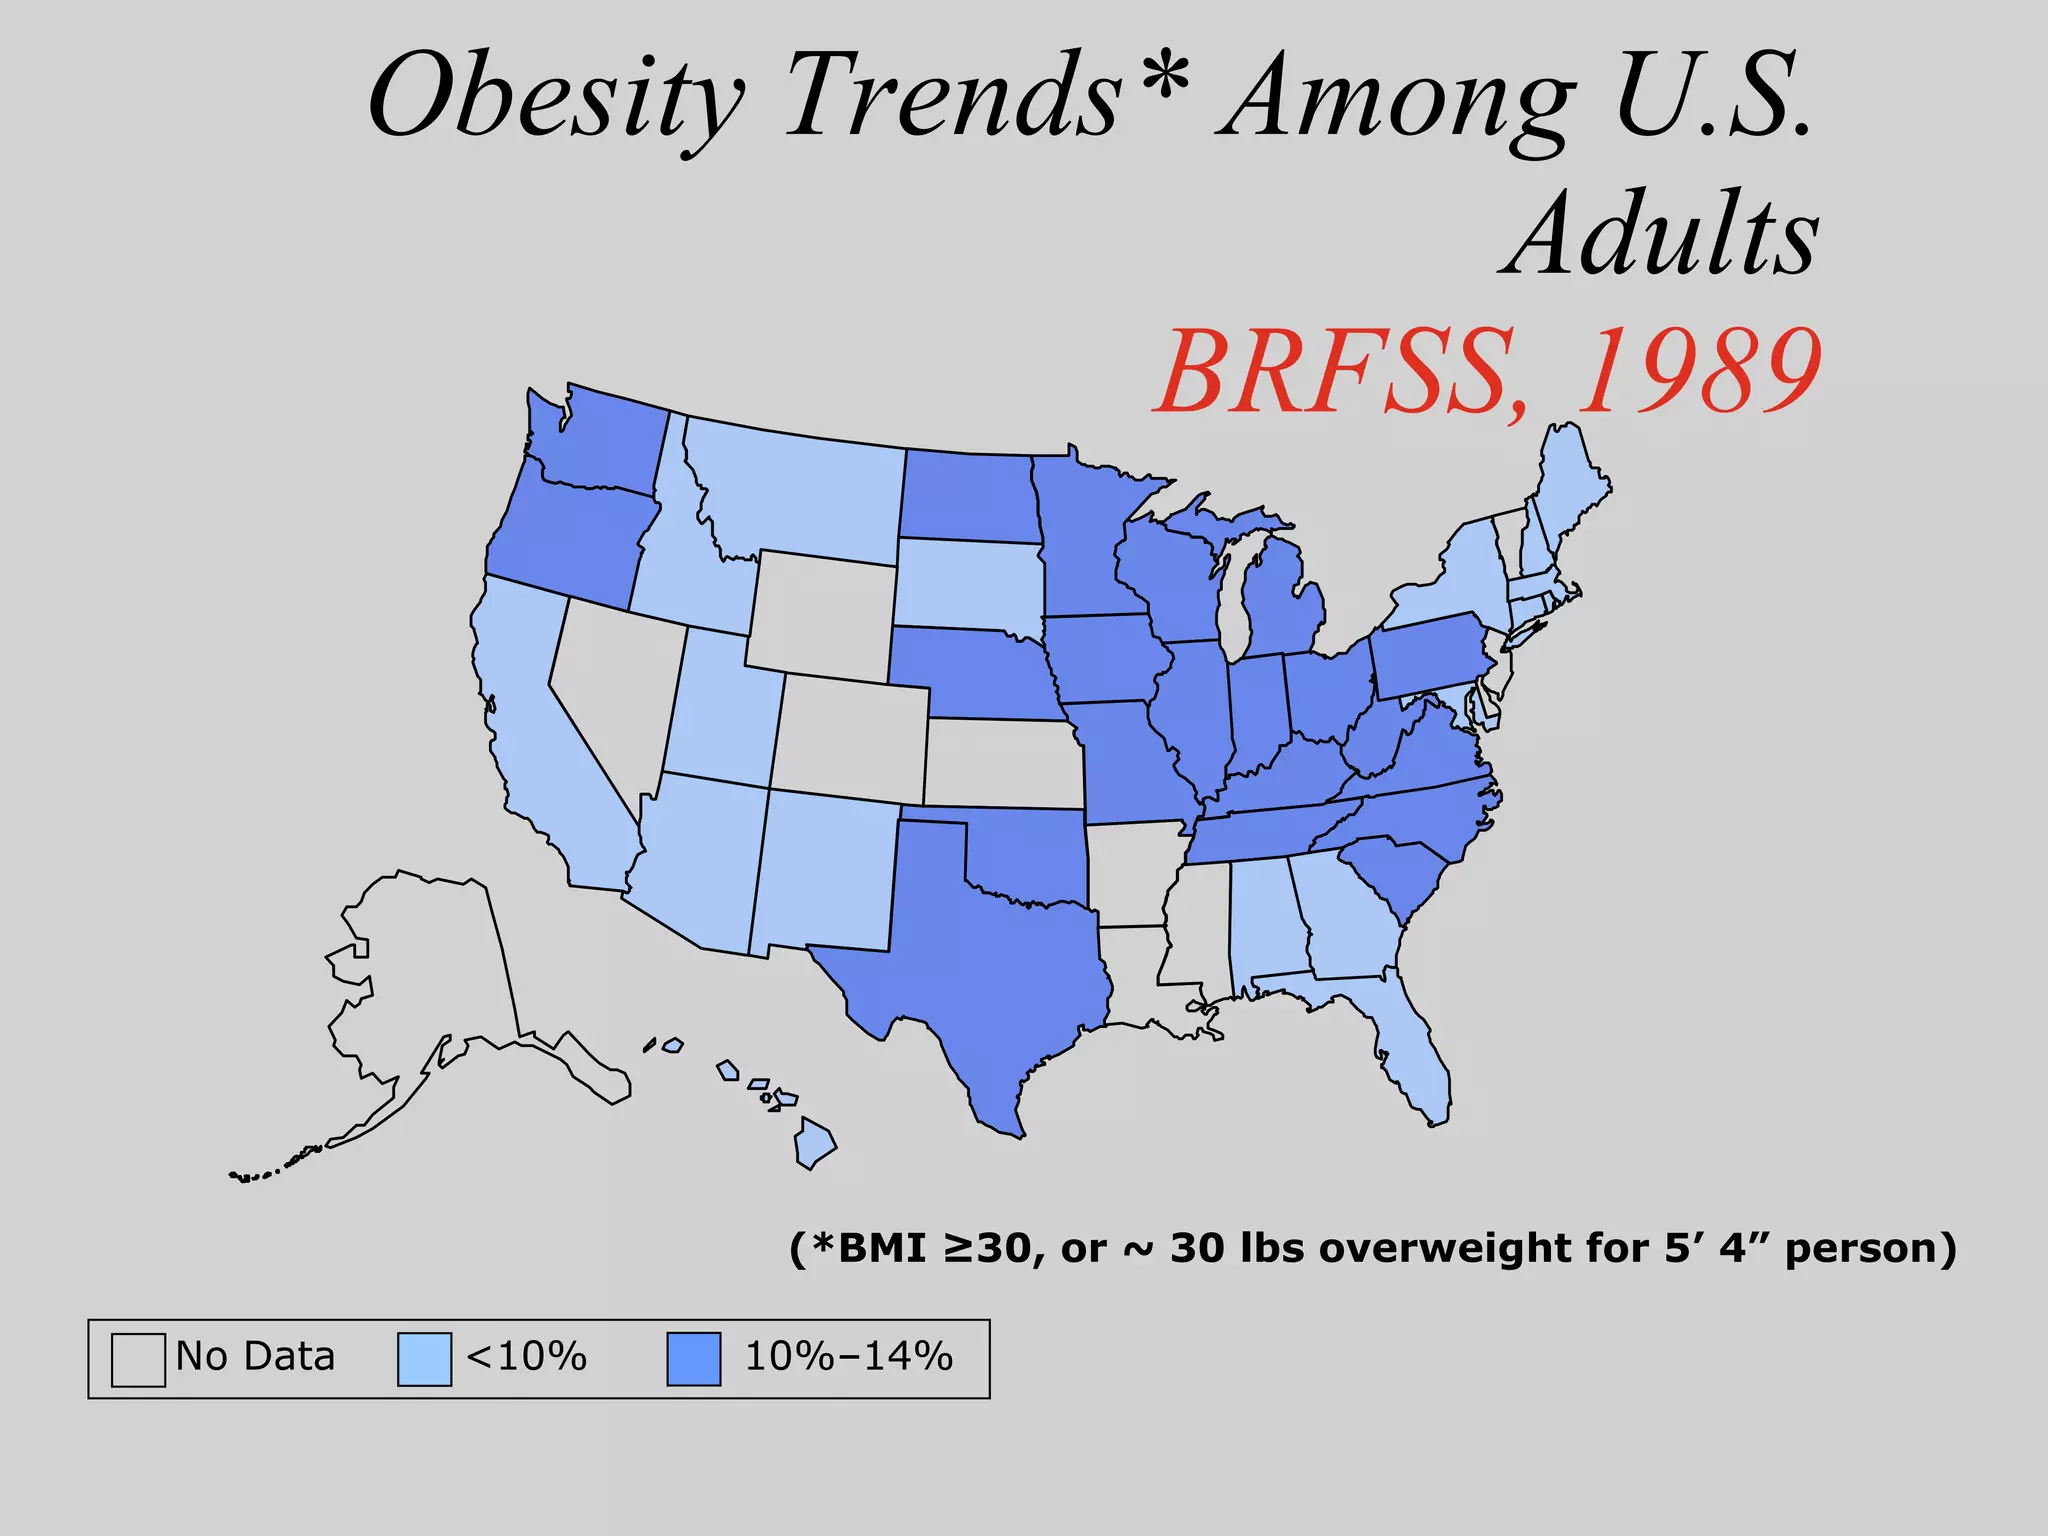
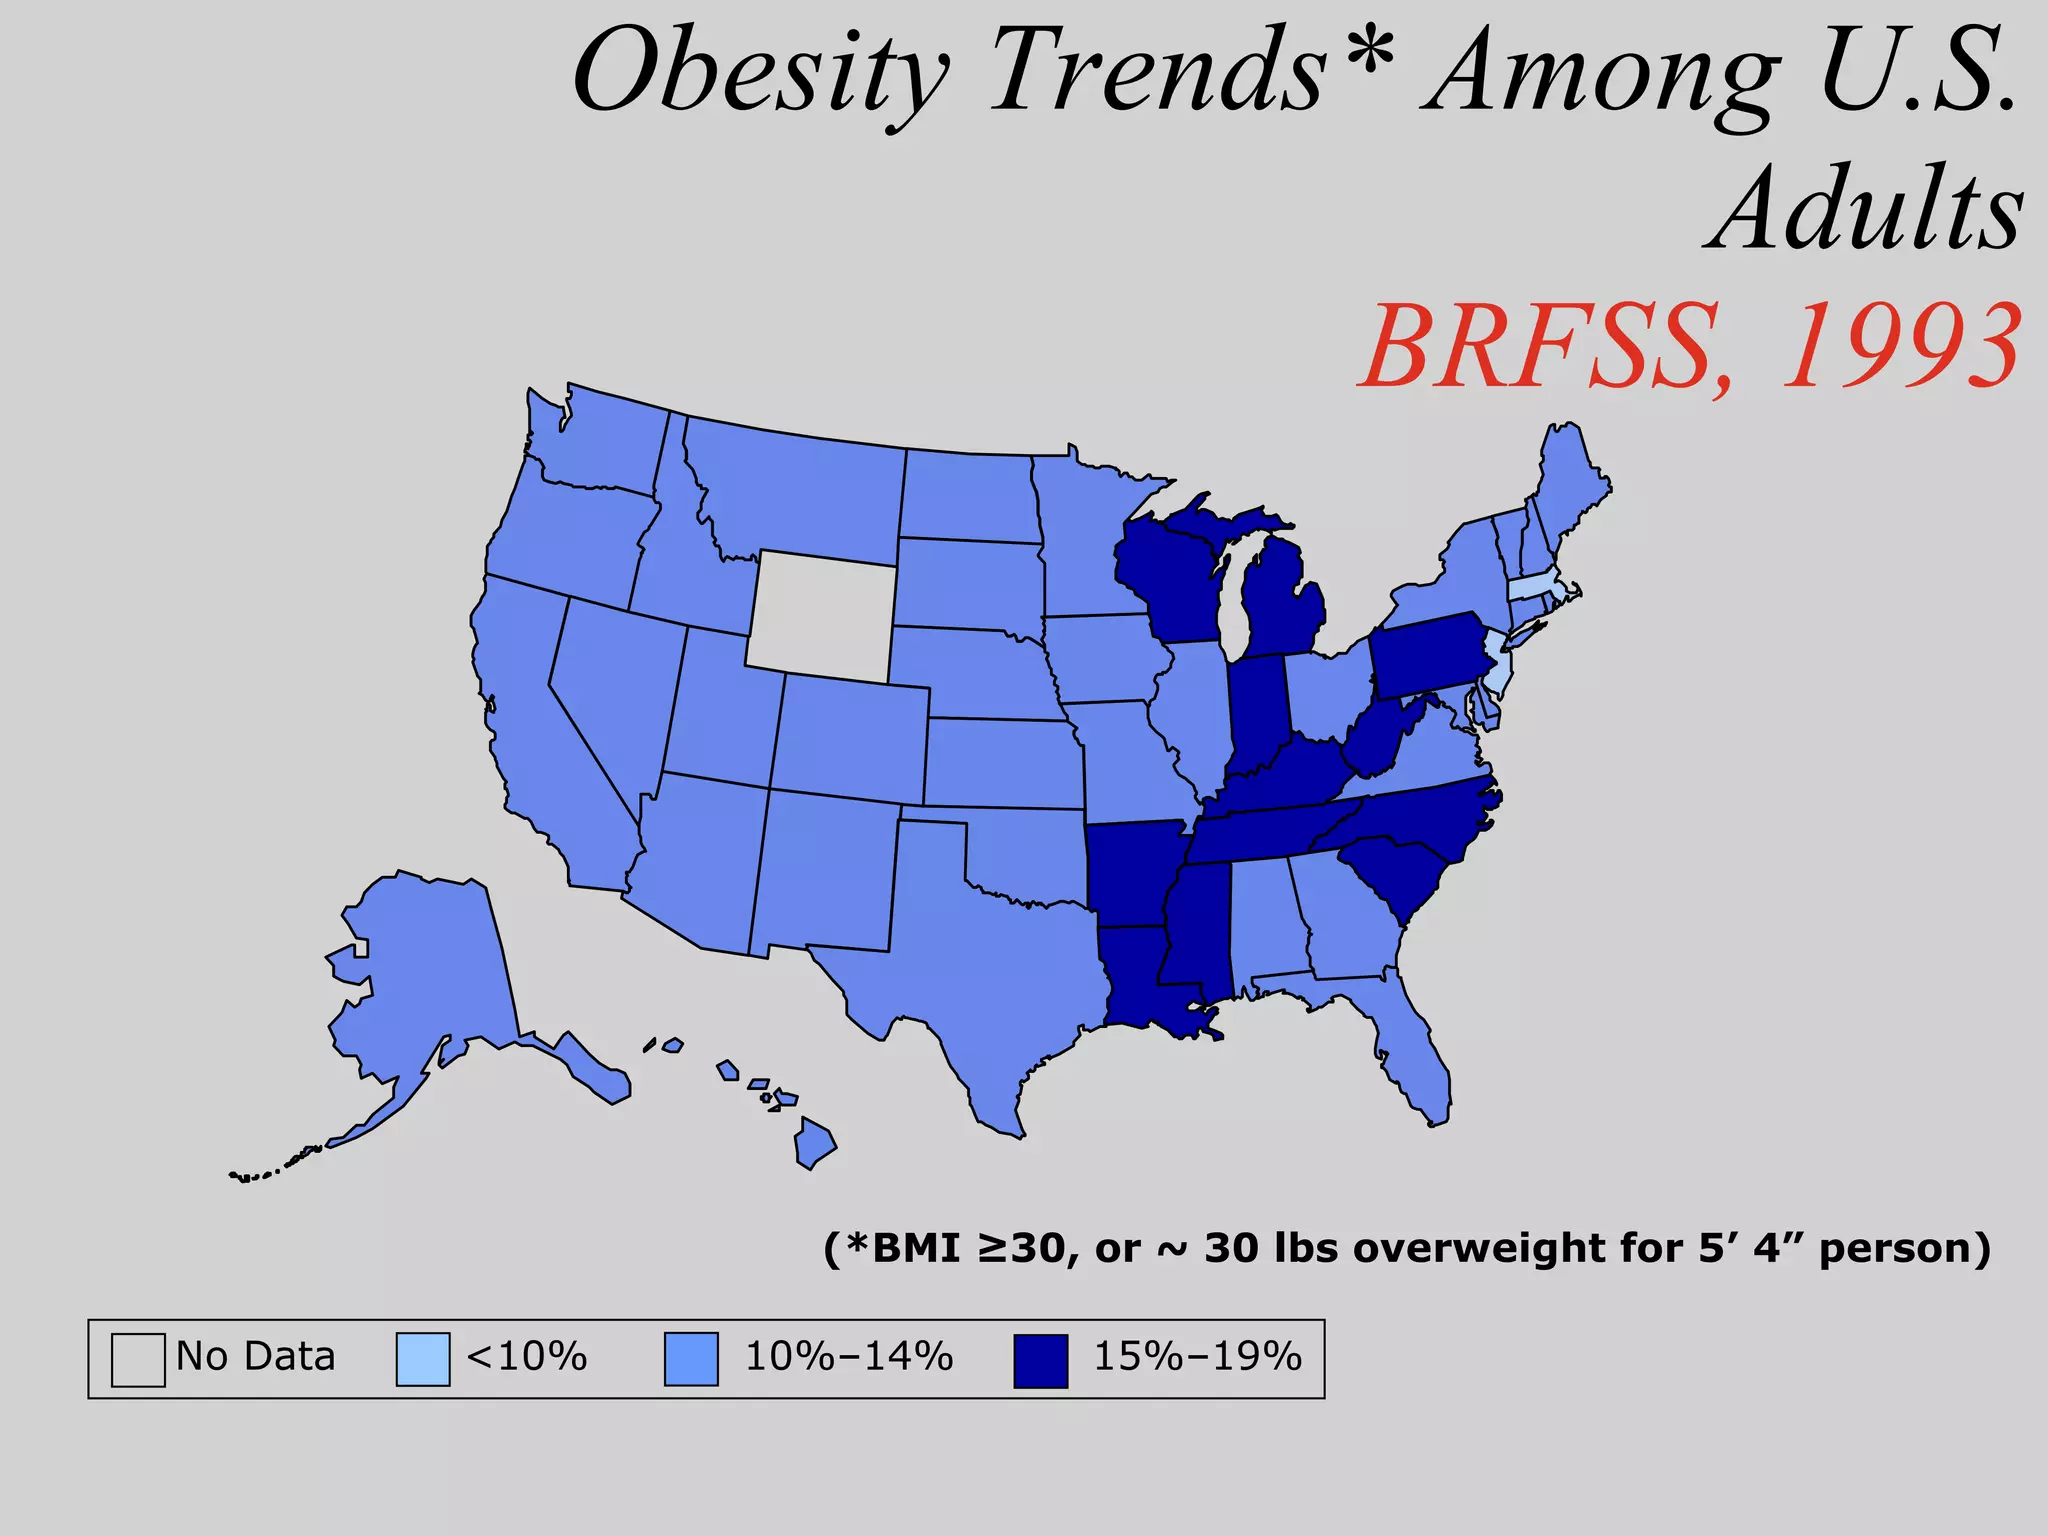

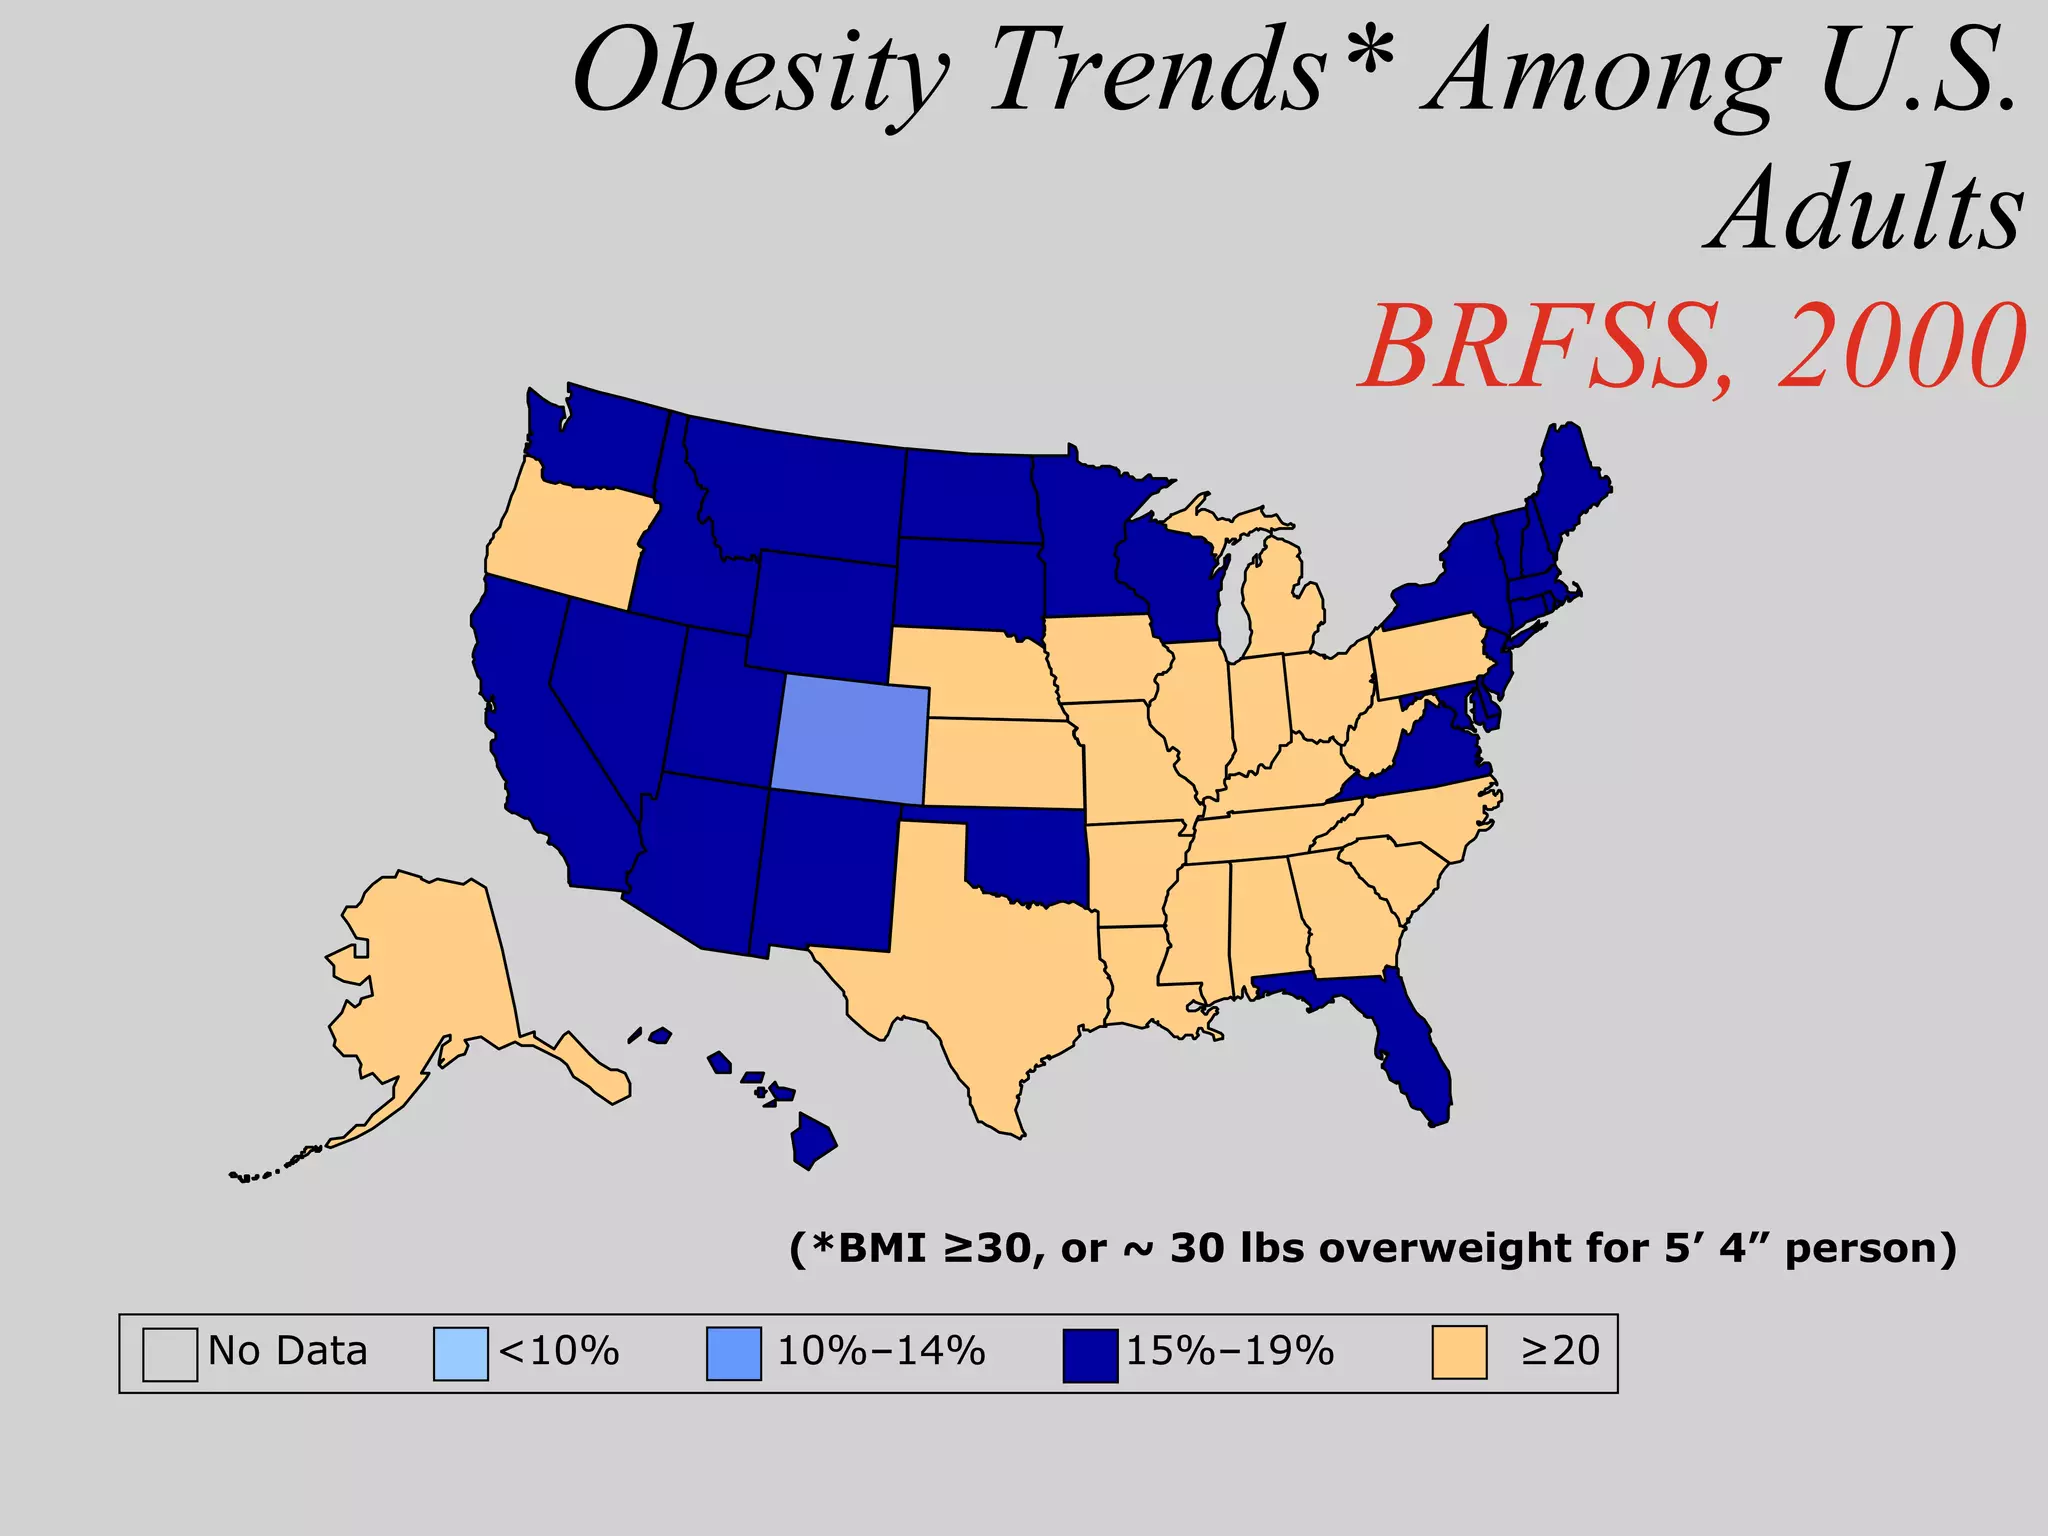
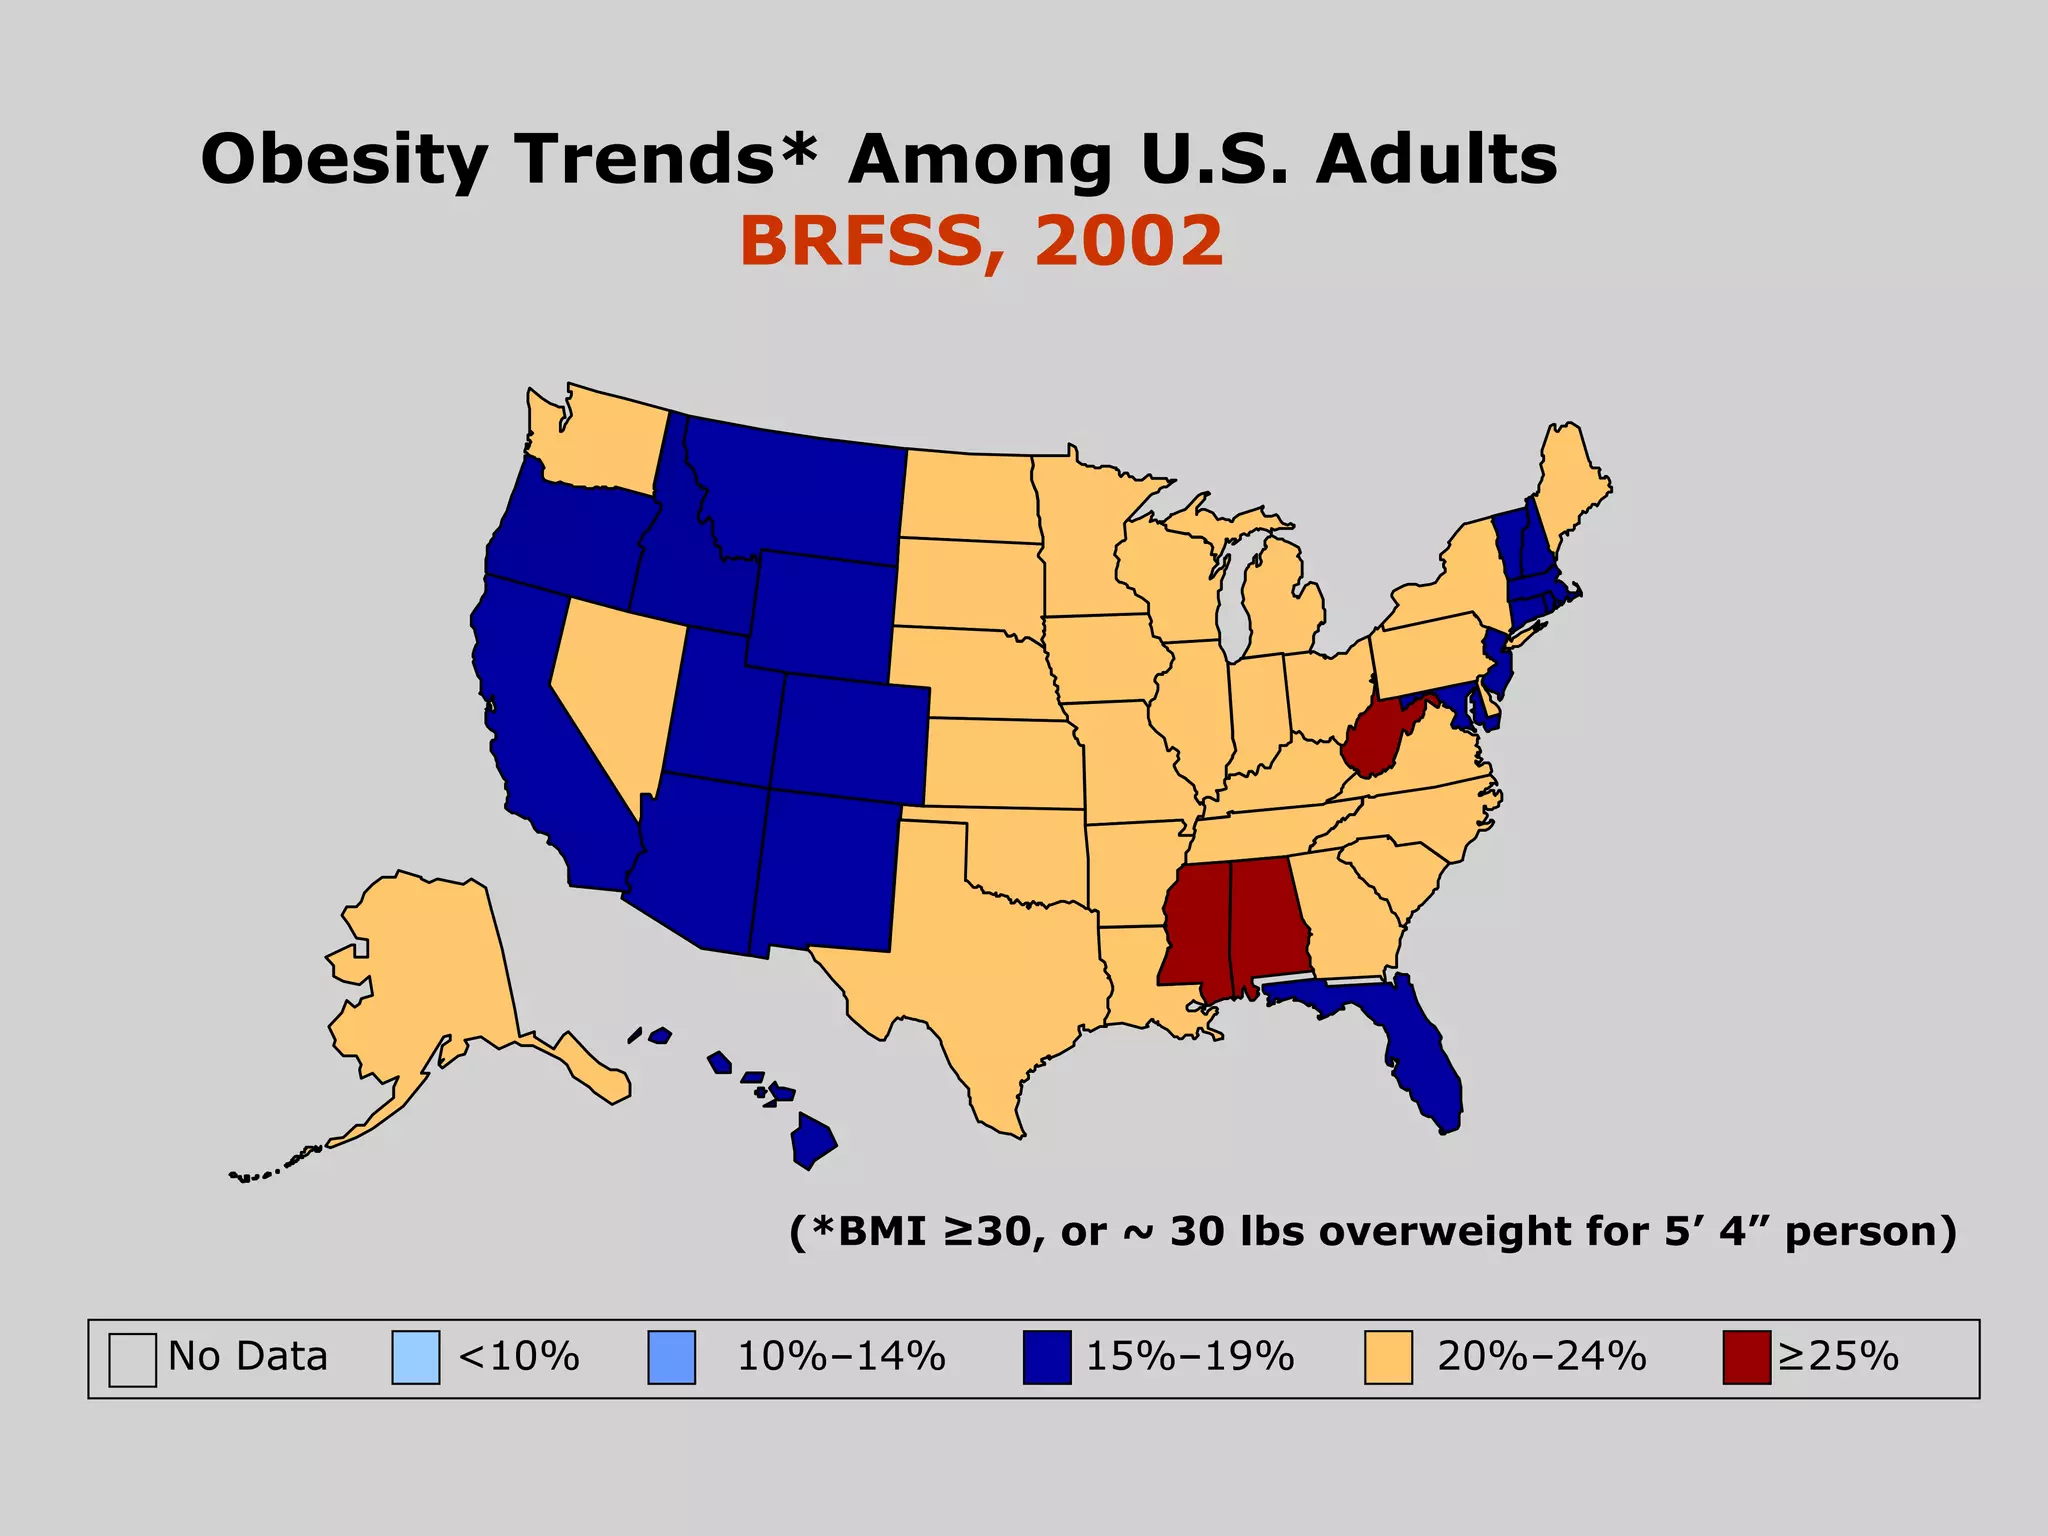
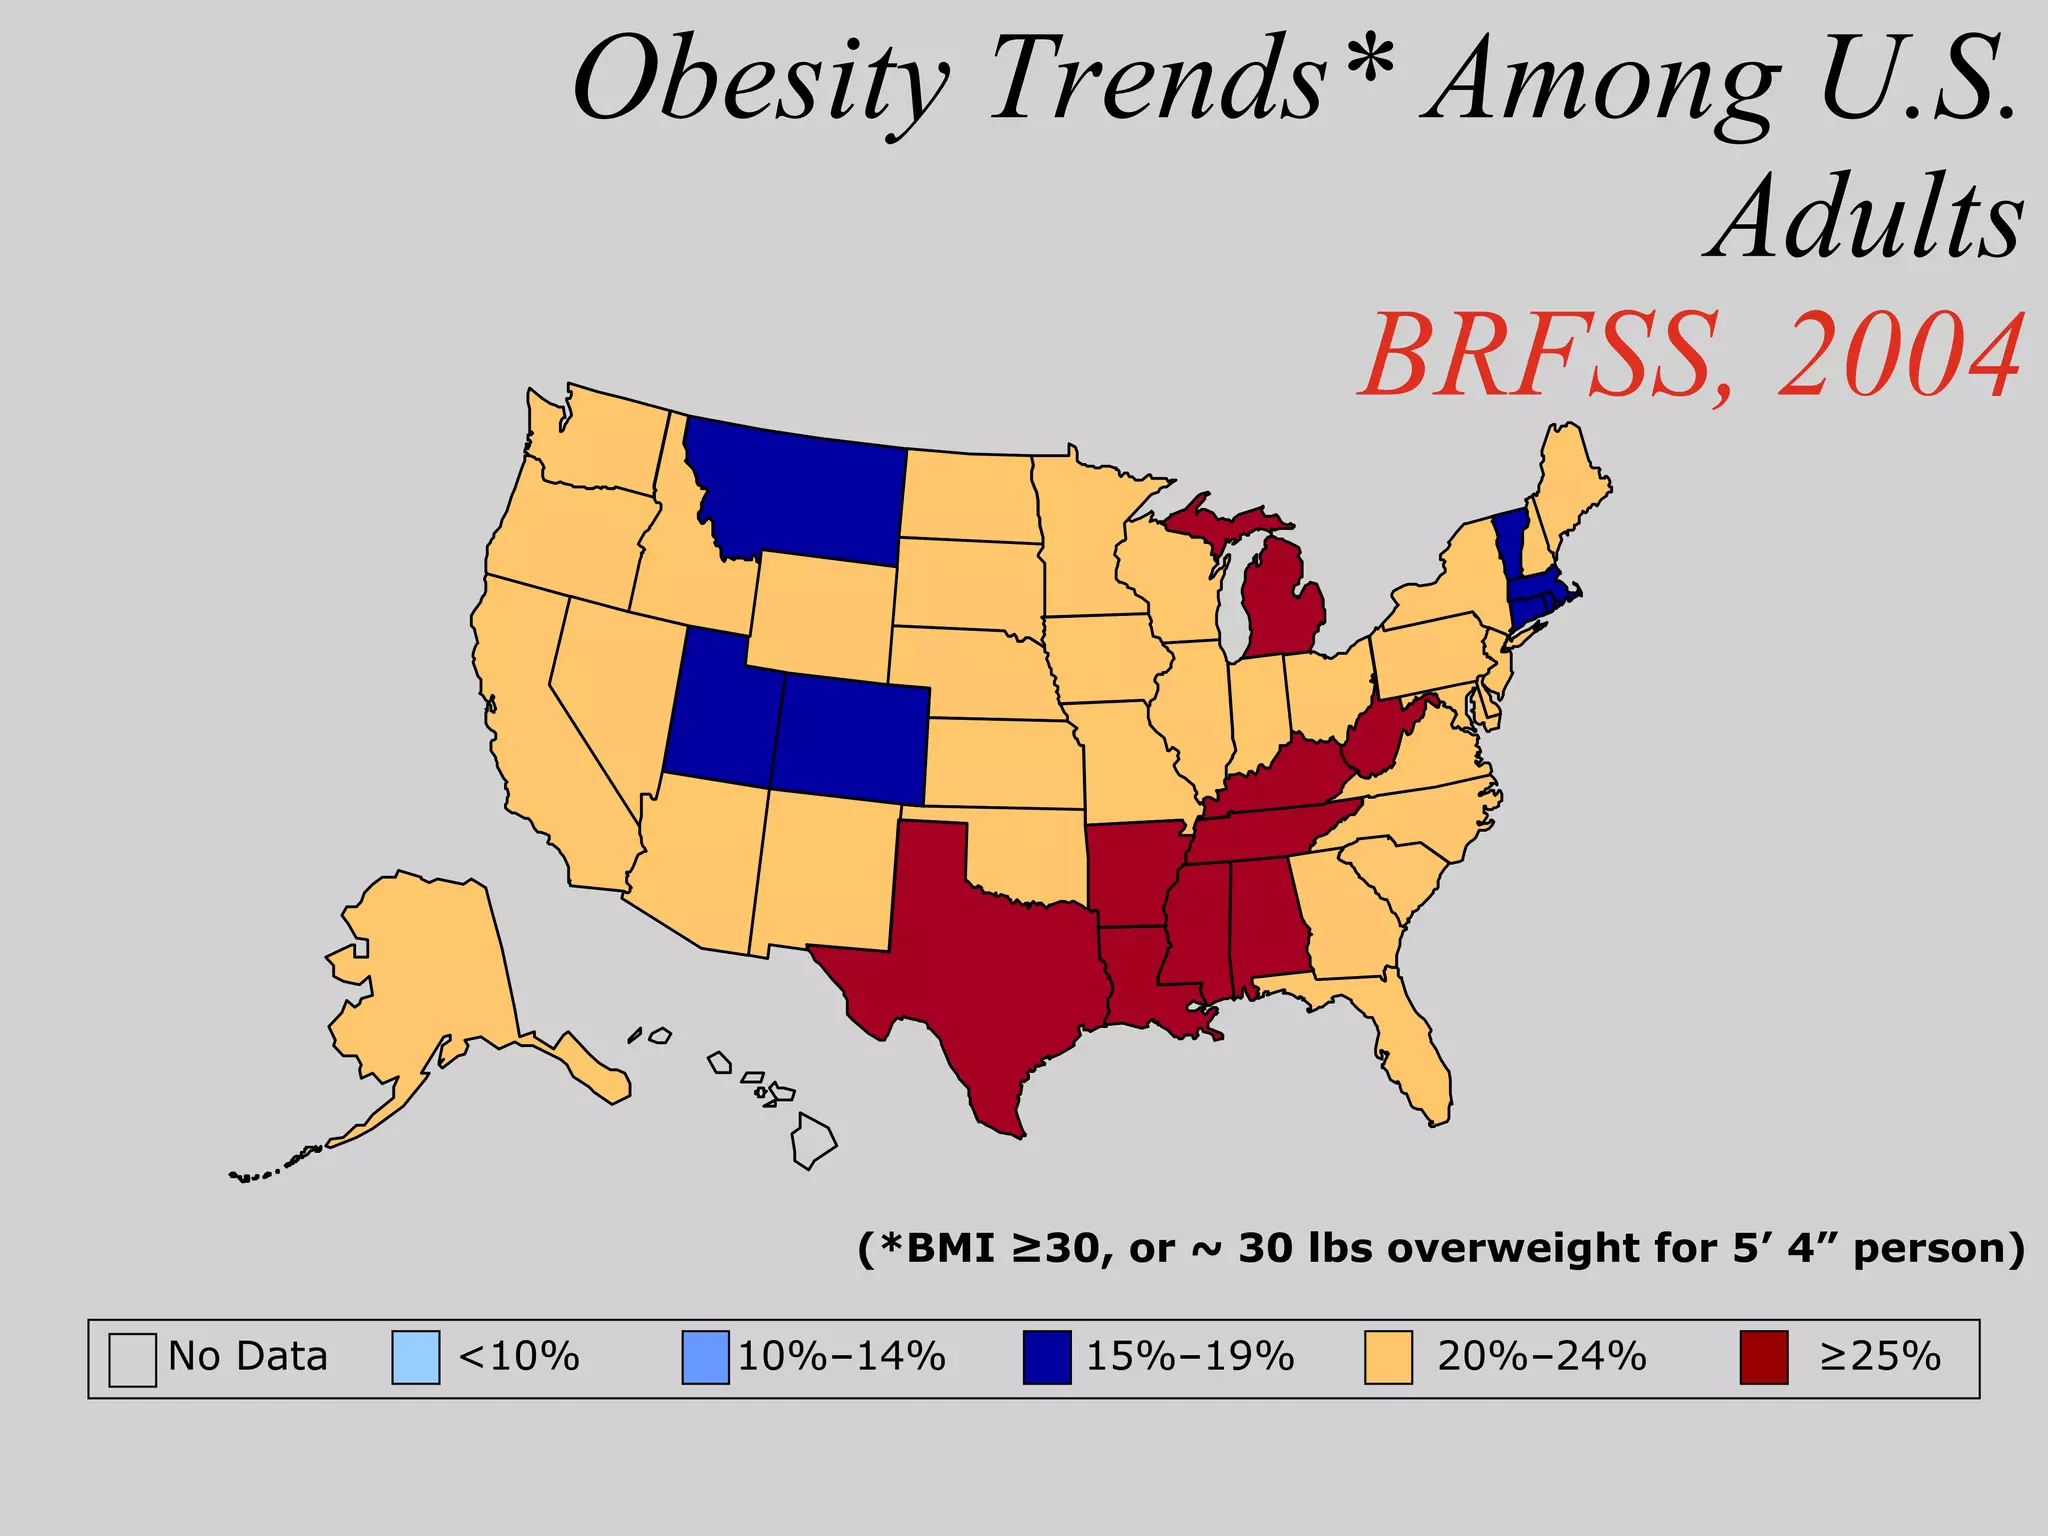
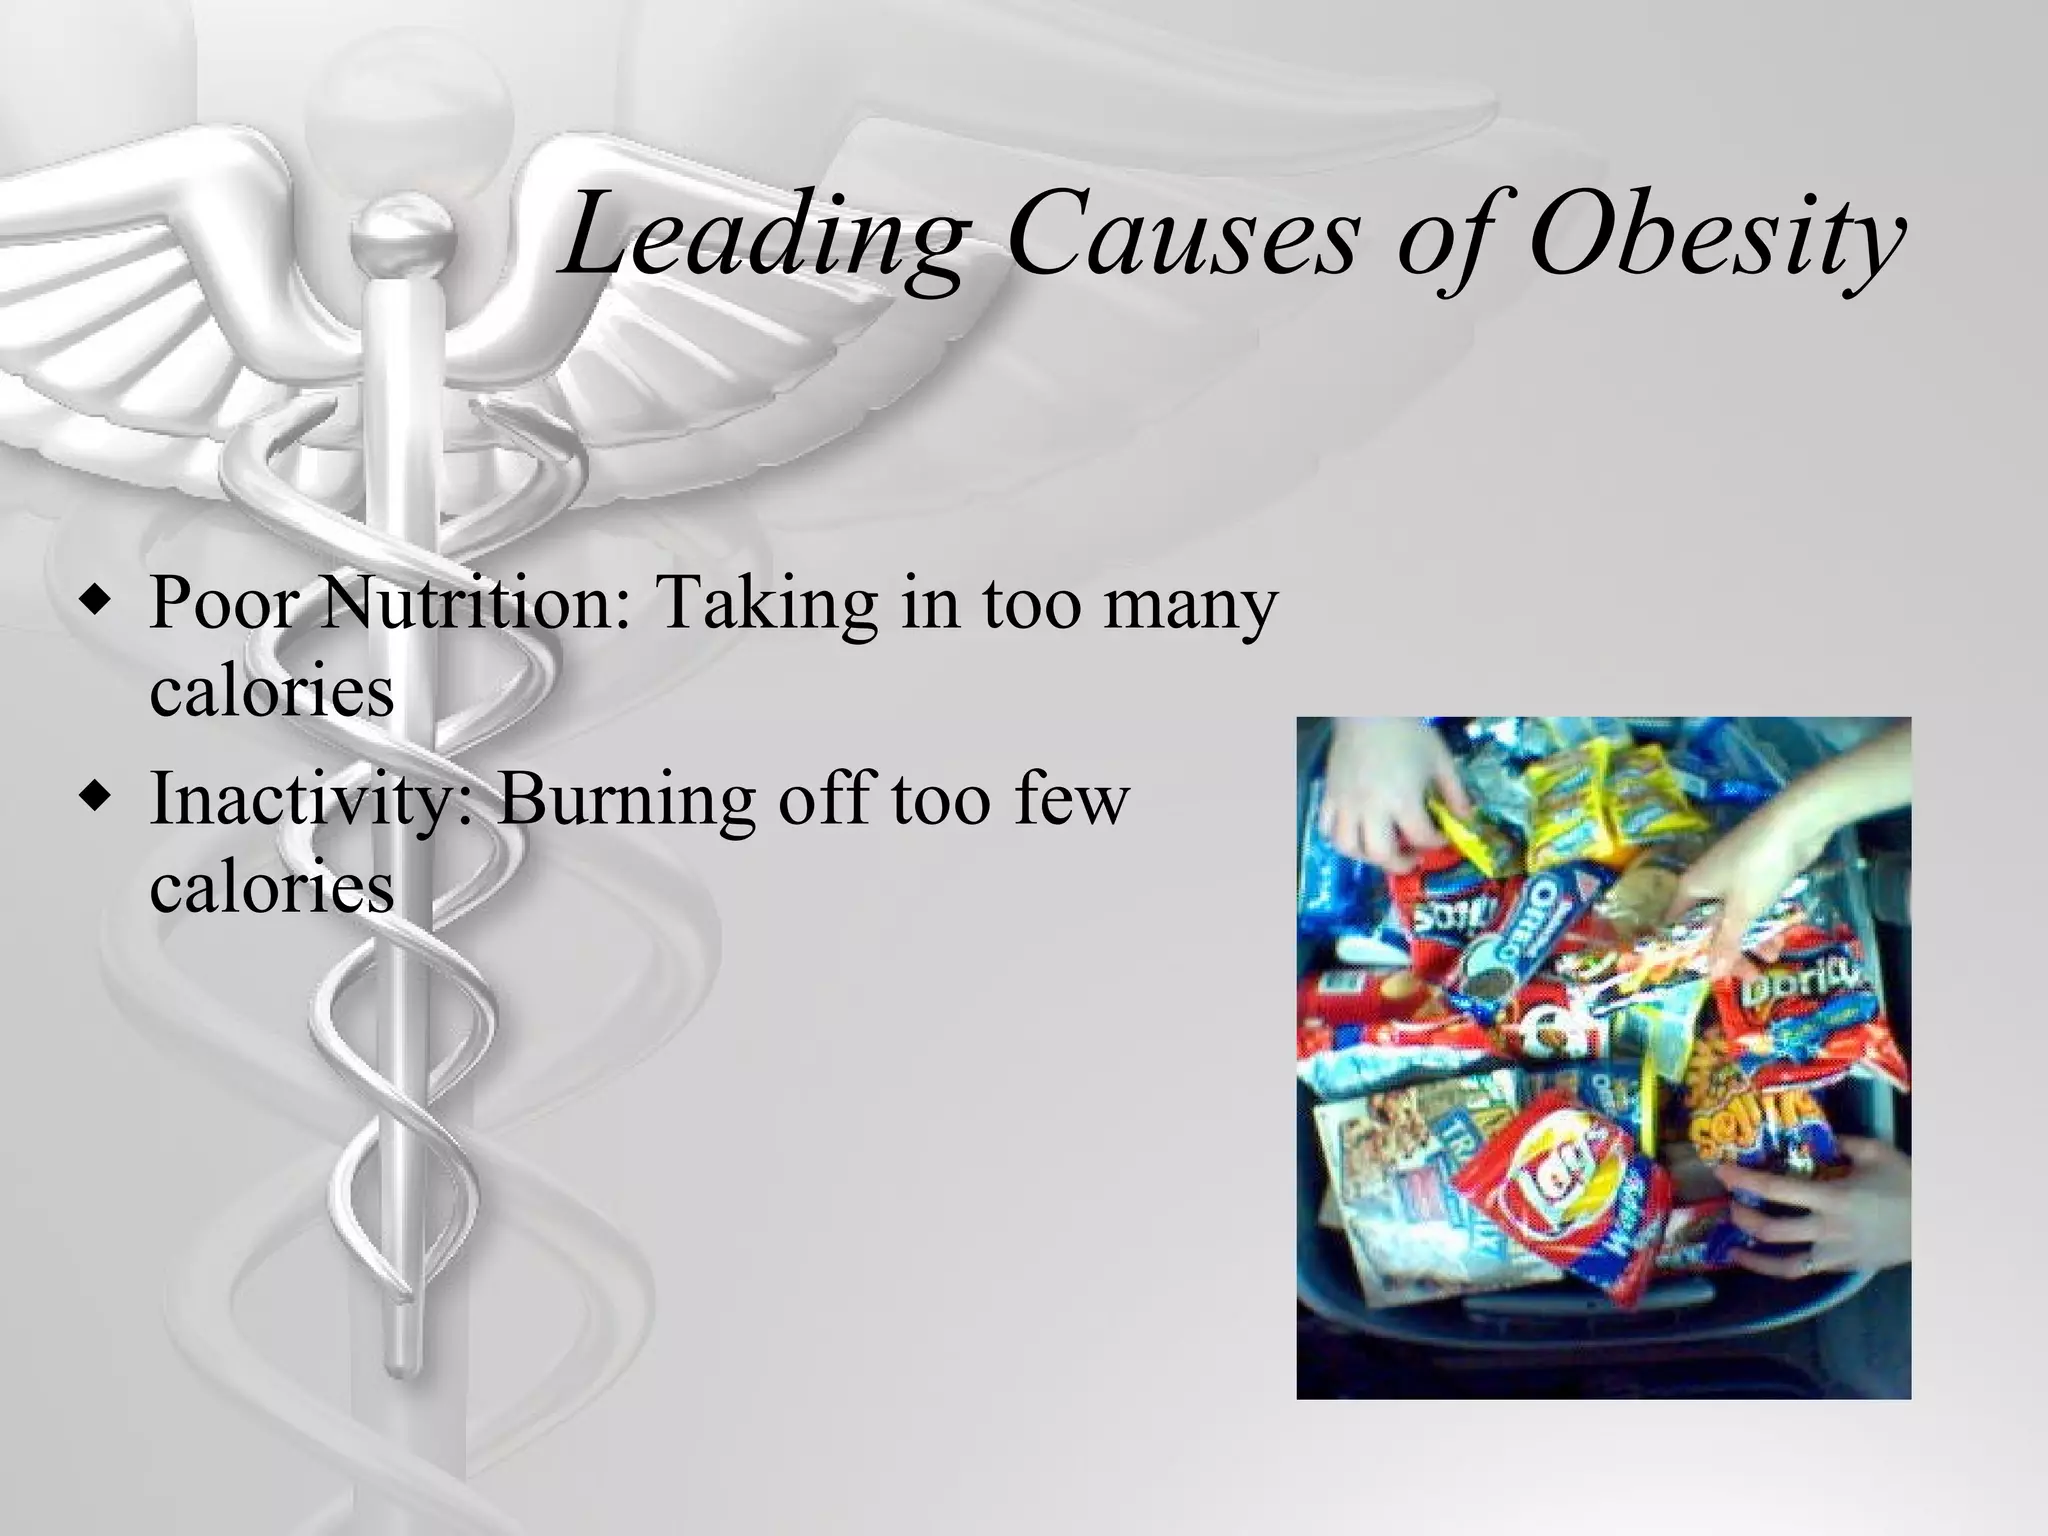
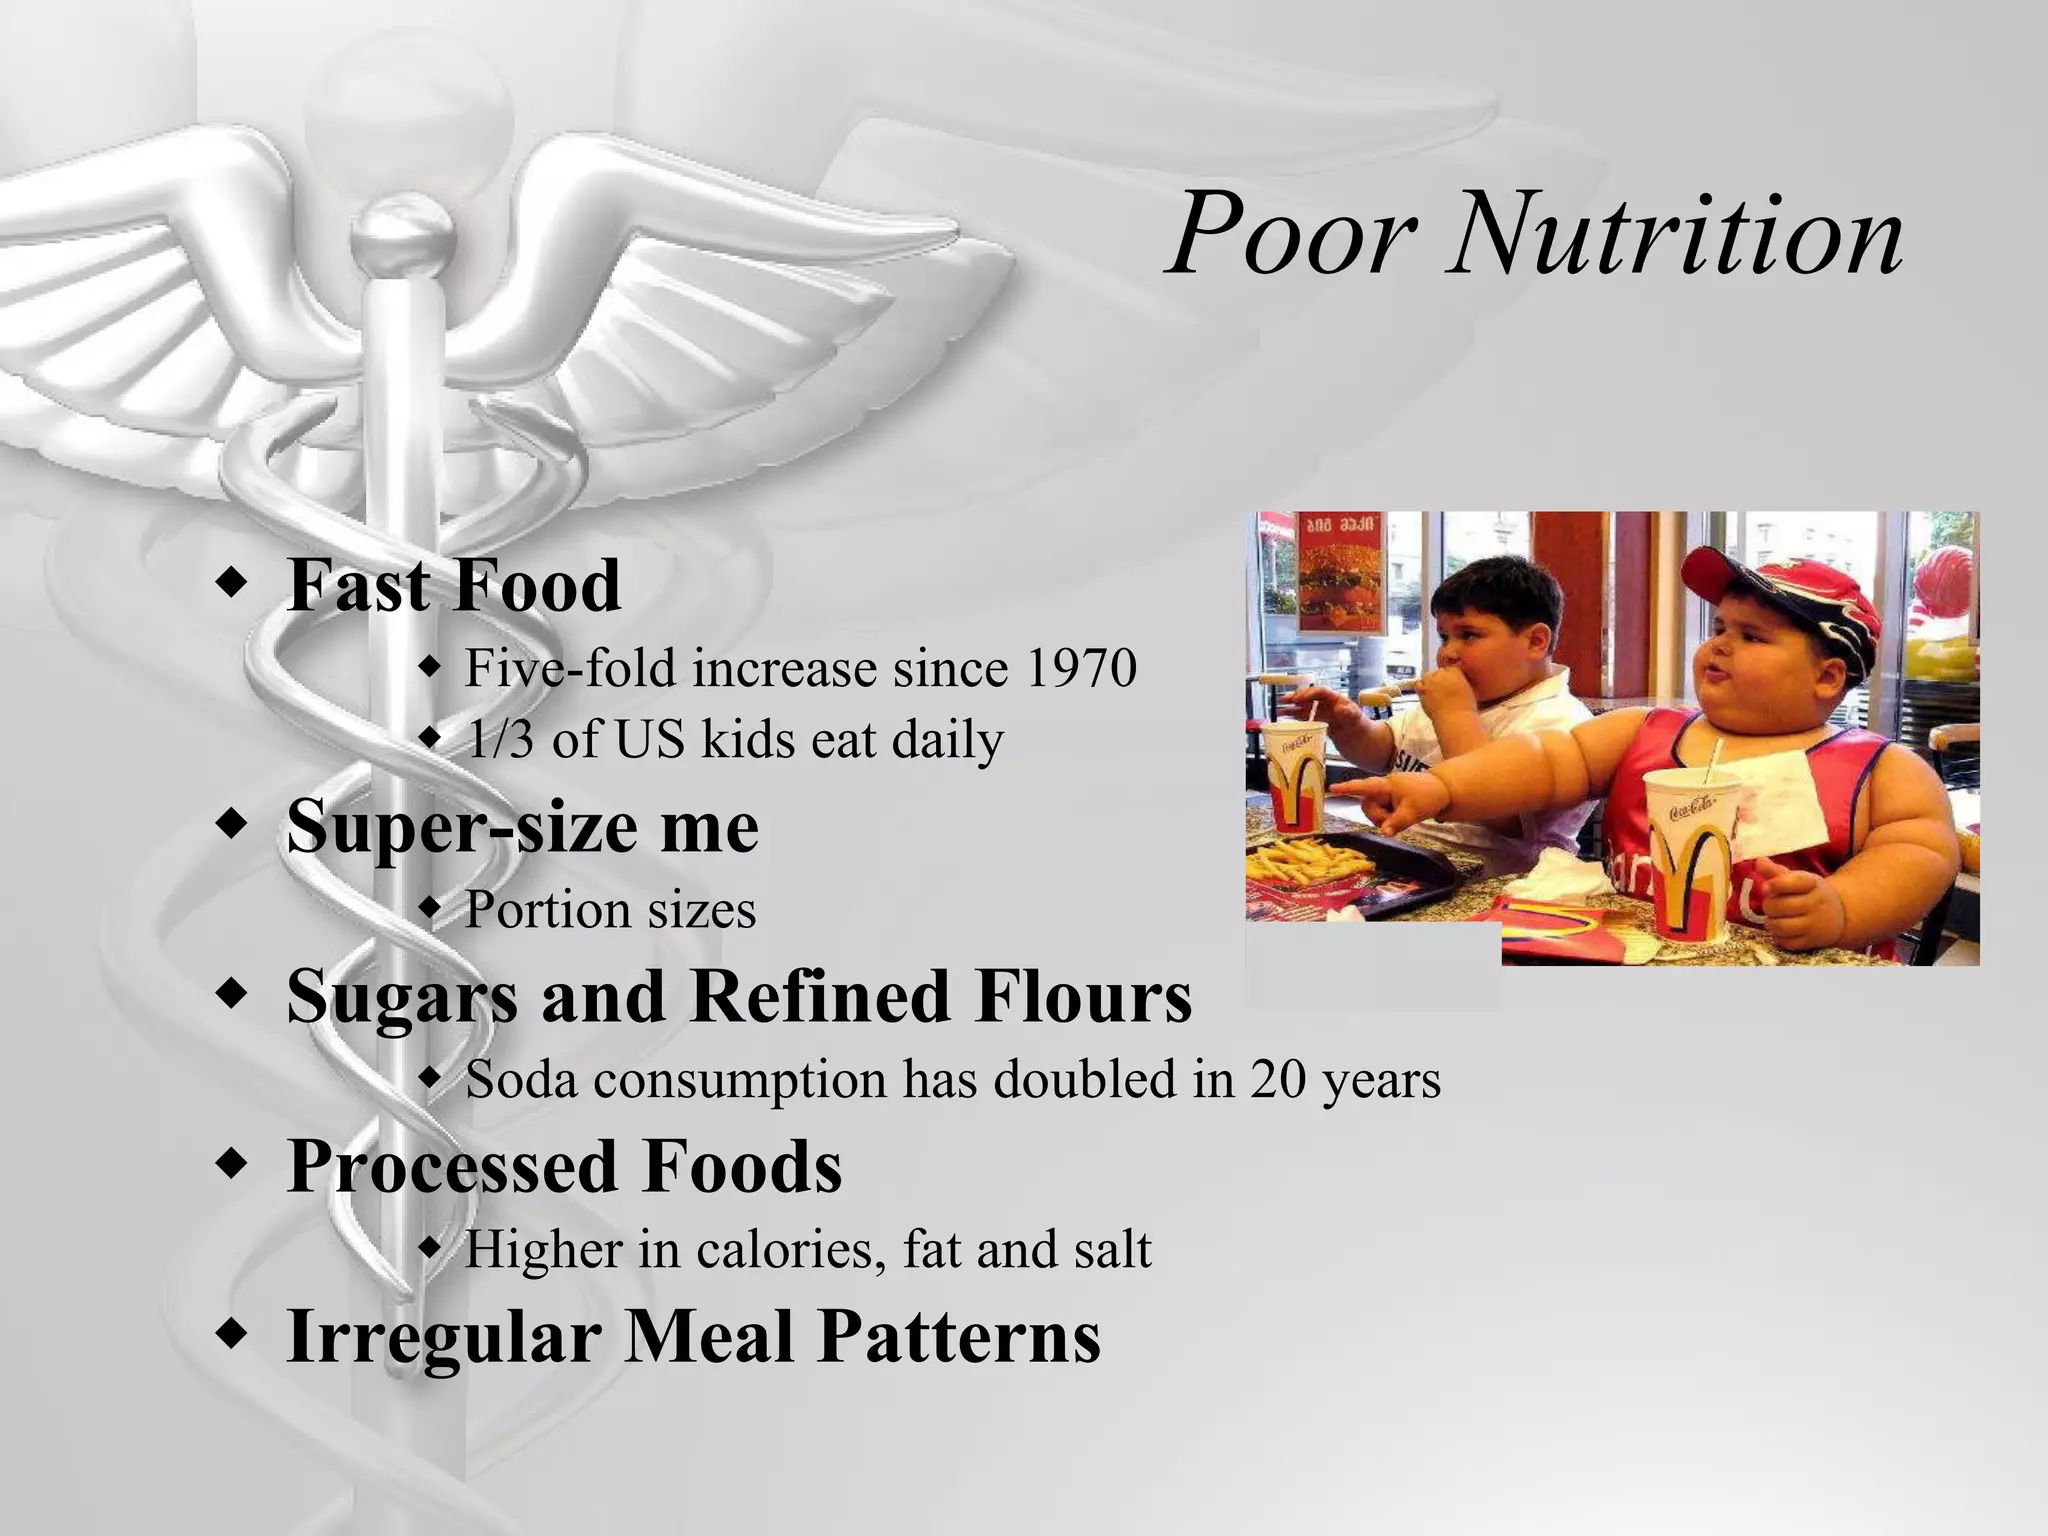
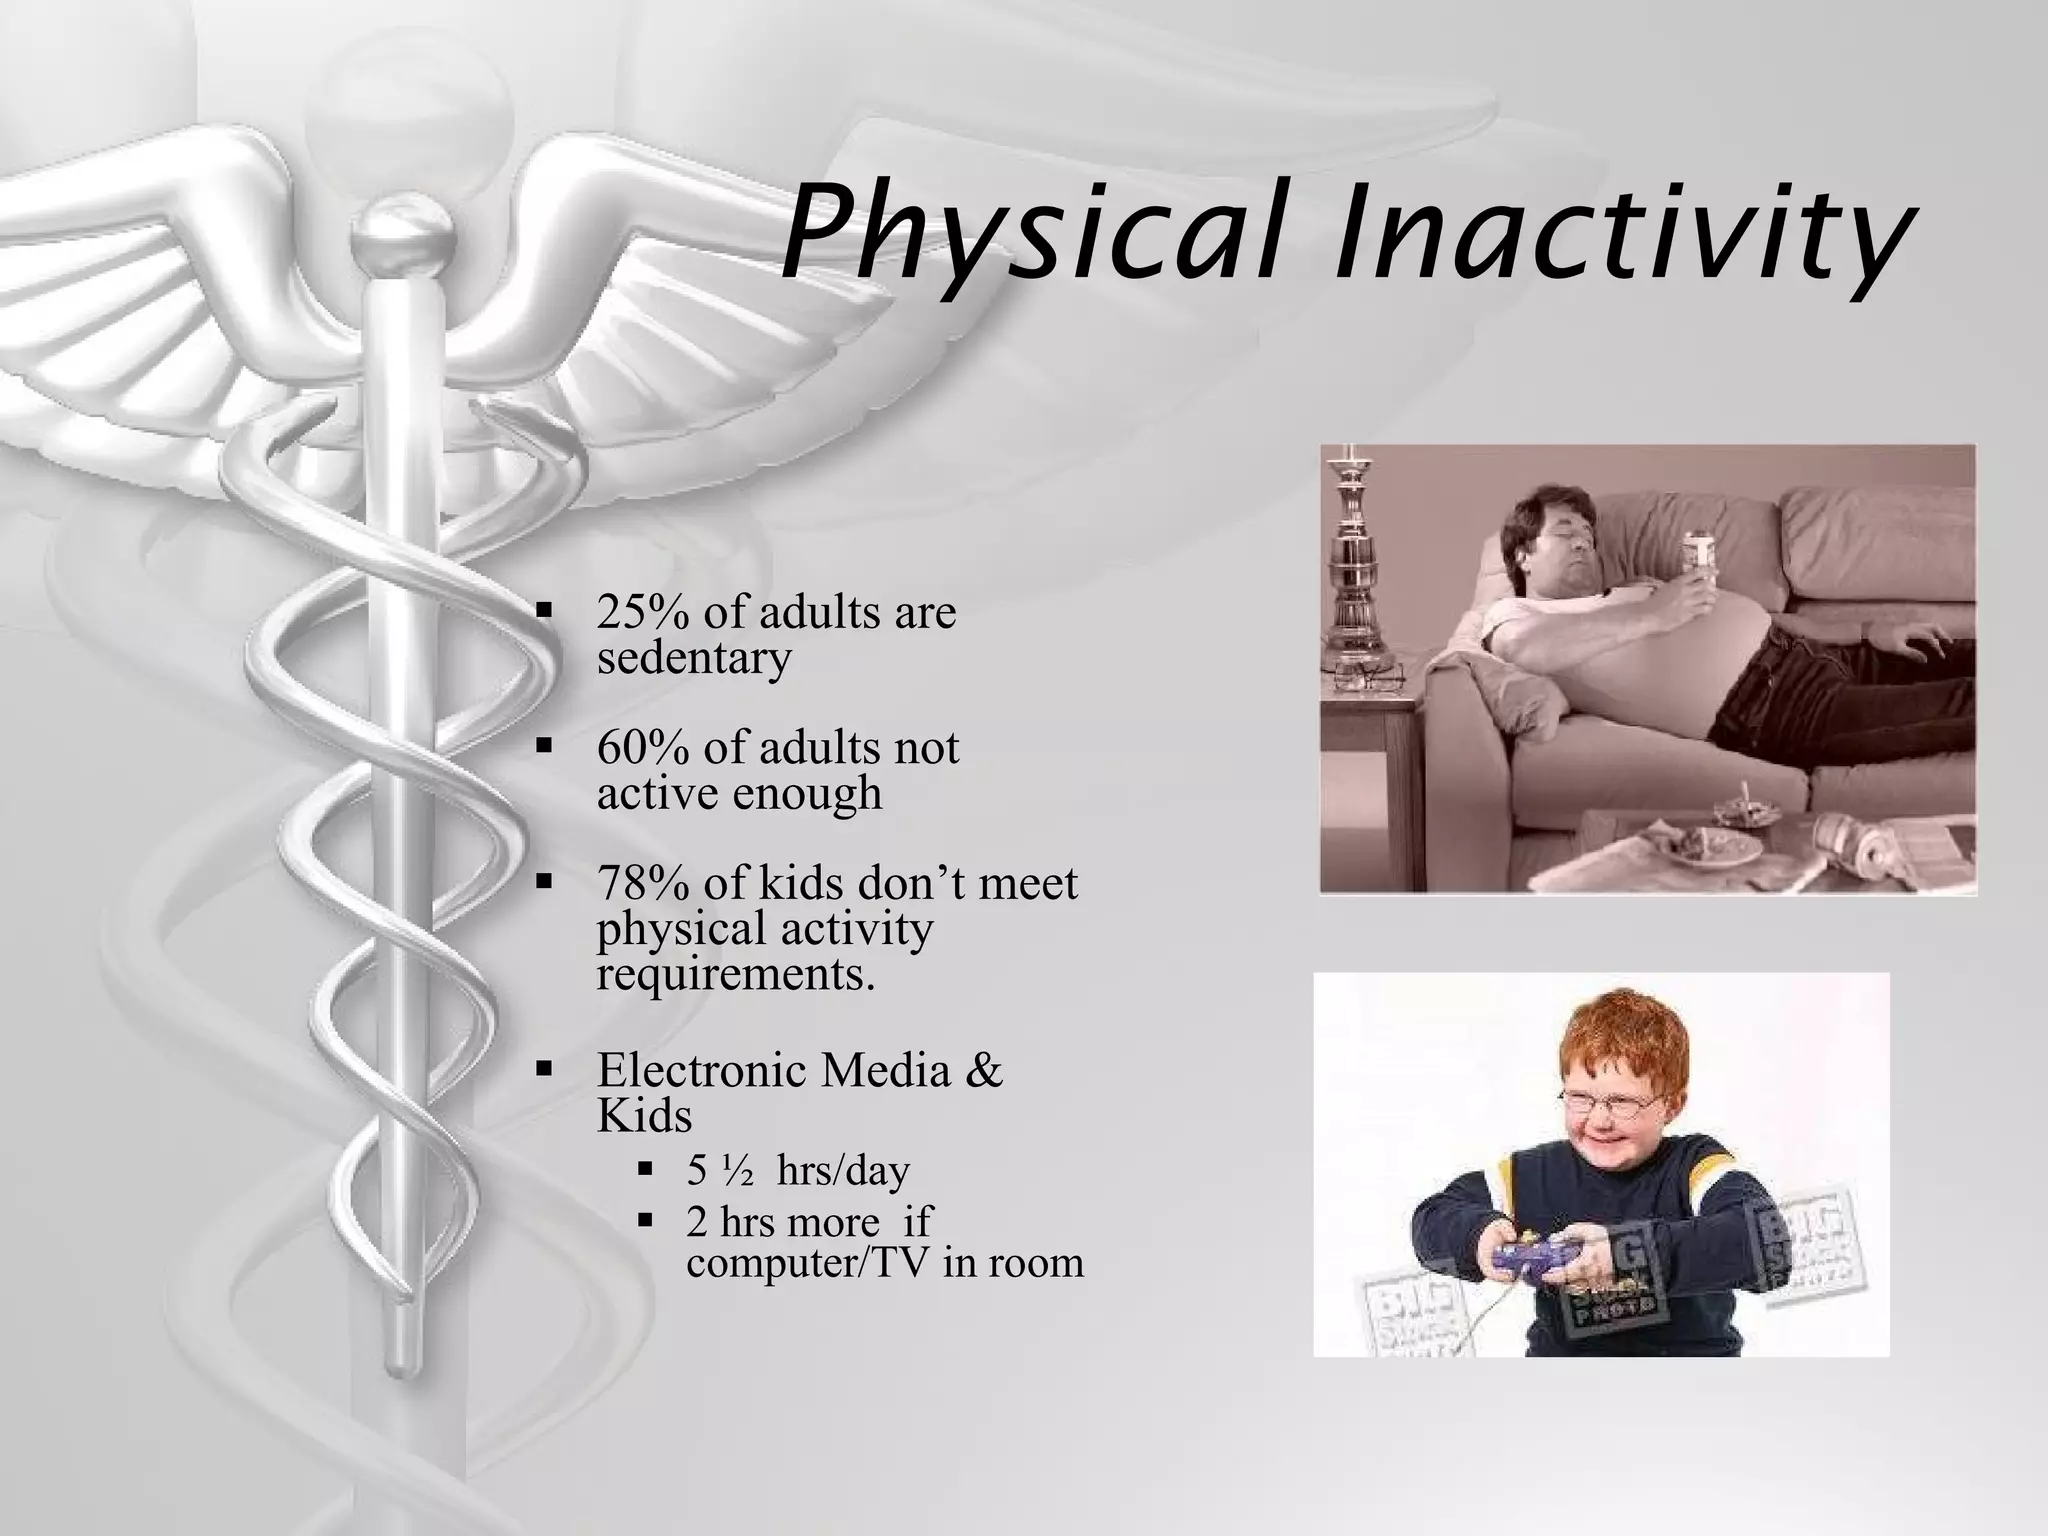
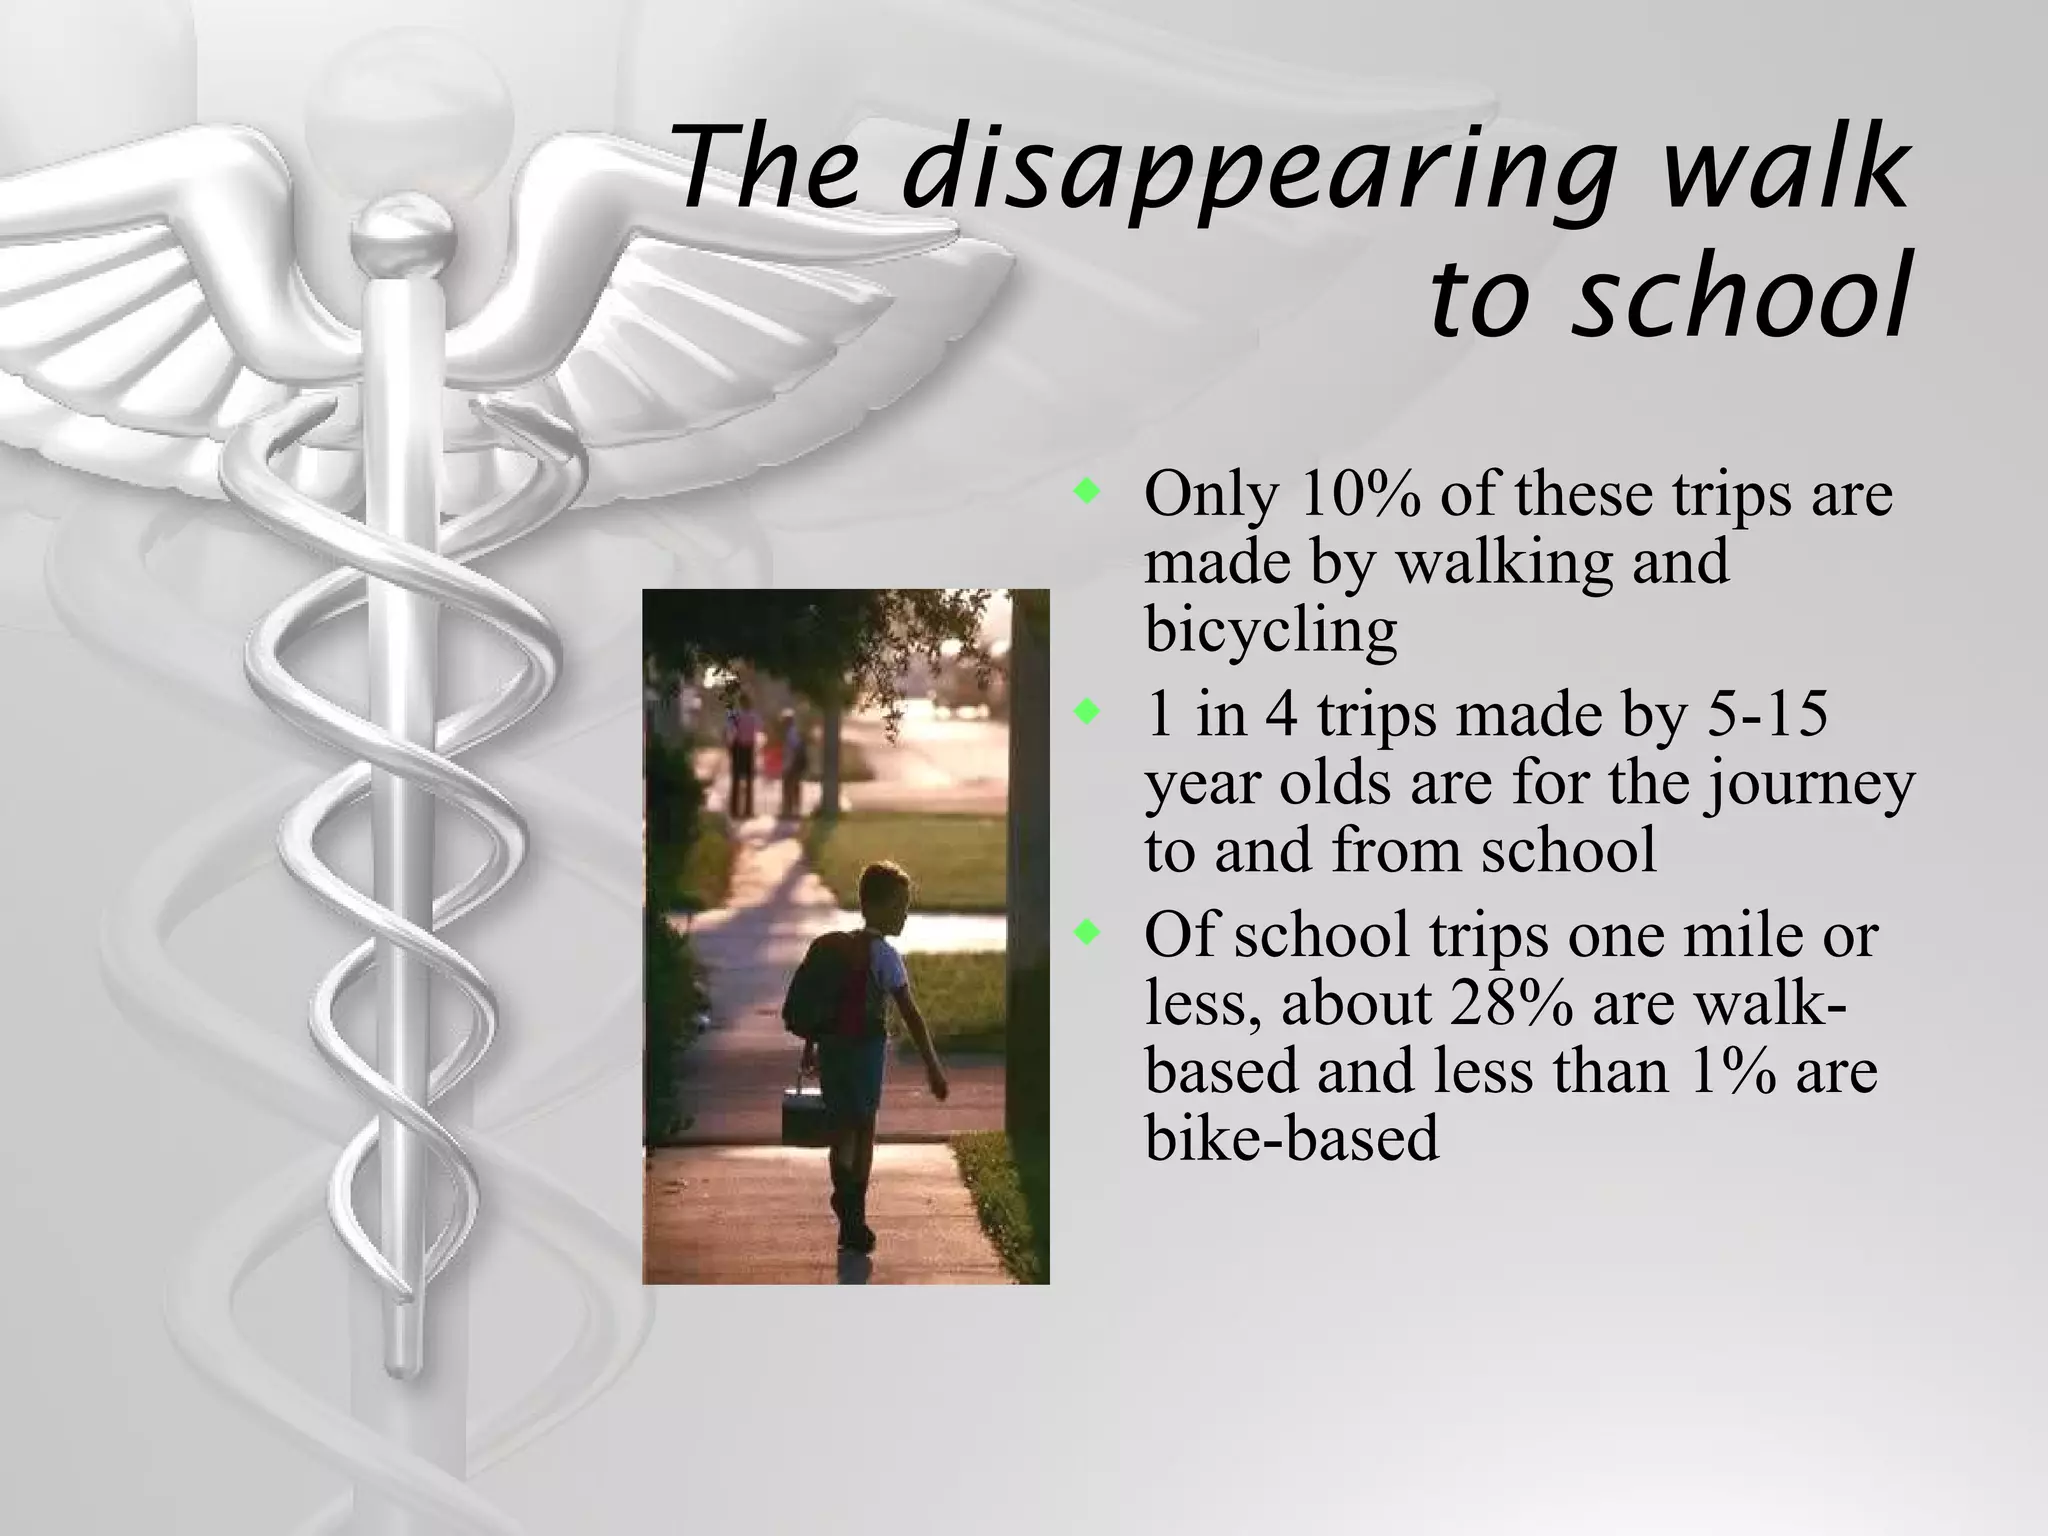


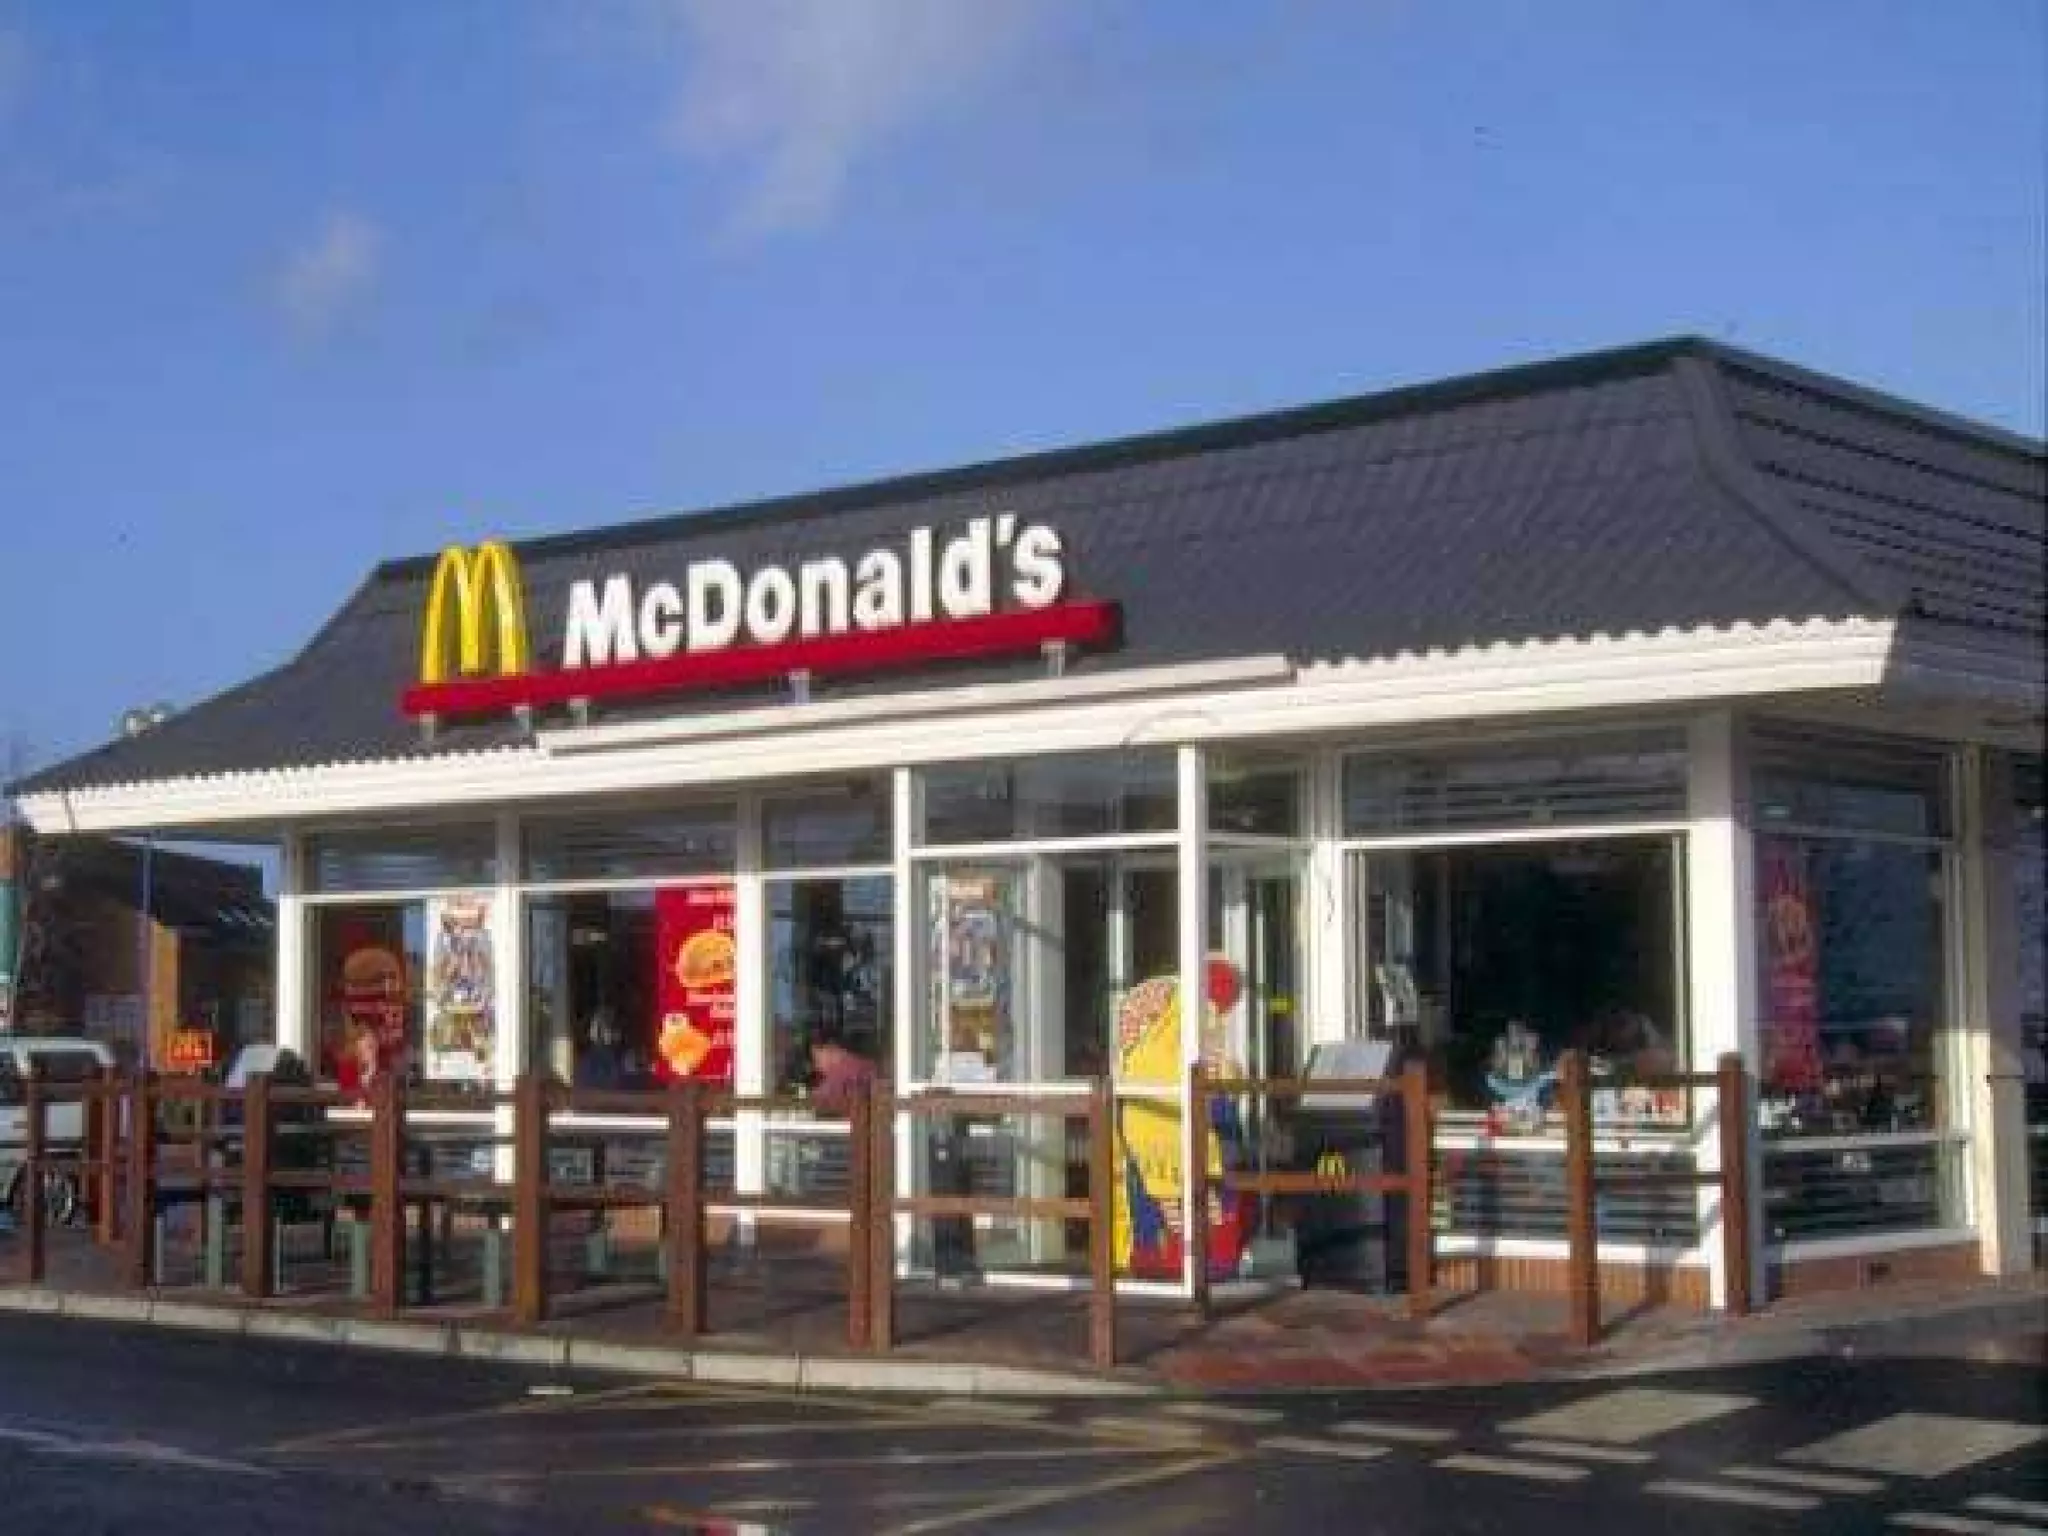


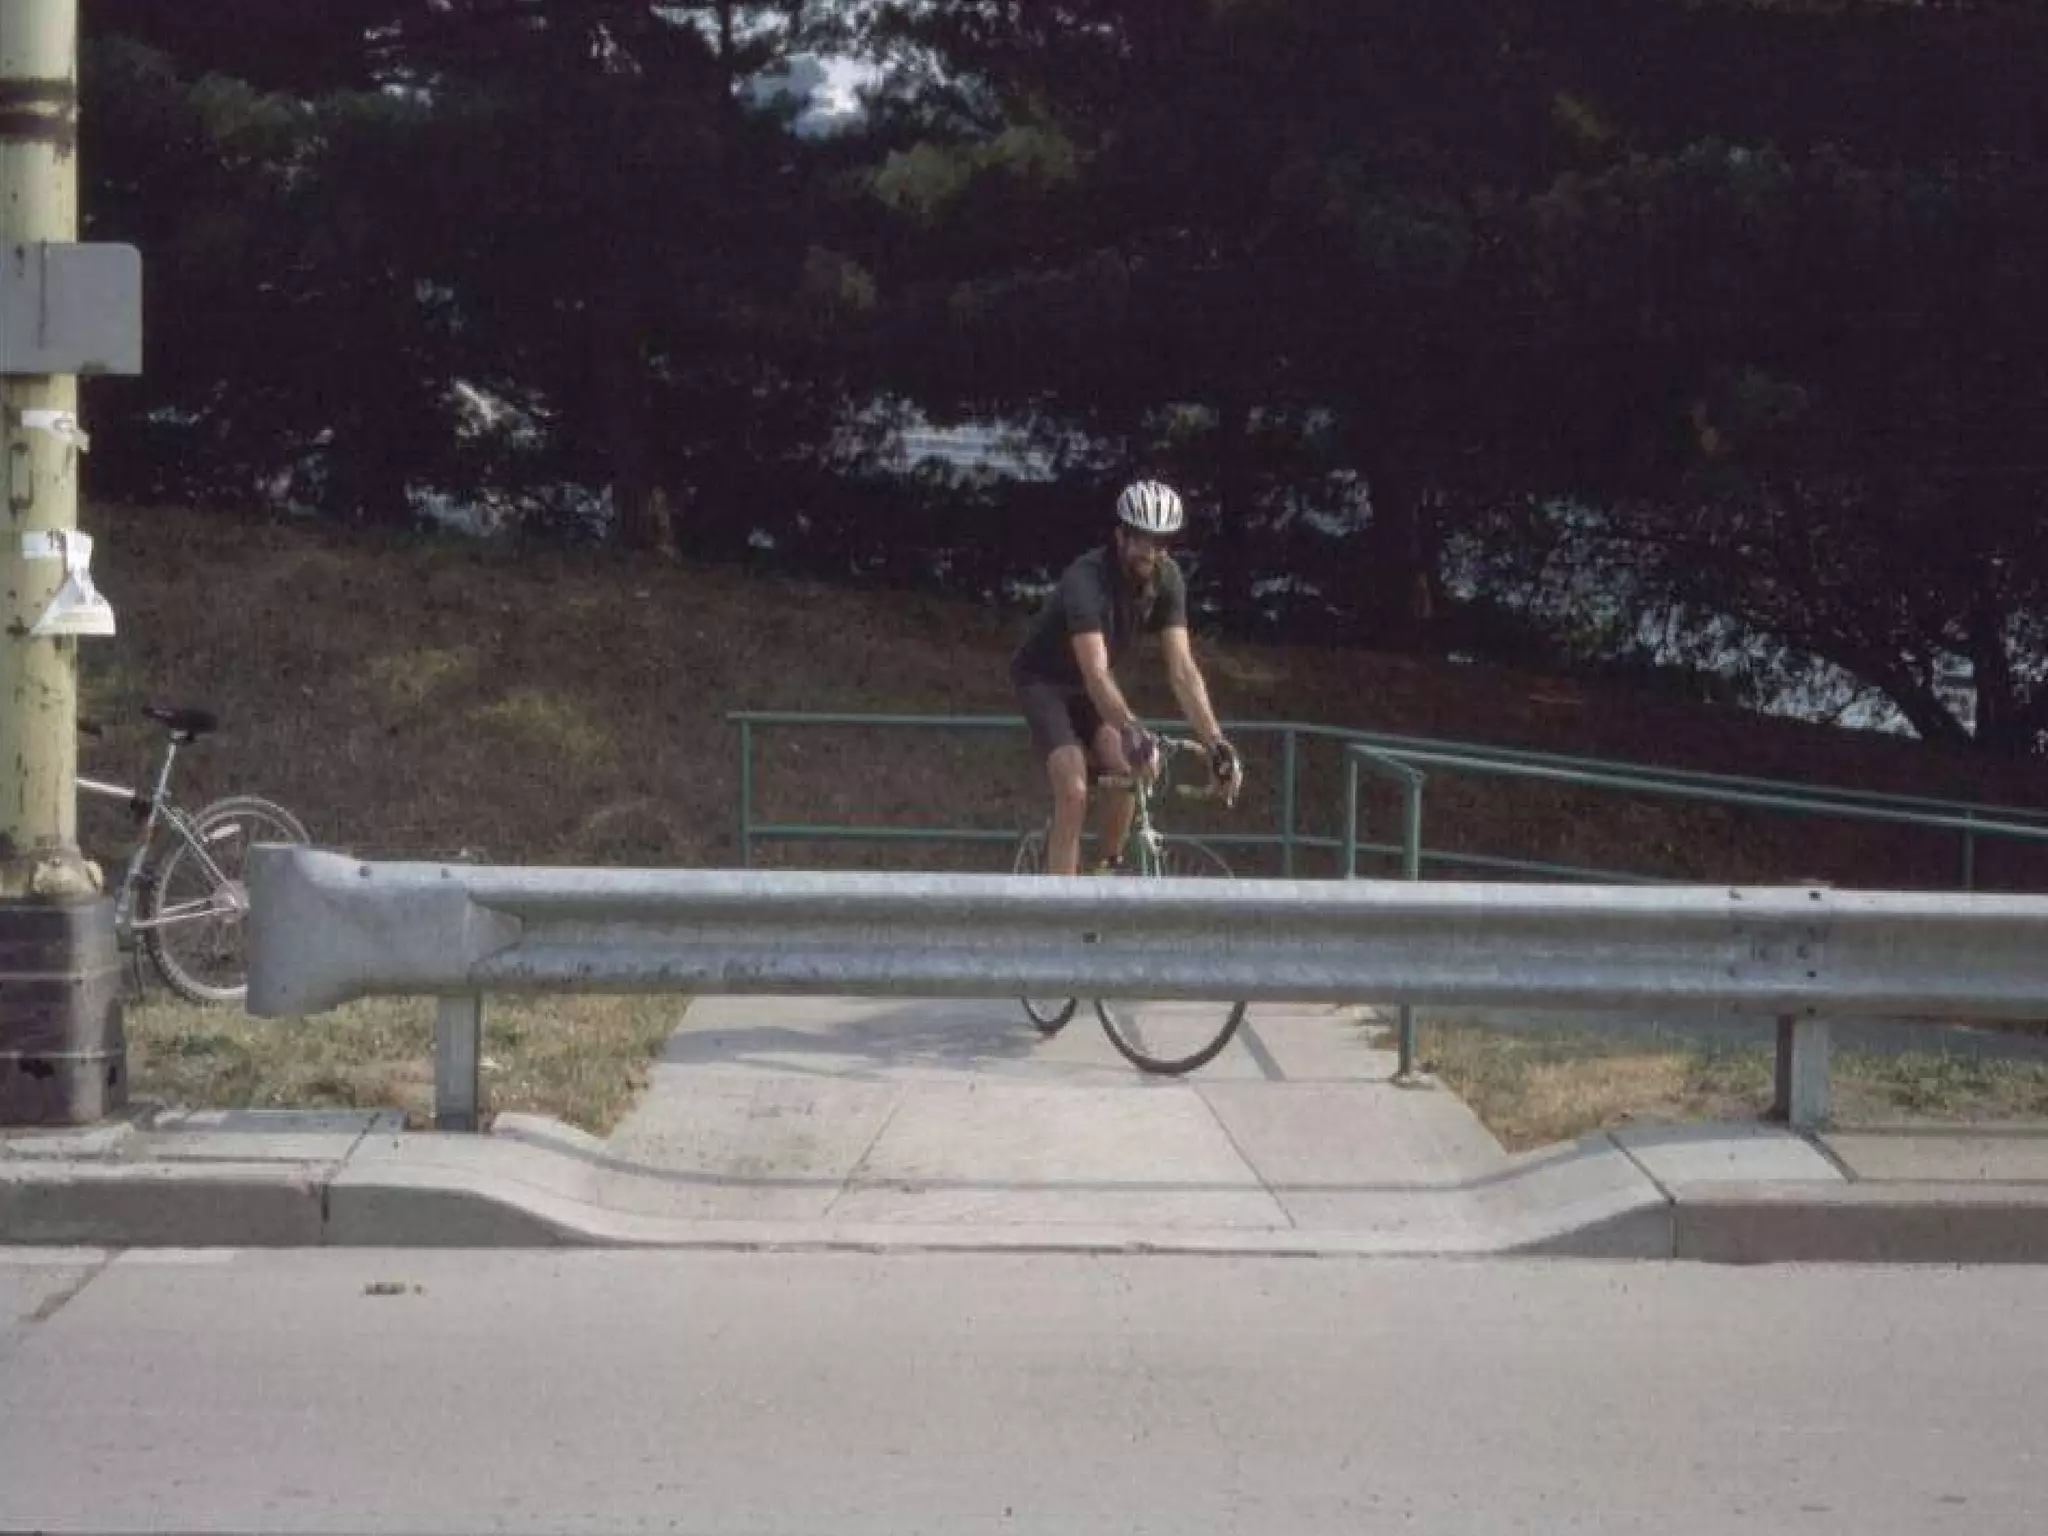

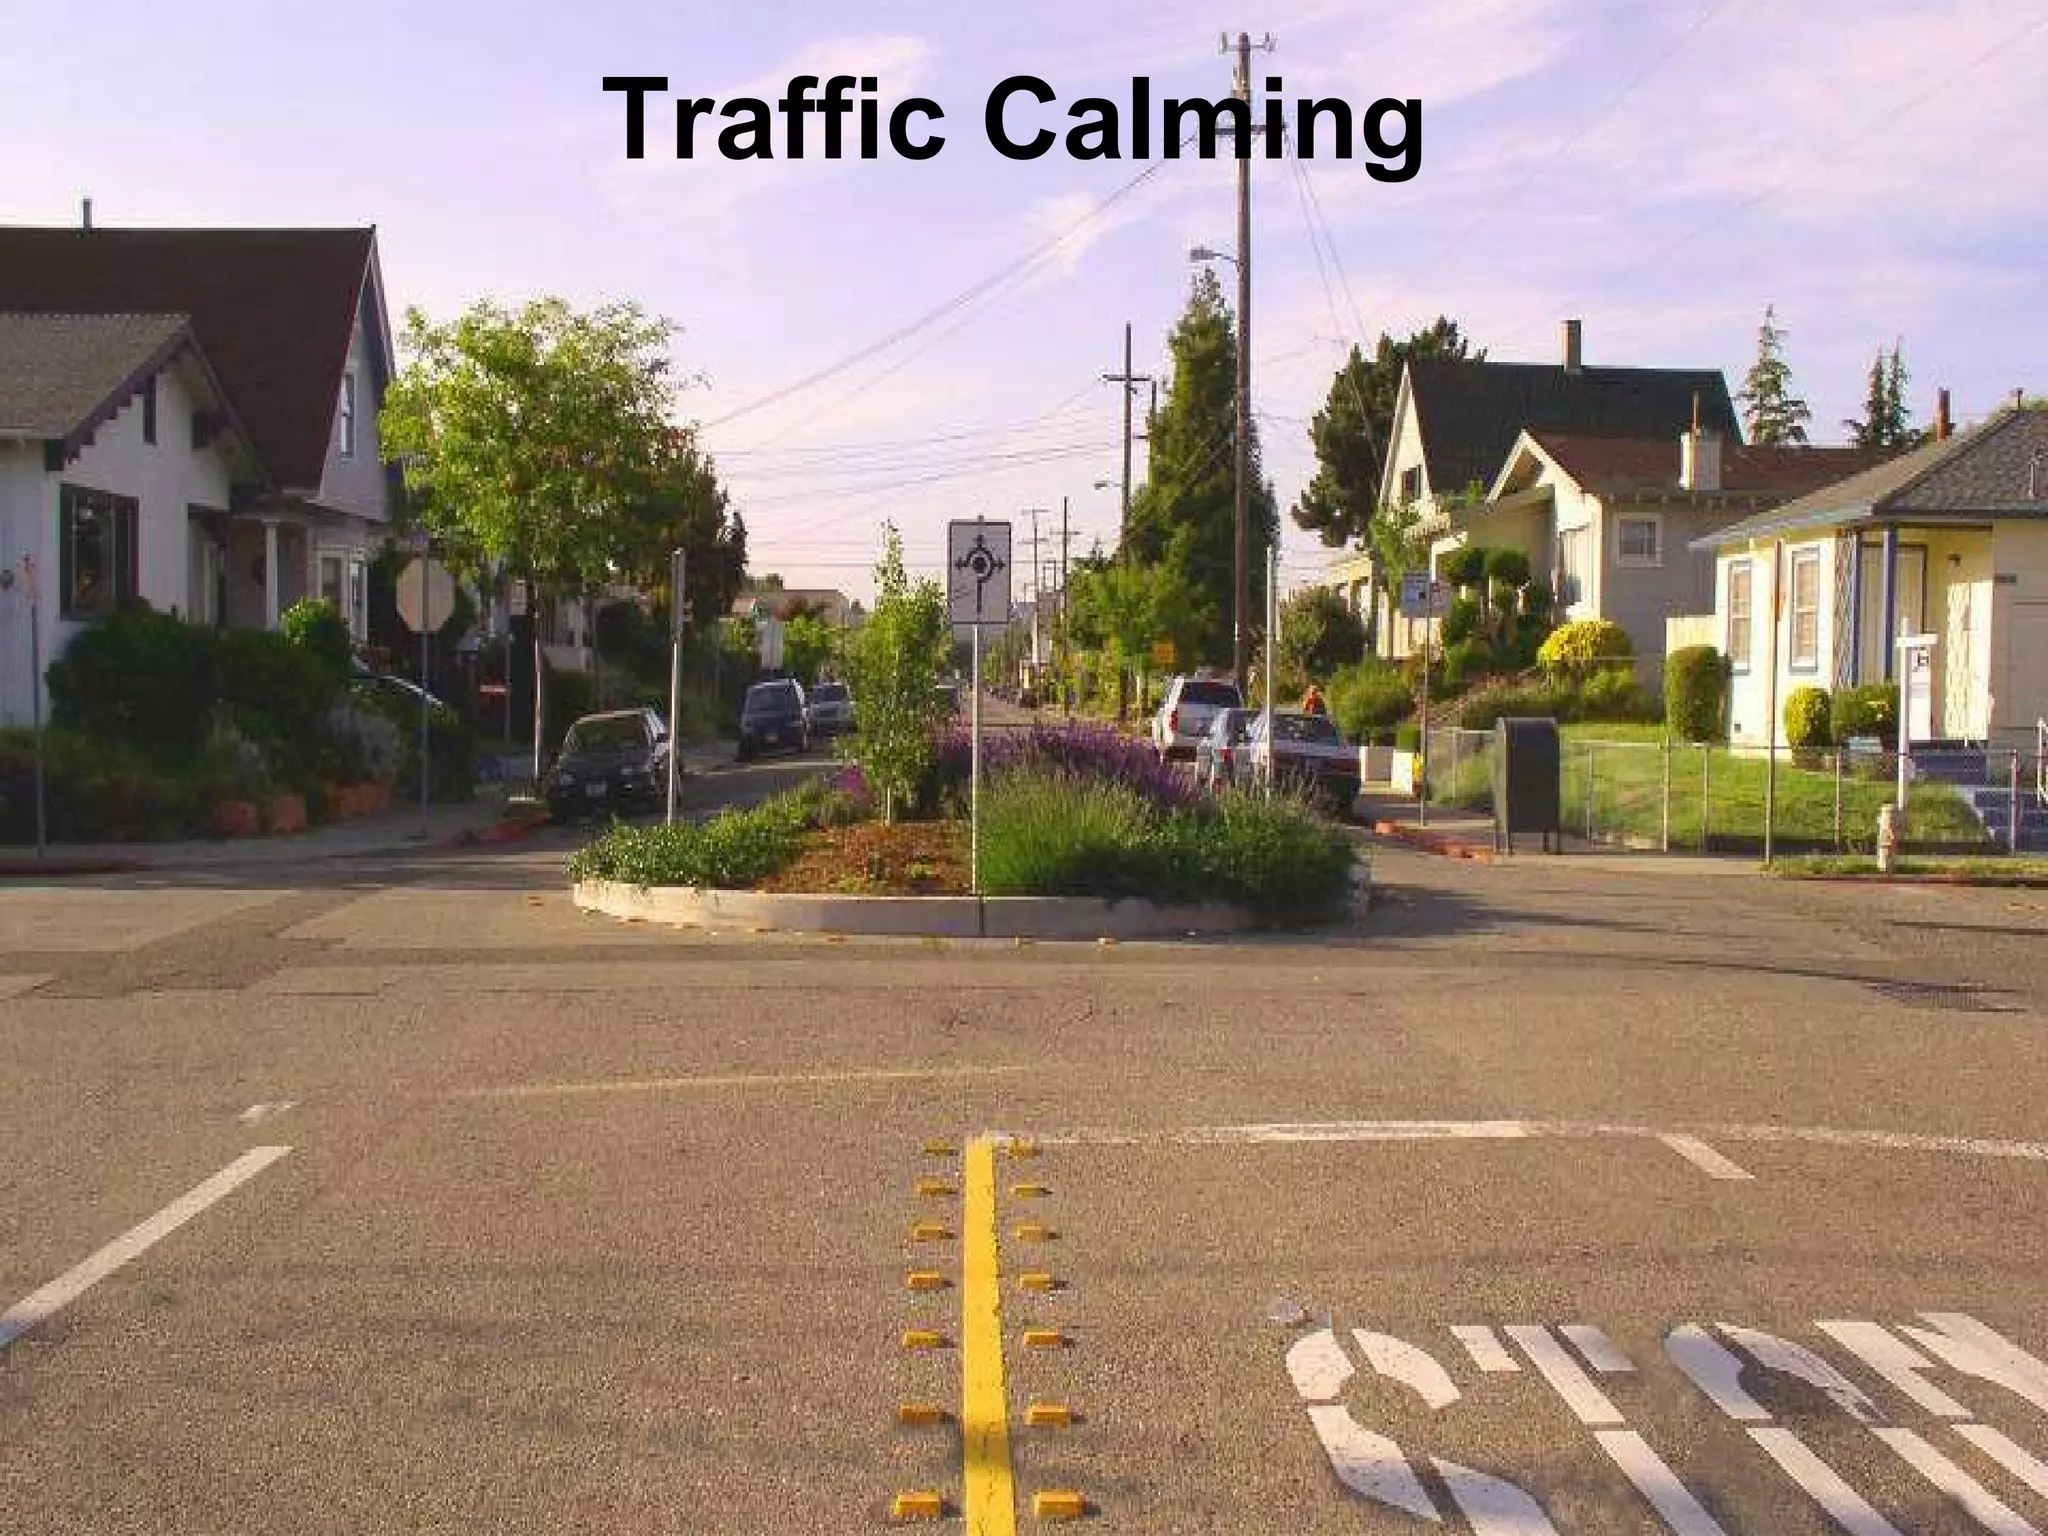

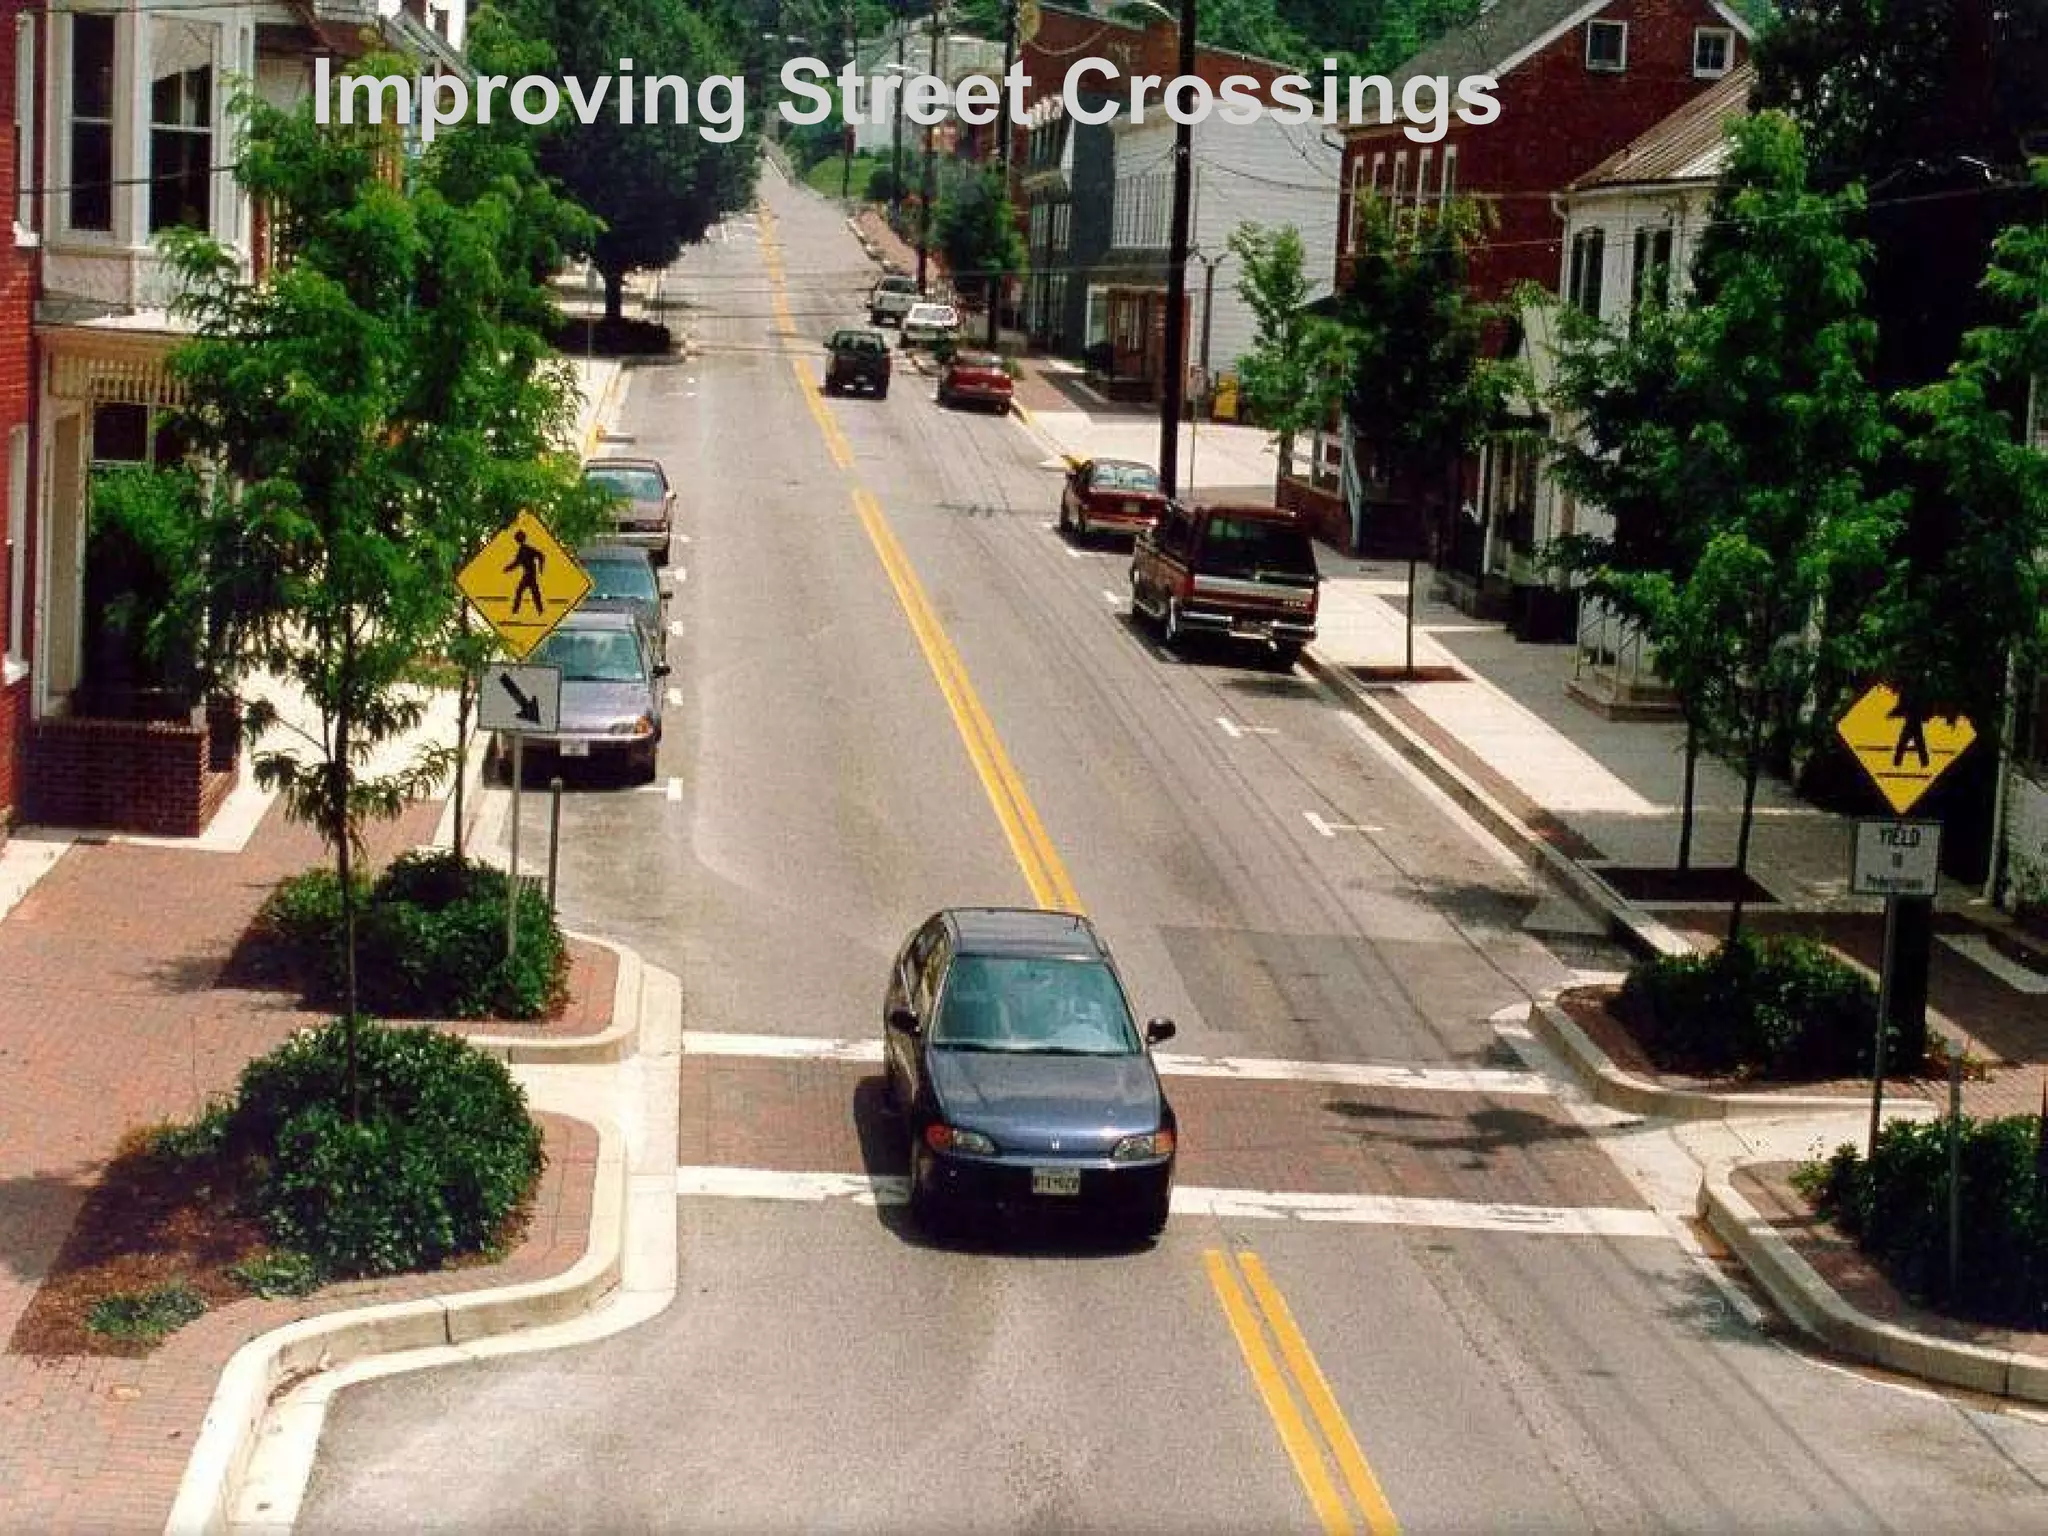

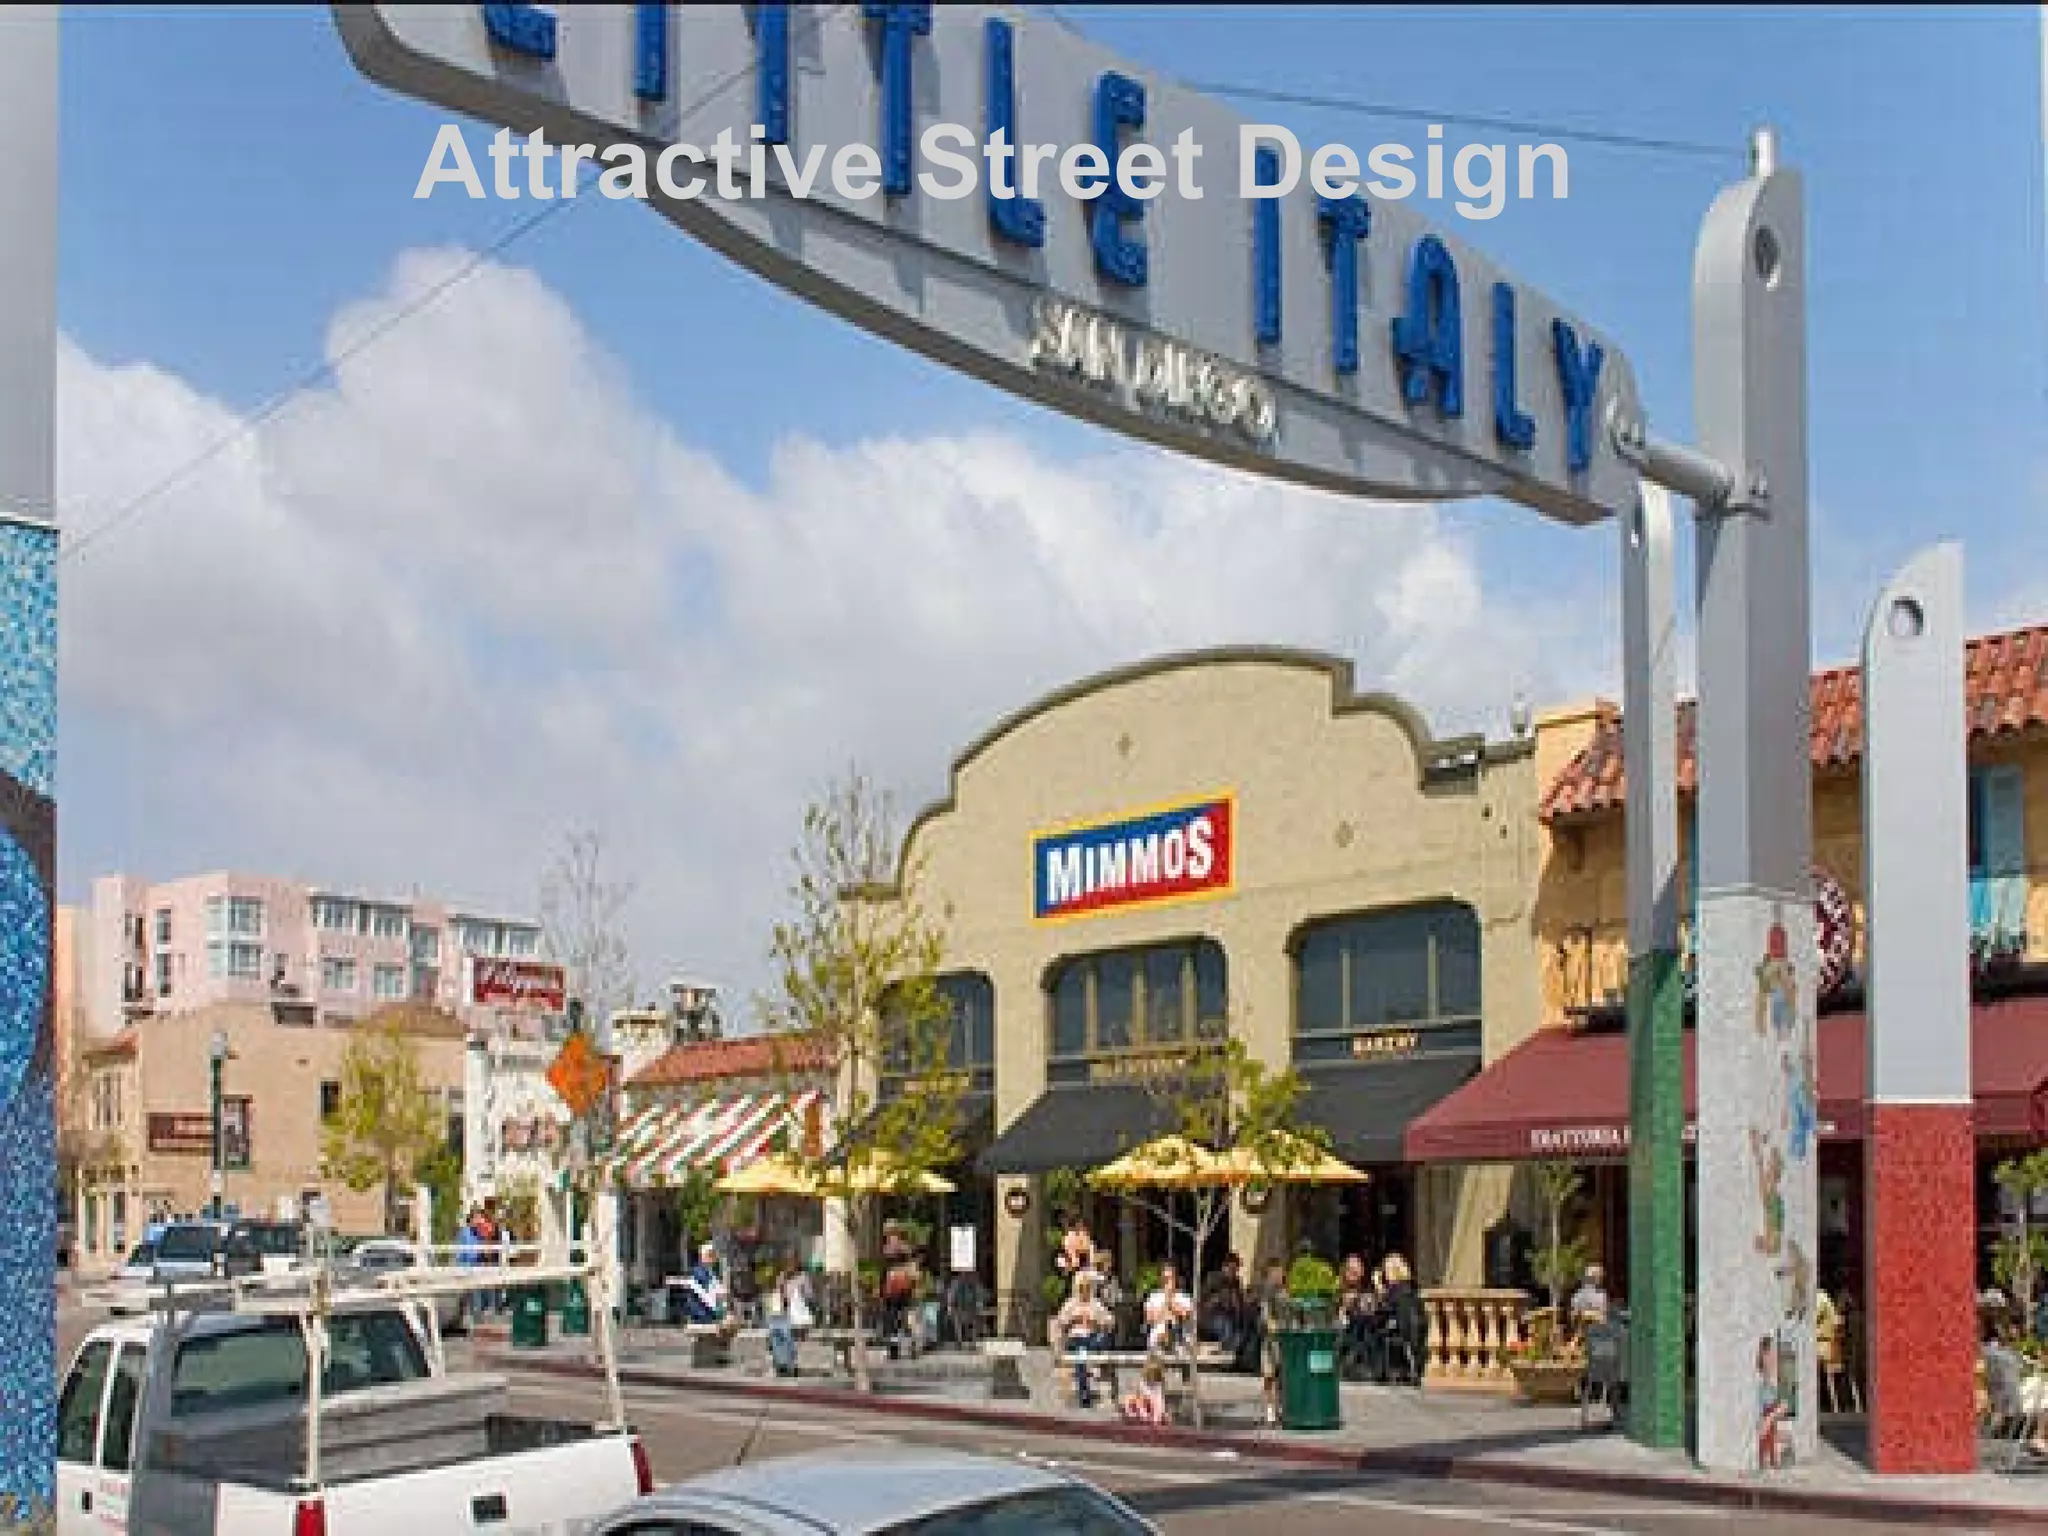

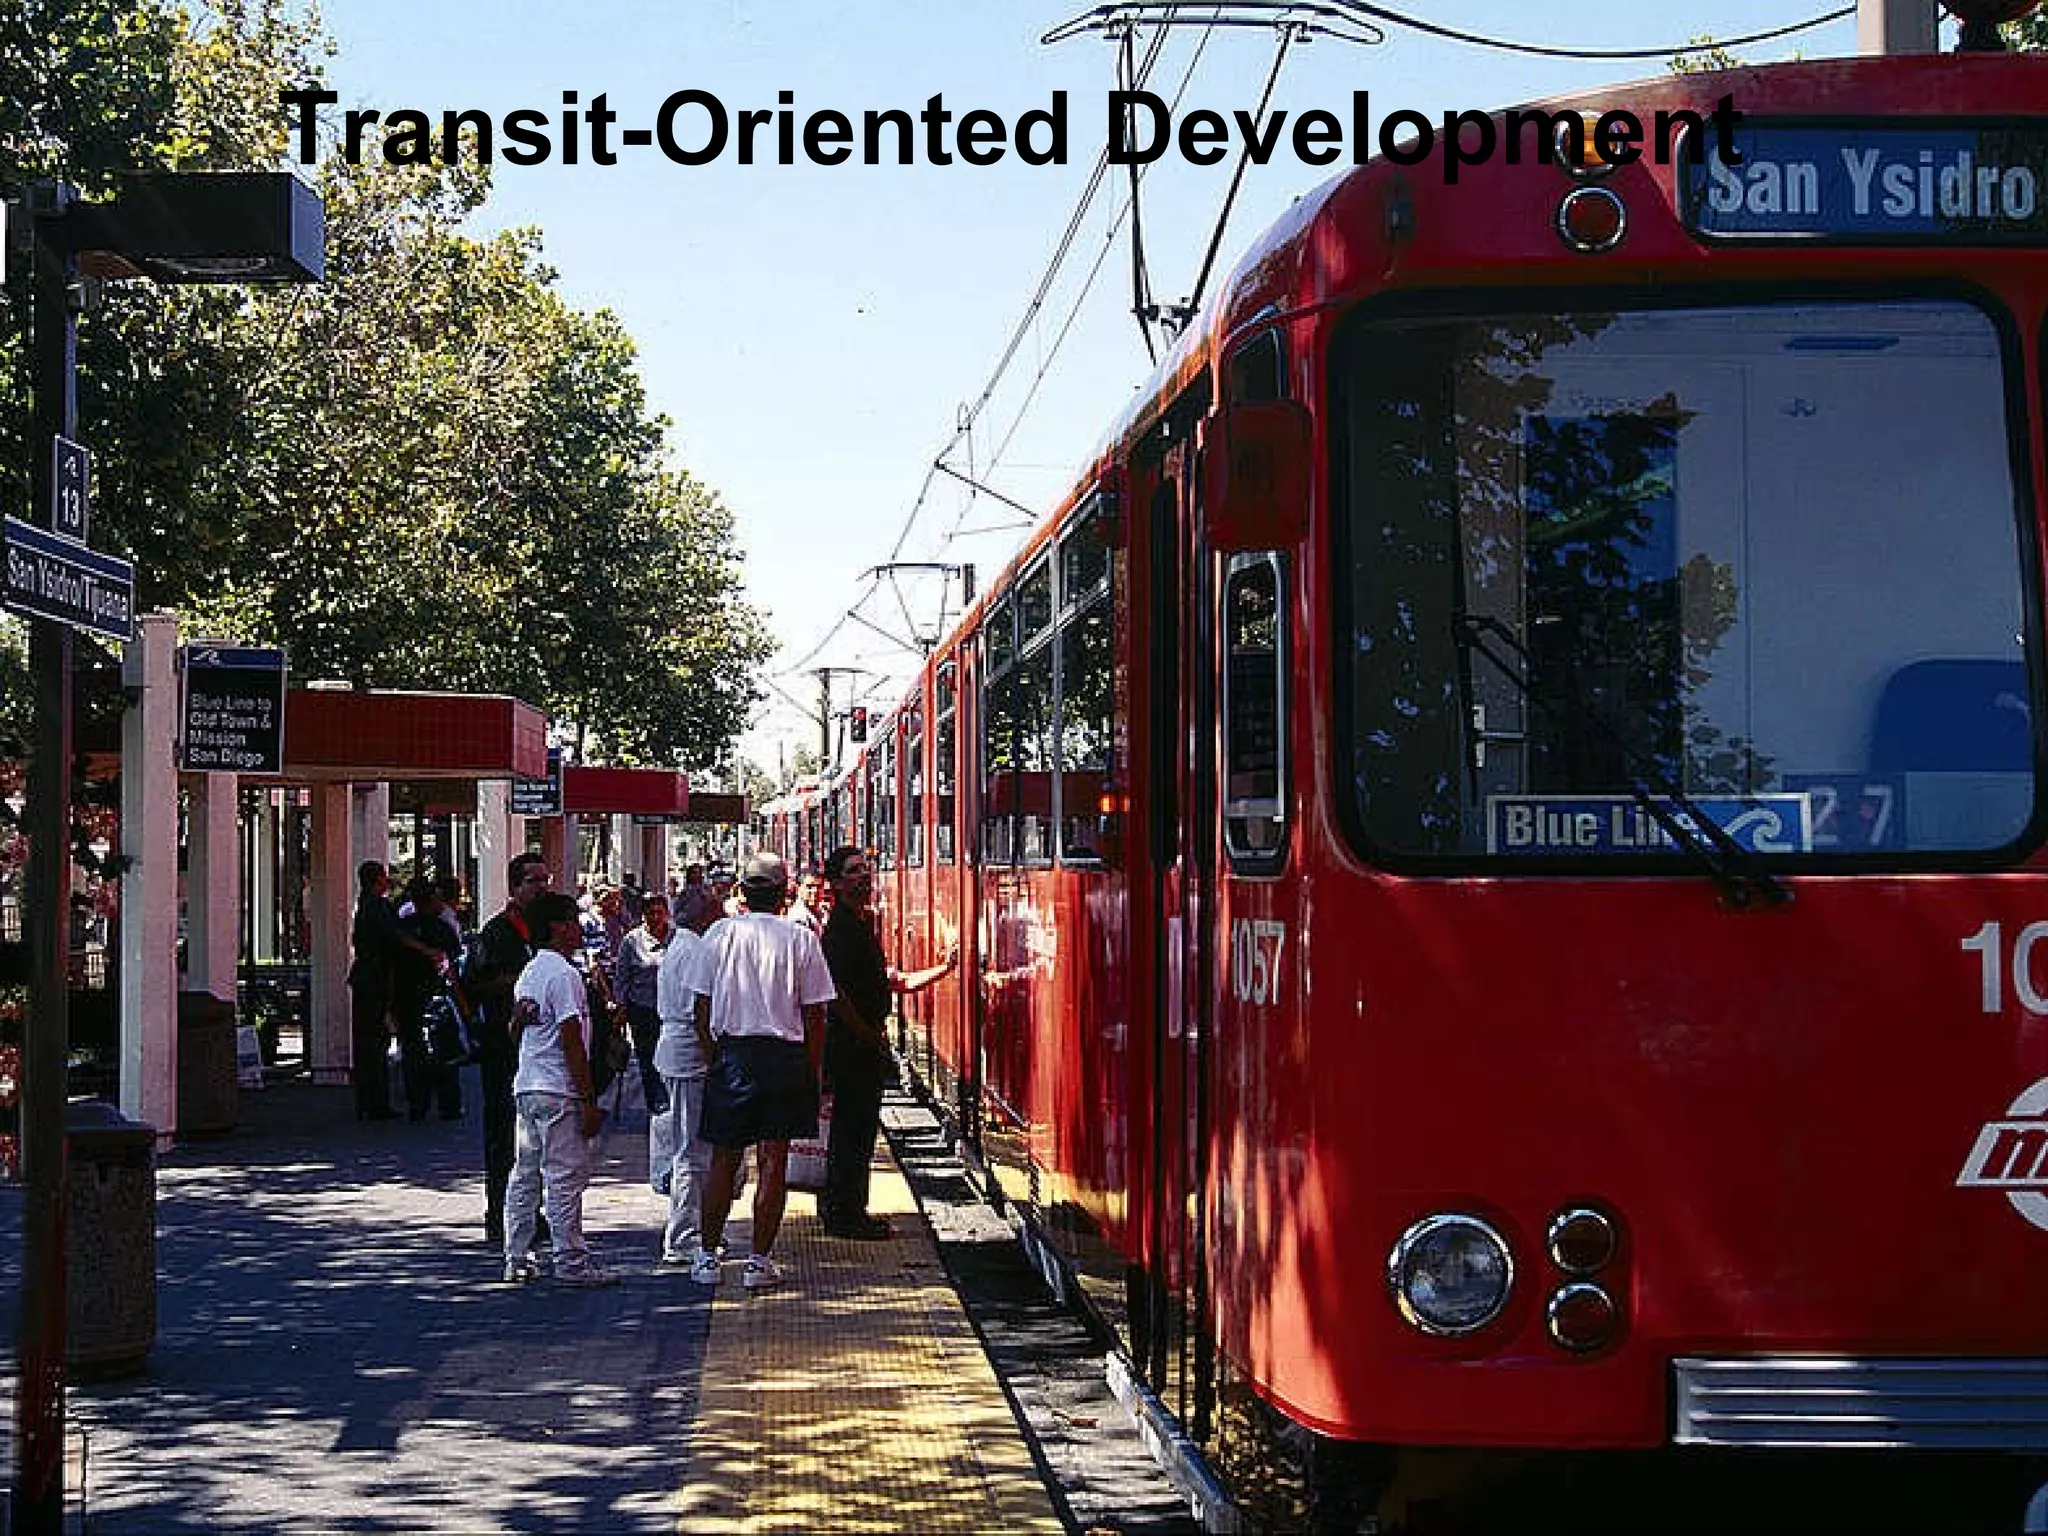
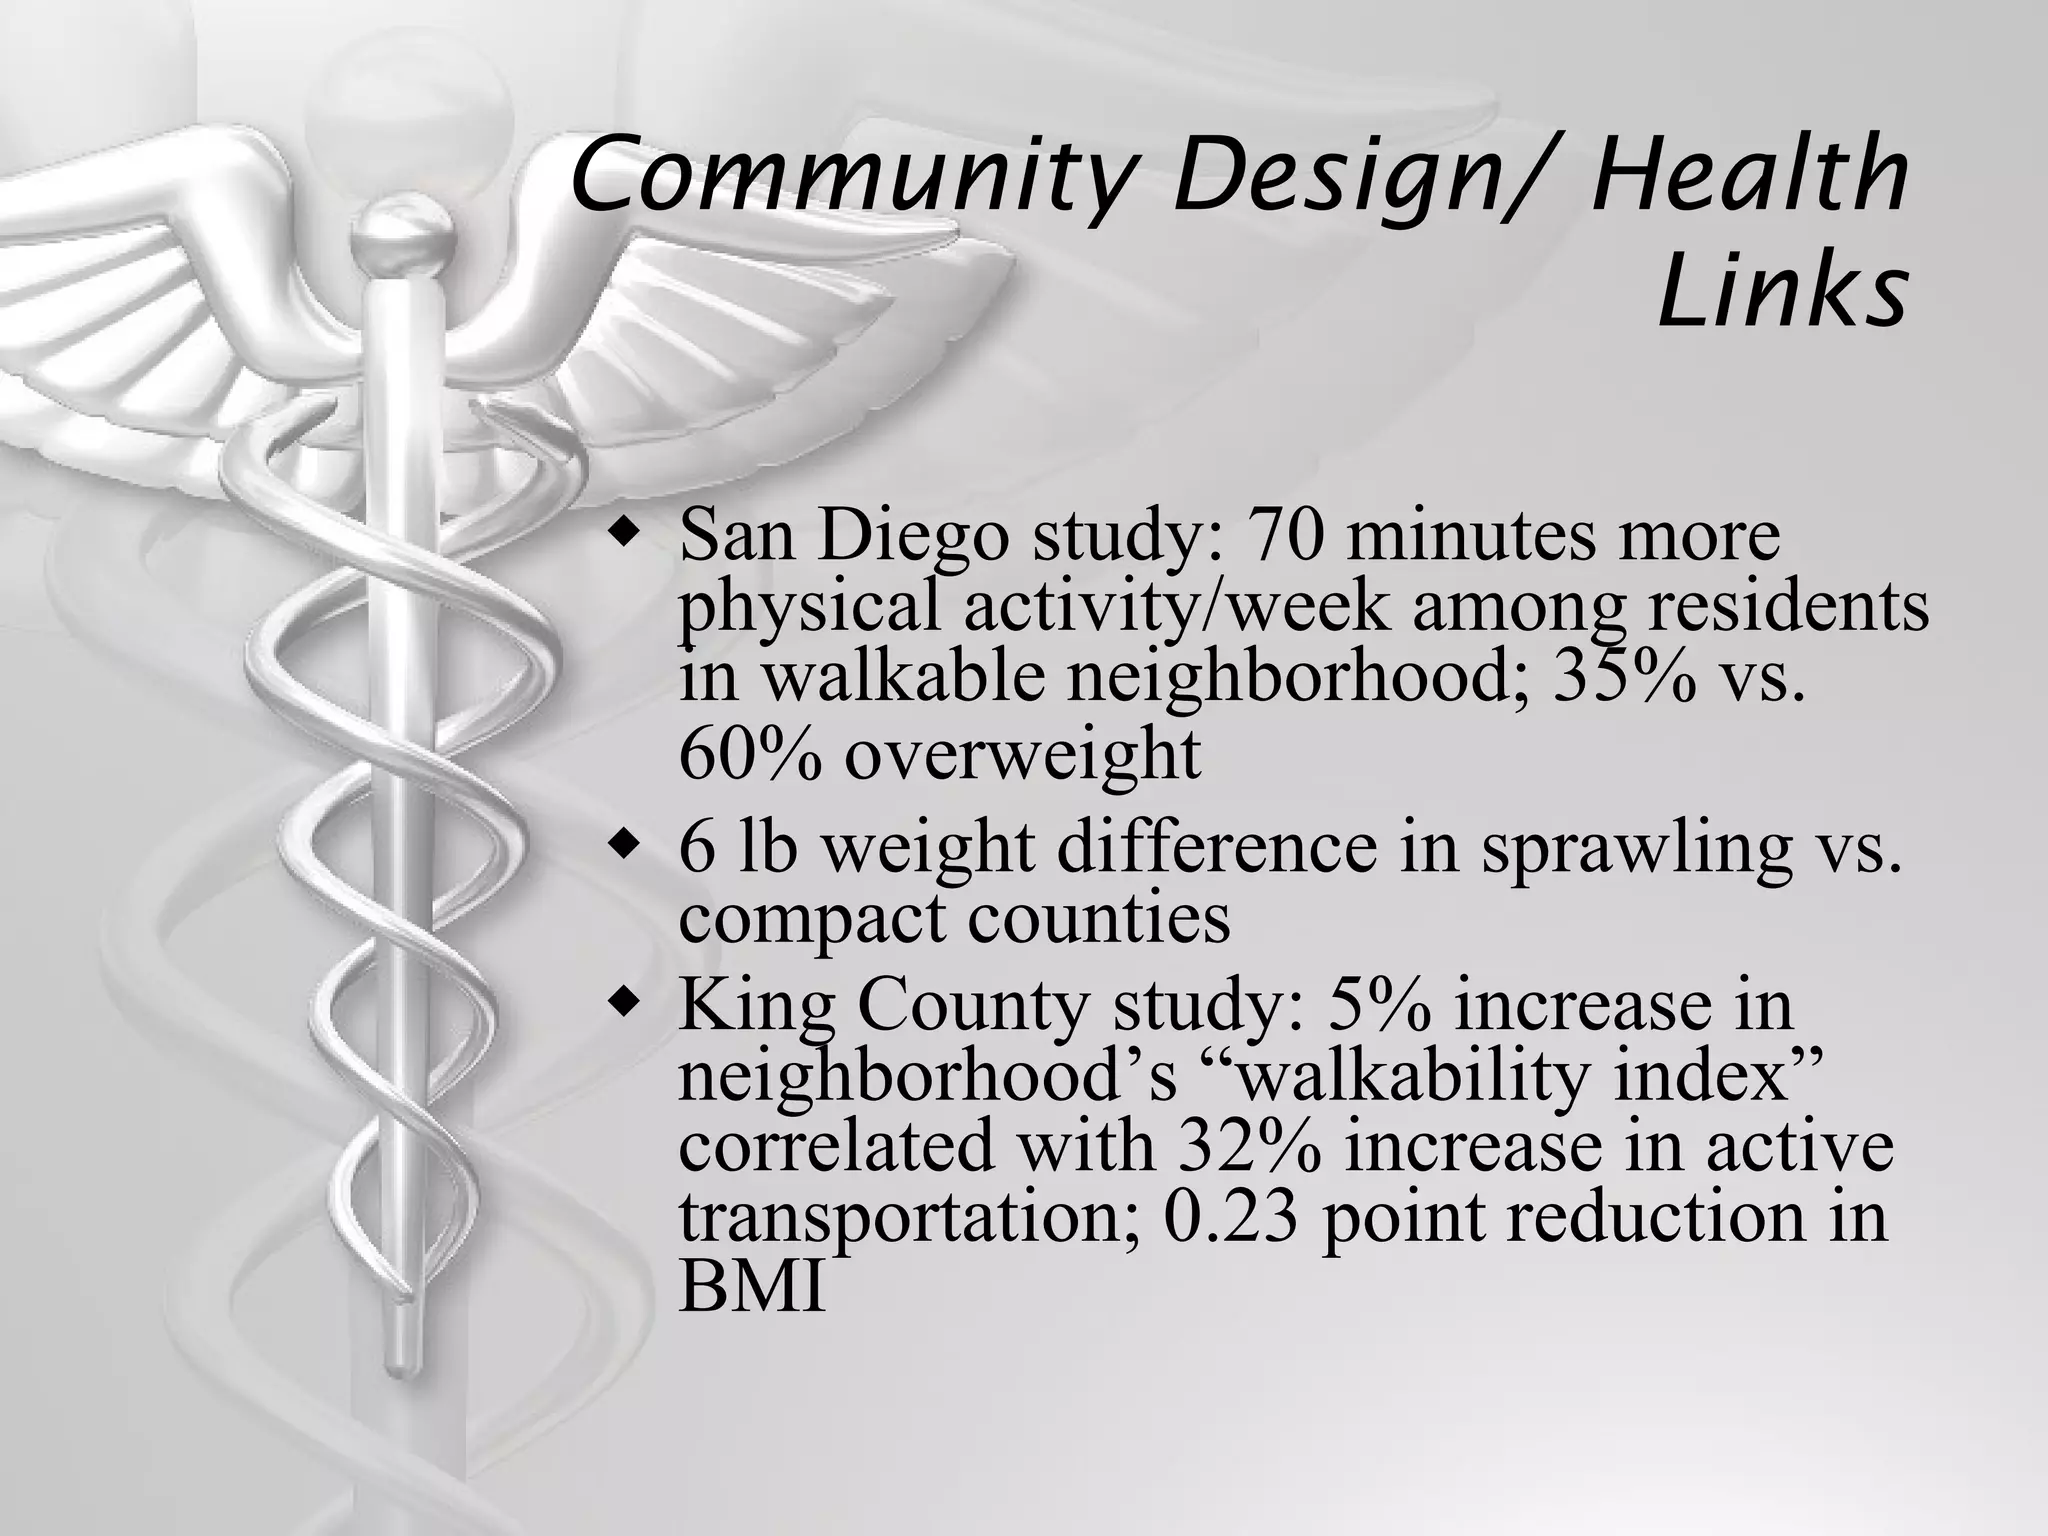


- Rates of overweight and obesity have increased dramatically in the US over the past few decades, with over 2/3 of American adults now overweight and about 1/3 obese. - This epidemic is primarily due to lifestyle and environmental changes that have led to poor nutrition habits like increased fast food consumption and sugary drinks, as well as less physical activity due to more sedentary jobs and communities designed around automobile use. - Community design features like walkability, mixed land use, and access to transit and active transportation can significantly impact physical activity levels and obesity rates by supporting healthier lifestyle choices.


