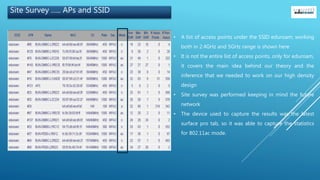
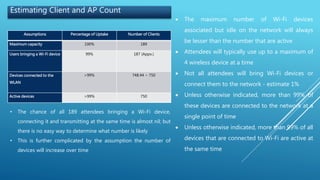
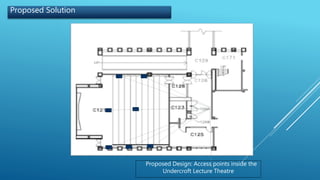
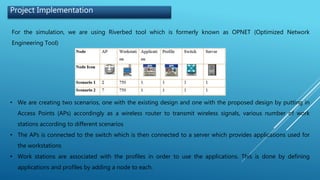
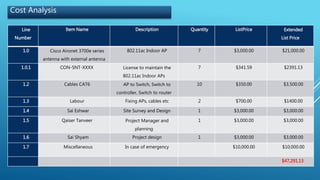
CSE5 ITP HIGH DENSITY
WIRELESS DESIGN
By
Qaiser Tanveer : 17650920 - Project Manager
Sai Shyam Tekumalla : 18046988 - Project Planning and Design
Sai Eshwar Chellapuram : 18047717 - Project Site Survey and Implementation
Introduction
• Due to the increase in the number of student logins each day, the university has decided to deploy a good
network as an immediate and future proof network
• On an average, the network should support 4 device per user in two years
• A suitable network without interference, eliminating black spots and supporting heavy loads is necessary
• The current network at Undercroft cannot address the growing needs of a wireless network. With this network
we won’t be able to provide a good network to all the devices now , let alone in the future. So, the need to
design a new network is of very high priority to address the current network issues
Project Objectives
• Improve and upgrade the existing wireless network setup
• To provide a suitable bandwidth to various users at different timings that includes peak hours and off peak
hours
• Improve and consolidate network performance and to provide a design with future expansion capabilities
• Improve the existing network security, redundancy, fault tolerance perspectives to increase overall efficiency of
the network
Challenges …………………..1
One of the most challenging factors in the network design of Undercroft building is the architectural design of
the building.
Cannot mount an Access point at this position as it affects the signal strength and the quality of the overall
signal.
Challenges …………………2
There are no APs inside the Undercroft Lecture Theatre. The capacity of the Lecture Theater is 189. There are only
two APs outside the lecture theatre and that is not enough to sustain the growing demands of the network.
Site Survey ….. For the Undercroft Area
• The data collected is also shown using colored lines and
dots
• The survey result depicts the AP coverage across the
Undercroft lecture theatre
Access Points – Outside the
lecture Theatre
SSID:
• eduroam
• NewToLTU
• LTUWireless2
• LTUGuest
Bleeding spot
Site Survey – Undercroft Lecture Theatre
Heat Map showing the Signal Strength
• The colors indicate the signal strength from the access points at each location
• This heat map shows the signal strength in the Undercroft Lecture Theatre
• The legend is across the top of the map. In this case, the units are dBm since signal
strengths are being mapped
Strongest Signal
Moderate Signal
Weak Signal
Bleeding Spot
Site Survey ….. Value Chart
• From the above value chart, we can infer that, the signal strength
at the top left corner is -83.6 dBm, this means the signal strength
is poor
• The channels seen support both 2.4GHz and 5GHz range. Noise
level is high in all the four cells
• The data rate seen at the bottom right corner is around -69.3
dBm, this is during peak hour and the signal strength does not
seem to be great
• Noise levels are pretty high when compared to the accepted levels
and that is one major factor affecting the data rates, throughput
and the signal strength of that area for all SSID’s
Site Survey ….. APs and SSID
• A list of access points under the SSID eduroam, working
both in 2.4GHz and 5GHz range is shown here
• It is not the entire list of access points, only for eduroam,
it covers the main idea behind our theory and the
inference that we needed to work on our high density
design
• Site survey was performed keeping in mind the future
network
• The device used to capture the results was the latest
surface pro tab, so it was able to capture the statistics
for 802.11ac mode.
Estimating Client and AP Count
Assumptions Percentage of Uptake Number of Clients
Maximum capacity 100% 189
Users bringing a Wi-Fi device 99% 187 (Appx.)
Devices connected to the
WLAN
>99% 748.44 ~ 750
Active devices >99% 750
• The chance of all 189 attendees bringing a Wi-Fi device,
connecting it and transmitting at the same time is almost nil; but
there is no easy way to determine what number is likely
• This is further complicated by the assumption the number of
devices will increase over time
 The maximum number of Wi-Fi devices
associated but idle on the network will always
be lesser than the number that are active
 Attendees will typically use up to a maximum of
4 wireless device at a time
 Not all attendees will bring Wi-Fi devices or
connect them to the network - estimate 1%
 Unless otherwise indicated, more than 99% of
these devices are connected to the network at a
single point of time
 Unless otherwise indicated, more than 99% of all
devices that are connected to Wi-Fi are active at
the same time
Estimating Clients per AP
Number of associated clients = 750
Estimated number of concurrent active devices = 99% of 750 = 750 approximate
Required throughput per client = 500 Kbps
Latency tolerance = high
RF environment = very high during peak usage
Percentage of retransmissions/loss due to interference = 35%
Estimated throughput per AP radio = 16.7 Mbps
Maximum clients per AP to meet capacity = 33 (16.7Mbps / 500Kbps per client)
Number of APs required to meet number of active clients = 22 APs (750/ 33)
Total APs for 750 associated devices = 15 (750 / 50)
Seats covered per AP = 13 (189 / 15)
Applications Nominal Throuput
Web access 500Kbps
Audio (Pandora, Apple Music,
Spotify)
100Kbps
Video (YouTube, Netflix, Skype,
FaceTime, Hangouts)
1Mbps
File sharing and Printing 1Mbps
The total nominal expected throughput
is 2.6Mbps
Bandwidth requirement per application
Proposed Solution
Proposed Design: Access points inside the
Undercroft Lecture Theatre
Proposed Solution – Position of APs
Project Implementation
For the simulation, we are using Riverbed tool which is formerly known as OPNET (Optimized Network
Engineering Tool)
• We are creating two scenarios, one with the existing design and one with the proposed design by putting in
Access Points (APs) accordingly as a wireless router to transmit wireless signals, various number of work
stations according to different scenarios
• The APs is connected to the switch which is then connected to a server which provides applications used for
the workstations
• Work stations are associated with the profiles in order to use the applications. This is done by defining
applications and profiles by adding a node to each.
Project Implementation
Delay for scenario 1 and 2:
• From the simulation result, we can analyze that the
delay is maximum in the case of scenario 1 which is
when 750 active devices are accessing 2 APs and
minimum in the other case when 750 active devices are
accessing 7 APs
• We can conclude from the performance analysis that
delay increases when the load is high on a single AP
instead when the load is balanced amongst 7 Aps, the
delay seems to be balanced better in the high density
areas of the lecture theatre
Project Implementation
Throughput for scenario 1 and 2
• As the number of workstations increases, the
throughput also increases and it is evident from the
adjacent figure
• The throughput can be monitored by setting in proper
inter packet arrival rate and also modifying the
configurations and operating conditions which affect
the peak throughput performance and efficiency of the
system
Cost Analysis
Line
Number
Item Name Description Quantity ListPrice Extended
List Price
1.0 Cisco Aironet 3700e series
antenna with external antenna
802.11ac Indoor AP 7 $3,000.00 $21,000.00
1.0.1 CON-SNT-XXXX License to maintain the
802.11ac Indoor APs
7 $341.59 $2391.13
1.2 Cables CAT6 AP to Switch, Switch to
controller, Switch to router
10 $350.00 $3,500.00
1.3 Labour Fixing APs, cables etc 2 $700.00 $1400.00
1.4 Sai Eshwar Site Survey and Design 1 $3,000.00 $3,000.00
1.5 Qaiser Tanveer Project Manager and
planning
1 $3,000.00 $3,000.00
1.6 Sai Shyam Project design 1 $3,000.00 $3,000.00
1.7 Miscellaneous In case of emergency $10,000.00 $10,000.00
$47,291.13
Indoor wireless for
Undercroft
Senior
Management
CIO
Rasika Nayanajith
Networks Team
Leader
Gareth D’Souza
Senior Network
Security Specialist
Project QSS
Sai Shyam
Project planning
and design
Project QSS
Qaiser Tanveer
Project Manager
Project QSS
Sai Eshwar
Project Survey and
Design head
End Users
Secondary
stakeholders
Prakash
Veeraghavan
Supervisor for the
project
STAKEHOLDERS
PLANNING (15DAYS)
Project planning
Define project scope
Define business case
Estimate project schedule
DESIGN (25 DAYS)
Analysis
Design document
Prototype of design
IMPLEMENTATION (30 DAYS)
Implement the wireless network
design
Testing
Project Timeline
Thank You

HD WIRELESS FINAL PPT

  • 1.
    CSE5 ITP HIGHDENSITY WIRELESS DESIGN By Qaiser Tanveer : 17650920 - Project Manager Sai Shyam Tekumalla : 18046988 - Project Planning and Design Sai Eshwar Chellapuram : 18047717 - Project Site Survey and Implementation
  • 2.
    Introduction • Due tothe increase in the number of student logins each day, the university has decided to deploy a good network as an immediate and future proof network • On an average, the network should support 4 device per user in two years • A suitable network without interference, eliminating black spots and supporting heavy loads is necessary • The current network at Undercroft cannot address the growing needs of a wireless network. With this network we won’t be able to provide a good network to all the devices now , let alone in the future. So, the need to design a new network is of very high priority to address the current network issues
  • 3.
    Project Objectives • Improveand upgrade the existing wireless network setup • To provide a suitable bandwidth to various users at different timings that includes peak hours and off peak hours • Improve and consolidate network performance and to provide a design with future expansion capabilities • Improve the existing network security, redundancy, fault tolerance perspectives to increase overall efficiency of the network
  • 4.
    Challenges …………………..1 One ofthe most challenging factors in the network design of Undercroft building is the architectural design of the building. Cannot mount an Access point at this position as it affects the signal strength and the quality of the overall signal.
  • 5.
    Challenges …………………2 There areno APs inside the Undercroft Lecture Theatre. The capacity of the Lecture Theater is 189. There are only two APs outside the lecture theatre and that is not enough to sustain the growing demands of the network.
  • 6.
    Site Survey …..For the Undercroft Area
  • 7.
    Site Survey …..For the Undercroft Area • The data collected is also shown using colored lines and dots • The survey result depicts the AP coverage across the Undercroft lecture theatre Access Points – Outside the lecture Theatre SSID: • eduroam • NewToLTU • LTUWireless2 • LTUGuest Bleeding spot
  • 8.
    Site Survey –Undercroft Lecture Theatre Heat Map showing the Signal Strength • The colors indicate the signal strength from the access points at each location • This heat map shows the signal strength in the Undercroft Lecture Theatre • The legend is across the top of the map. In this case, the units are dBm since signal strengths are being mapped Strongest Signal Moderate Signal Weak Signal Bleeding Spot
  • 9.
    Site Survey …..Value Chart • From the above value chart, we can infer that, the signal strength at the top left corner is -83.6 dBm, this means the signal strength is poor • The channels seen support both 2.4GHz and 5GHz range. Noise level is high in all the four cells • The data rate seen at the bottom right corner is around -69.3 dBm, this is during peak hour and the signal strength does not seem to be great • Noise levels are pretty high when compared to the accepted levels and that is one major factor affecting the data rates, throughput and the signal strength of that area for all SSID’s
  • 10.
    Site Survey …..APs and SSID • A list of access points under the SSID eduroam, working both in 2.4GHz and 5GHz range is shown here • It is not the entire list of access points, only for eduroam, it covers the main idea behind our theory and the inference that we needed to work on our high density design • Site survey was performed keeping in mind the future network • The device used to capture the results was the latest surface pro tab, so it was able to capture the statistics for 802.11ac mode.
  • 11.
    Estimating Client andAP Count Assumptions Percentage of Uptake Number of Clients Maximum capacity 100% 189 Users bringing a Wi-Fi device 99% 187 (Appx.) Devices connected to the WLAN >99% 748.44 ~ 750 Active devices >99% 750 • The chance of all 189 attendees bringing a Wi-Fi device, connecting it and transmitting at the same time is almost nil; but there is no easy way to determine what number is likely • This is further complicated by the assumption the number of devices will increase over time  The maximum number of Wi-Fi devices associated but idle on the network will always be lesser than the number that are active  Attendees will typically use up to a maximum of 4 wireless device at a time  Not all attendees will bring Wi-Fi devices or connect them to the network - estimate 1%  Unless otherwise indicated, more than 99% of these devices are connected to the network at a single point of time  Unless otherwise indicated, more than 99% of all devices that are connected to Wi-Fi are active at the same time
  • 12.
    Estimating Clients perAP Number of associated clients = 750 Estimated number of concurrent active devices = 99% of 750 = 750 approximate Required throughput per client = 500 Kbps Latency tolerance = high RF environment = very high during peak usage Percentage of retransmissions/loss due to interference = 35% Estimated throughput per AP radio = 16.7 Mbps Maximum clients per AP to meet capacity = 33 (16.7Mbps / 500Kbps per client) Number of APs required to meet number of active clients = 22 APs (750/ 33) Total APs for 750 associated devices = 15 (750 / 50) Seats covered per AP = 13 (189 / 15) Applications Nominal Throuput Web access 500Kbps Audio (Pandora, Apple Music, Spotify) 100Kbps Video (YouTube, Netflix, Skype, FaceTime, Hangouts) 1Mbps File sharing and Printing 1Mbps The total nominal expected throughput is 2.6Mbps Bandwidth requirement per application
  • 13.
    Proposed Solution Proposed Design:Access points inside the Undercroft Lecture Theatre
  • 14.
    Proposed Solution –Position of APs
  • 15.
    Project Implementation For thesimulation, we are using Riverbed tool which is formerly known as OPNET (Optimized Network Engineering Tool) • We are creating two scenarios, one with the existing design and one with the proposed design by putting in Access Points (APs) accordingly as a wireless router to transmit wireless signals, various number of work stations according to different scenarios • The APs is connected to the switch which is then connected to a server which provides applications used for the workstations • Work stations are associated with the profiles in order to use the applications. This is done by defining applications and profiles by adding a node to each.
  • 16.
    Project Implementation Delay forscenario 1 and 2: • From the simulation result, we can analyze that the delay is maximum in the case of scenario 1 which is when 750 active devices are accessing 2 APs and minimum in the other case when 750 active devices are accessing 7 APs • We can conclude from the performance analysis that delay increases when the load is high on a single AP instead when the load is balanced amongst 7 Aps, the delay seems to be balanced better in the high density areas of the lecture theatre
  • 17.
    Project Implementation Throughput forscenario 1 and 2 • As the number of workstations increases, the throughput also increases and it is evident from the adjacent figure • The throughput can be monitored by setting in proper inter packet arrival rate and also modifying the configurations and operating conditions which affect the peak throughput performance and efficiency of the system
  • 18.
    Cost Analysis Line Number Item NameDescription Quantity ListPrice Extended List Price 1.0 Cisco Aironet 3700e series antenna with external antenna 802.11ac Indoor AP 7 $3,000.00 $21,000.00 1.0.1 CON-SNT-XXXX License to maintain the 802.11ac Indoor APs 7 $341.59 $2391.13 1.2 Cables CAT6 AP to Switch, Switch to controller, Switch to router 10 $350.00 $3,500.00 1.3 Labour Fixing APs, cables etc 2 $700.00 $1400.00 1.4 Sai Eshwar Site Survey and Design 1 $3,000.00 $3,000.00 1.5 Qaiser Tanveer Project Manager and planning 1 $3,000.00 $3,000.00 1.6 Sai Shyam Project design 1 $3,000.00 $3,000.00 1.7 Miscellaneous In case of emergency $10,000.00 $10,000.00 $47,291.13
  • 19.
    Indoor wireless for Undercroft Senior Management CIO RasikaNayanajith Networks Team Leader Gareth D’Souza Senior Network Security Specialist Project QSS Sai Shyam Project planning and design Project QSS Qaiser Tanveer Project Manager Project QSS Sai Eshwar Project Survey and Design head End Users Secondary stakeholders Prakash Veeraghavan Supervisor for the project STAKEHOLDERS
  • 20.
    PLANNING (15DAYS) Project planning Defineproject scope Define business case Estimate project schedule DESIGN (25 DAYS) Analysis Design document Prototype of design IMPLEMENTATION (30 DAYS) Implement the wireless network design Testing Project Timeline Thank You