Downloaded 37 times


![Segment wise Profitability
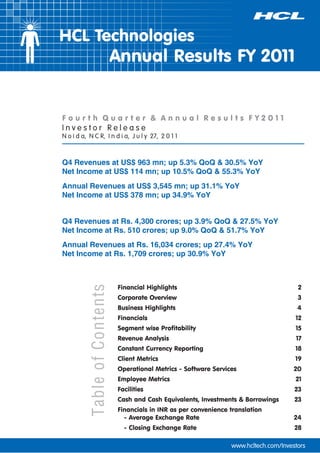
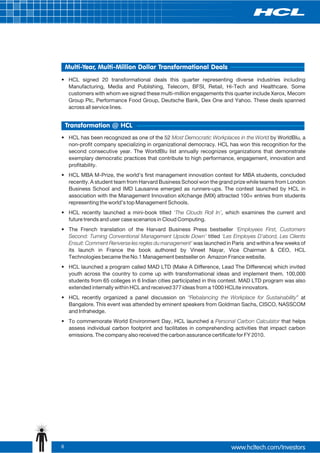
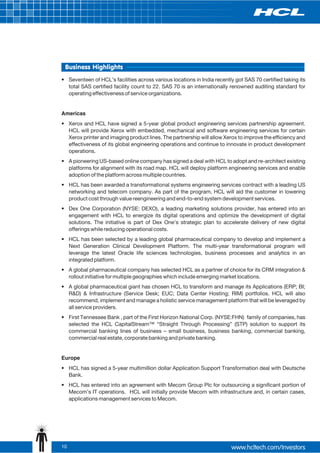
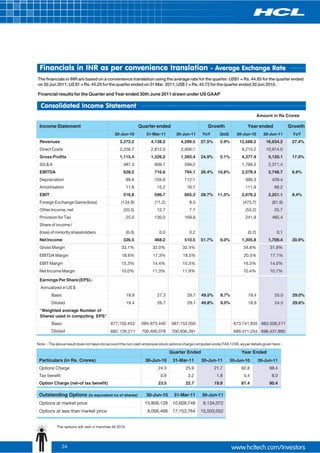
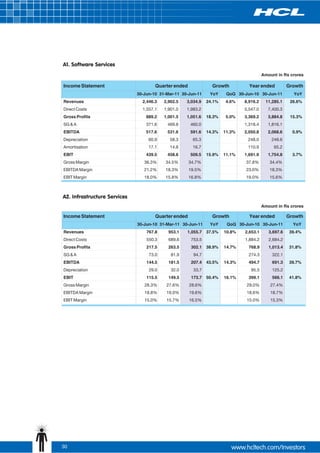
A. Consolidated IT Services (Software Services [A1] & Infrastructure services [A2])
Amount in US $ million
Income Statement Quarter ended Growth Year ended Growth
30-Jun-10 31-Mar-11 30-Jun-11 YoY QoQ 30-Jun-10 30-Jun-11 YoY
Revenues 692.1 864.7 915.2 32.2% 5.8% 2,490.7 3,350.2 34.5%
Direct Costs 453.8 581.0 612.3 1,600.3 2,254.9
Gross Profits 238.3 283.7 302.9 27.1% 6.8% 890.4 1,095.2 23.0%
SG & A 95.7 123.7 124.1 342.8 478.1
EBITDA 142.6 159.9 178.8 25.4% 11.8% 547.6 617.2 12.7%
Depreciation 19.4 20.2 22.2 73.9 83.6
Amortisation 3.7 3.3 3.7 23.7 14.6
EBIT 119.5 136.4 152.9 27.9% 12.1% 450.0 519.0 15.3%
Gross Margin 34.4% 32.8% 33.1% 35.7% 32.7%
EBITDA Margin 20.6% 18.5% 19.5% 22.0% 18.4%
EBIT Margin 17.3% 15.8% 16.7% 18.1% 15.5%
B. BPO Services
Amount in US $ million
Income Statement Quarter ended Growth Year ended Growth
30-Jun-10 31-Mar-11 30-Jun-11 YoY QoQ 30-Jun-10 30-Jun-11 YoY
Revenues 45.5 49.8 47.7 4.7% -4.4% 213.9 195.1 -8.8%
Direct Costs 39.8 40.4 38.5 164.5 158.2
Gross Profits 5.7 9.4 9.2 49.4 36.9
SG & A 10.8 11.0 10.1 43.9 46.1
EBITDA (5.2) (1.6) (0.9) 5.5 (9.1)
Depreciation 2.4 2.9 3.0 9.9 11.4
Amortisation (1.1) 0.1 - 0.1 0.5
EBIT (6.5) (4.5) (3.9) (4.5) (21.0)
Gross Margin 12.5% 18.9% 19.2% 23.1% 18.9%
15](https://image.slidesharecdn.com/hclt-q4-2011-amj11-irrelease-110727111102-phpapp01/85/HCL-Technologies-Q4-2011-IR-Release-15-320.jpg)
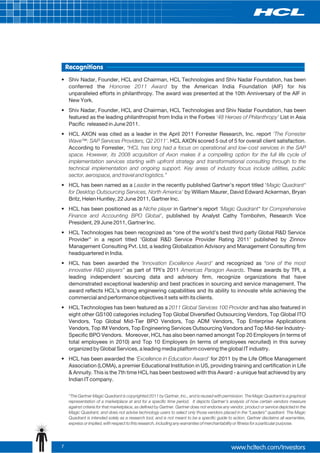
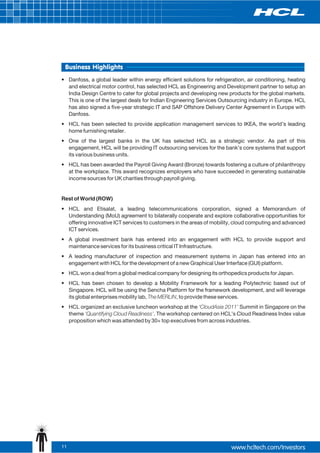
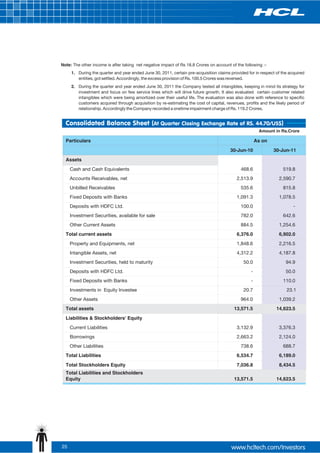
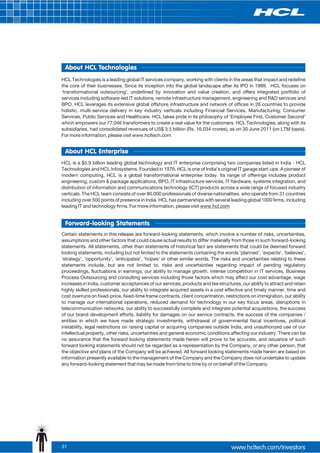
![Employee Metrics
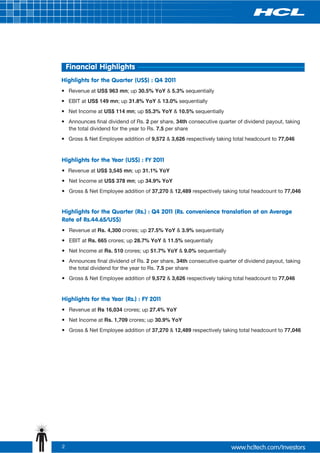
Manpower Details 30-Jun-10 31-Mar-11 30-Jun-11
Total Employee Count 64,557 73,420 77,046
IT Services (Software Services [A1] + 53,333 62,536 66,485
Infrastructure Services [A2])
Technical 47,716 56,188 59,944
Support 5,617 6,348 6,541
Gross Addition 8,293 4,407 7,086
Net Addition 5,409 1,617 3,949
Gross Lateral Employee Addition 6,854 3,457 3,781
Attrition (LTM)* - IT Services
(Software Services + Infrastructure Services) 15.7% 17.0% 16.5%
BPO Services - Total 11,224 10,884 10,561
Technical 9,864 10,022 9,677
Support 1,360 862 884
Gross Addition 3,295 3,127 2,486
Net Addition 1,019 (464) (323)
Gross Lateral Employee Addition 1,297 2,527 2,486
Offshore Attrition – Quarterly 15.3% 11.0% 9.2%
Offshore Attrition - Quarterly
(excluding attrition of joinees less than 6 months) 7.2% 8.5% 7.4%
* Excludes involuntary attrition
21](https://image.slidesharecdn.com/hclt-q4-2011-amj11-irrelease-110727111102-phpapp01/85/HCL-Technologies-Q4-2011-IR-Release-21-320.jpg)
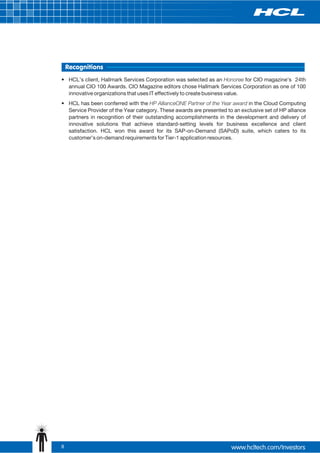
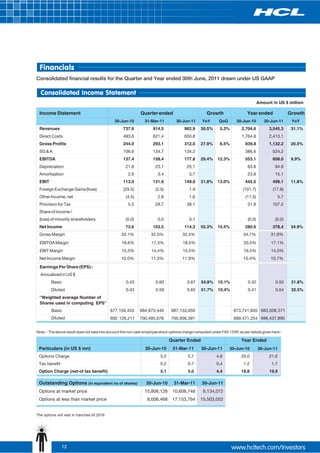
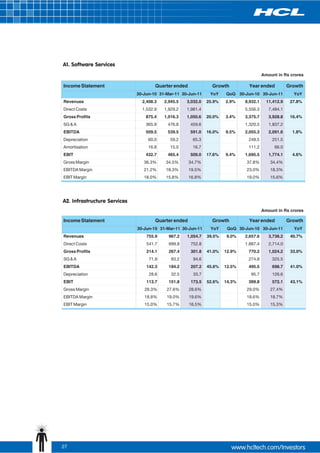
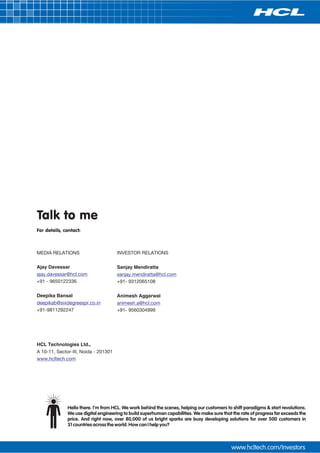
![Segment wise Profitability
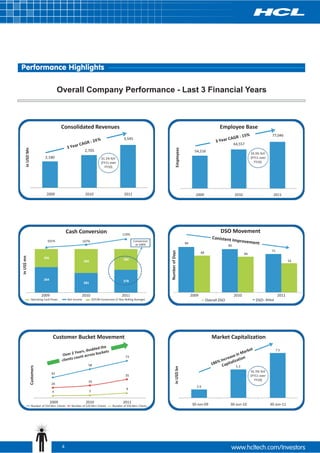
A. Consolidated IT Services (Software Services [A1] & Infrastructure Services [A2])
Amount in Rs crores
Income Statement Quarter ended Growth Year ended Growth
30-Jun-10 31-Mar-11 30-Jun-11 YoY QoQ 30-Jun-10 30-Jun-11 YoY
Revenues 3,164.1 3,912.7 4,086.7 29.2% 4.4% 11,589.7 15,151.1 30.7%
Direct Costs 2,074.6 2,629.0 2,734.2 7,443.8 10,198.1
Gross Profits 1,089.5 1,283.7 1,352.5 24.1% 5.4% 4,145.9 4,953.0 19.5%
SG & A 437.7 560.0 554.2 1,595.2 2,162.7
EBITDA 651.8 723.7 798.3 22.5% 10.3% 2,550.7 2,790.2 9.4%
Depreciation 88.6 91.6 99.0 344.2 378.1
Amortisation 16.8 15.0 16.7 111.2 66.0
EBIT 546.4 617.1 682.6 24.9% 10.6% 2,095.3 2,346.2 12.0%
Gross Margin 34.4% 32.8% 33.1% 35.8% 32.7%
EBITDA Margin 20.6% 18.5% 19.5% 22.0% 18.4%
EBIT Margin 17.3% 15.8% 16.7% 18.1% 15.5%
B. BPO Services
Amount in Rs crores
Income Statement Quarter ended Growth Year ended Growth
30-Jun-10 31-Mar-11 30-Jun-11 YoY QoQ 30-Jun-10 30-Jun-11 YoY
Revenues 208.0 225.6 212.8 2.3% -5.7% 998.5 883.1 -11.6%
Direct Costs 182.1 183.0 171.9 766.5 715.9
Gross Profits 25.9 42.6 40.9 232.0 167.2
SG & A 49.6 49.7 45.0 204.3 208.7
EBITDA (23.7) (7.1) (4.1) 27.7 (41.5)
Depreciation 11.0 13.0 13.2 46.1 51.4
Amortisation (5.0) 0.3 - 0.7 2.3
EBIT (29.6) (20.4) (17.3) (19.1) (95.1)
Gross Margin 12.5% 18.9% 19.2% 23.1% 18.9%
26](https://image.slidesharecdn.com/hclt-q4-2011-amj11-irrelease-110727111102-phpapp01/85/HCL-Technologies-Q4-2011-IR-Release-26-320.jpg)
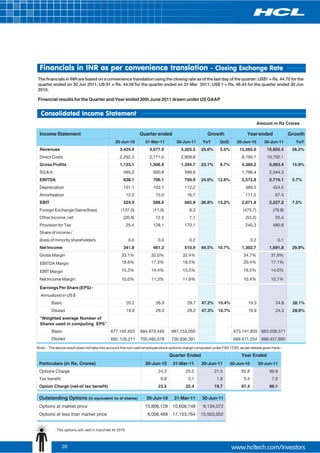
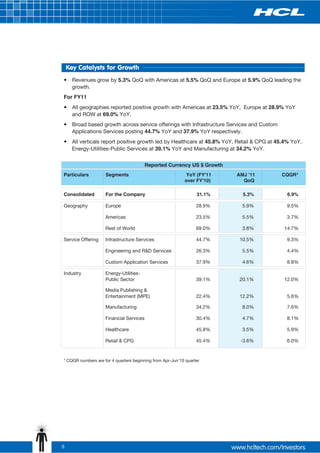
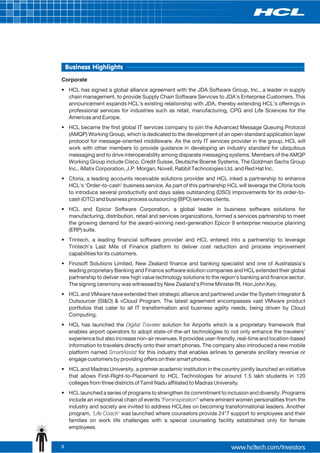
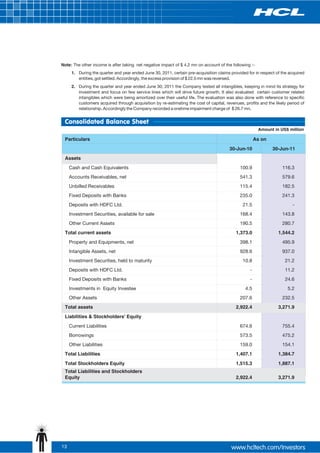
![Note: The other income is after taking net negative impact of Rs 18.8 Crores on account of the following :-
1. During the quarter and year ended June 30, 2011, certain pre-acquisition claims provided for in respect of the acquired
entities, got settled. Accordingly, the excess provision of Rs. 100.6 Crores was reversed.
2. During the quarter and year ended June 30, 2011 the Company tested all intangibles, keeping in mind its strategy for
investment and focus on few service lines which will drive future growth. It also evaluated certain customer related
intangibles which were being amortized over their useful life. The evaluation was also done with reference to specific
customers acquired through acquisition by re-estimating the cost of capital, revenues, profits and the likely period of
relationship. Accordingly the Company recorded a onetime impairment charge of Rs. 119.3 Crores.
Segment wise Profitability
A. Consolidated IT Services (Software Services [A1] & Infrastructure Services [A2])
Amount in Rs crores
Income Statement Quarter ended Growth Year ended Growth
30-Jun-10 31-Mar-11 30-Jun-11 YoY QoQ 30-Jun-10 30-Jun-11 YoY
Revenues 3,214.1 3,855.6 4,090.5 27.3% 6.1% 11,569.3 14,982.7 29.5%
Direct Costs 2,107.3 2,590.7 2,736.8 7,431.1 10,084.6
Gross Profits 1,106.7 1,265.0 1,353.7 22.3% 7.0% 4,138.2 4,898.1 18.4%
SG & A 444.6 551.8 554.7 1,592.7 2,138.2
EBITDA 662.1 713.2 799.0 20.7% 12.0% 2,545.5 2,759.9 8.4%
Depreciation 90.0 90.3 99.0 343.5 373.7
Amortisation 17.1 14.8 16.7 110.9 65.2
EBIT 555.0 608.1 683.2 23.1% 12.3% 2,091.0 2,321.0 11.0%
Gross Margin 34.4% 32.8% 33.1% 35.7% 32.7%
EBITDA Margin 20.6% 18.5% 19.5% 22.0% 18.4%
EBIT Margin 17.3% 15.8% 16.7% 18.1% 15.5%
B. BPO Services
Amount in Rs crores
Income Statement Quarter ended Growth Year ended Growth
30-Jun-10 31-Mar-11 30-Jun-11 YoY QoQ 30-Jun-10 30-Jun-11 YoY
Revenues 211.3 222.3 213.0 0.8% -4.2% 995.7 872.7 -12.3%
Direct Costs 185.0 180.3 172.1 764.6 707.5
Gross Profits 26.3 41.9 40.9 231.1 165.2
SG & A 50.3 49.0 45.1 203.8 206.1
EBITDA (24.0) (7.0) (4.1) 27.3 (40.8)
Depreciation 11.2 12.8 13.2 46.0 50.8
Amortisation (5.1) 0.3 - 0.6 2.2
EBIT (30.1) (20.1) (17.3) (19.3) (93.8)
Gross Margin 12.5% 18.9% 19.2% 23.1% 18.9%
29](https://image.slidesharecdn.com/hclt-q4-2011-amj11-irrelease-110727111102-phpapp01/85/HCL-Technologies-Q4-2011-IR-Release-29-320.jpg)

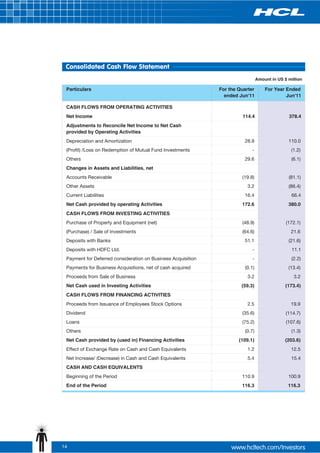
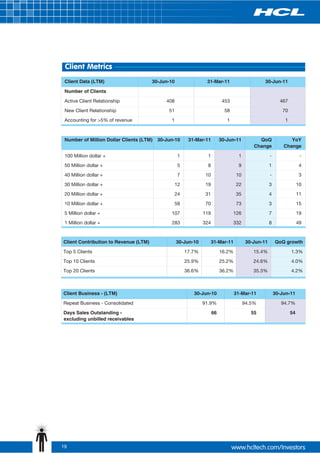
HCL Technologies reported strong financial results for Q4 FY2011 and full year FY2011. Q4 revenues were up 30.5% year-over-year to US$963 million and net income was up 55.3% to US$114 million. For the full year, revenues increased 31.1% to US$3,545 million and net income grew 34.9% to US$378 million. The company also saw increases in employee headcount and several key operating metrics. HCL's performance was driven by growth across geographies, service lines, and industry verticals.


![[ls머트리얼즈]LS Materials 417200 Algorithm Investment Report](https://cdn.slidesharecdn.com/ss_thumbnails/lsmaterials417200algorithminvestmentreport-260202182715-66072c7b-thumbnail.jpg?width=640&height=640&fit=bounds)


