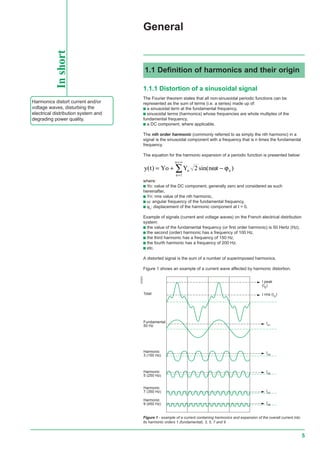
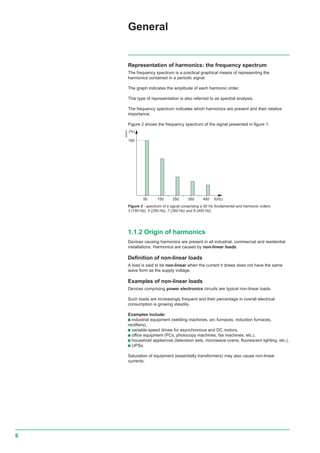
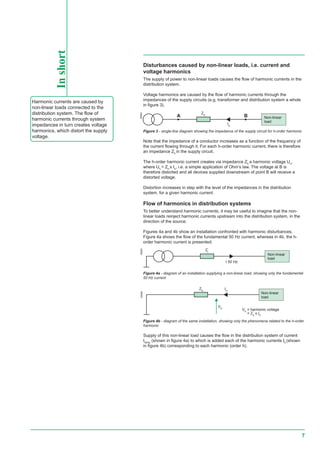
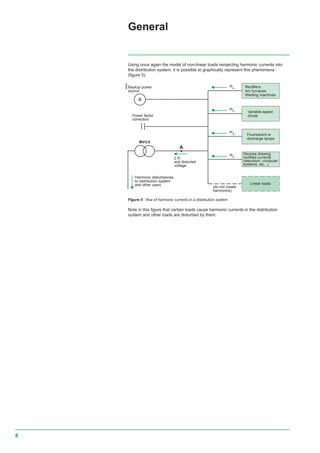
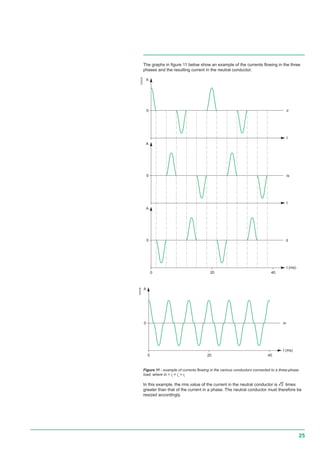
SlideShare a Scribd company logo
1 of 45
Download to read offline
M M M M
MMMM
M M M M
Harmonic detection
and filtering
Low-voltageexpertguidesN°4
1
1 General..................................................................................... 5
1.1 Definition of harmonics and their origin ............................................... 5
1.1.1 distortion of a sinusoidal signal......................................................................... 5
1.1.2 origin of harmonics ........................................................................................... 6
1.2 Why harmonics need to be detected and suppressed? ...................... 9
1.2.1 disturbances caused by harmonics .................................................................. 9
1.2.2 the economic impact of disturbances ............................................................... 9
1.2.3 increasingly serious consequences .................................................................. 9
1.2.4 practically speaking, which harmonics must be measured and reduced? ....... 9
2 The essential indicators of harmonic distortion
and measurement principles ..................................................... 10
2.1 Power factor ....................................................................................... 10
2.1.1 definition.......................................................................................................... 10
2.1.2 interpreting the value of the power factor ....................................................... 10
2.2 Crest factor......................................................................................... 10
2.2.1 definition.......................................................................................................... 10
2.2.2 interpreting the value of the crest factor ......................................................... 10
2.3 Power and harmonics .........................................................................11
2.3.1 active power .................................................................................................... 11
2.3.2 reactive power .................................................................................................11
2.3.3 distortion power .............................................................................................. 11
2.4 Frequency spectrum and harmonic content ...................................... 12
2.4.1 principle........................................................................................................... 12
2.4.2 individual harmonic distortion (or harmonic distortion of order h) .................. 12
2.4.3 frequency spectrum ........................................................................................ 12
2.4.4 RMS value ...................................................................................................... 12
2.5 Total harmonic distortion (THD) ......................................................... 13
2.5.1 definition of total harmonic distortion .............................................................. 13
2.5.2 current and voltage THD ................................................................................ 13
2.5.3 total harmonic factor (THF) ............................................................................. 13
2.5.4 relation between power factor and THD ......................................................... 14
2.6 Usefulness of the various indicators .................................................. 15
3 Measuring the values of the indicators .............................. 16
3.1 Measurement devices ........................................................................ 16
3.1.1 selection of a measurement device ................................................................ 16
3.1.2 functions of digital analysers .......................................................................... 16
3.1.3 operating principle of digital analysers and data-processing techniques ....... 16
3.2 Procedure for harmonic analysis of a distribution system ................. 17
3.3 Anticipating harmonic conditioning needs.......................................... 18
3.3.1 the advantages of permanently installed devices ........................................... 18
3.3.2 the advantages of integrated measurement and detection devices ............... 18
4 The main effects of harmonics in installations ................. 19
4.1 Resonance ......................................................................................... 19
4.2 Increased losses ................................................................................ 20
4.2.1 losses in conductors ....................................................................................... 20
4.2.2 losses in asynchronous machines .................................................................. 21
4.2.3 losses in transformers..................................................................................... 21
4.2.4 losses in capacitors ........................................................................................ 21
4.3 Overloads on installation equipment .................................................. 22
4.3.1 generators ....................................................................................................... 22
4.3.2 UPSs ............................................................................................................... 22
4.3.3 transformers .................................................................................................... 22
4.3.4 asynchronous machines ................................................................................. 23
4.3.5 capacitors........................................................................................................ 24
4.3.6 neutral conductors .......................................................................................... 24
Contents
2
3
4.4 Disturbances to sensitive loads ......................................................... 26
4.4.1 effects of supply-voltage distortion ................................................................. 26
4.4.2 disturbances on telephon lines ....................................................................... 26
4.5 Economic consequences ................................................................... 26
4.5.1 power losses ................................................................................................... 26
4.5.2 additional subscribed power costs .................................................................. 26
4.5.3 oversizing of equipment .................................................................................. 26
4.5.4 reduction in the service life of equipment ....................................................... 27
4.5.5 nuisance tripping and installation shutdown ................................................... 27
4.5.6 a few examples ............................................................................................... 27
5 Standards and the regulatory environment ....................... 28
5.1 Compatibility standards between distribution systems
and products ............................................................................................. 28
5.2 Distribution-system quality standards ................................................. 28
5.3 Standards on devices ......................................................................... 28
5.4 Maximum permissible harmonic values .............................................. 29
6 Solutions to attenuate harmonics ....................................... 30
6.1 General solutions ............................................................................... 30
6.1.1 positioning the disturbing loads upstream in the system ................................ 30
6.1.2 grouping the disturbing loads ......................................................................... 30
6.1.3 separating the sources ................................................................................... 31
6.1.4 using transformers with special connections .................................................. 31
6.1.5 installing inductors .......................................................................................... 31
6.1.6 selection of a suitable system earthing arrangement ..................................... 32
6.2 Solutions when limit values are exceeded ......................................... 33
6.2.1 passive filters .................................................................................................. 33
6.2.2 active filters (active harmonic conditioners).................................................... 33
6.2.3 hybrid filters .................................................................................................... 34
6.2.4 selection criteria .............................................................................................. 35
7 Harmonic-detection devices from Schneider Electric ...... 36
7.1 Detection ............................................................................................ 36
7.1.1 power meters .................................................................................................. 36
7.1.2 using power-meter data .................................................................................. 37
7.2 Selection guide................................................................................... 38
8 Harmonic-management solutions
from Schneider Electric.............................................................. 40
8.1 Analysis and diagnostics from Schneider Electric ............................. 40
8.2 Specific Schneider Electric products.................................................. 41
8.2.1 passive filters .................................................................................................. 41
8.2.2 active filters of MGE UPS SYSTEMS ............................................................. 41
8.2.3 hybrid filters .................................................................................................... 41
8.2.4 selection guide ................................................................................................ 42
Bibliography ................................................................................ 43
Contents
4
5
General
1.1.1 Distortion of a sinusoidal signal
The Fourier theorem states that all non-sinusoidal periodic functions can be
represented as the sum of terms (i.e. a series) made up of:
c a sinusoidal term at the fundamental frequency,
c sinusoidal terms (harmonics) whose frequencies are whole multiples of the
fundamental frequency,
c a DC component, where applicable.
The nth order harmonic (commonly referred to as simply the nth harmonic) in a
signal is the sinusoidal component with a frequency that is n times the fundamental
frequency.
The equation for the harmonic expansion of a periodic function is presented below:
y t Yo Y n tn n
n
n
( ) sin( )= + −
=
=∞
∑ 2
1
ω ϕ
where:
c Yo: value of the DC component, generally zero and considered as such
hereinafter,
c Yn: rms value of the nth harmonic,
c ω: angular frequency of the fundamental frequency,
c ϕn
: displacement of the harmonic component at t = 0.
Example of signals (current and voltage waves) on the French electrical distribution
system:
c the value of the fundamental frequency (or first order harmonic) is 50 Hertz (Hz),
c the second (order) harmonic has a frequency of 100 Hz,
c the third harmonic has a frequency of 150 Hz,
c the fourth harmonic has a frequency of 200 Hz,
c etc.
A distorted signal is the sum of a number of superimposed harmonics.
Figure 1 shows an example of a current wave affected by harmonic distortion.
Inshort
1.1 Definition of harmonics and their origin
Harmonics distort current and/or
voltage waves, disturbing the
electrical distribution system and
degrading power quality.
Figure 1 - example of a current containing harmonics and expansion of the overall current into
its harmonic orders 1 (fundamental), 3, 5, 7 and 9
E55522
Ih7
Harmonic
9 (450 Hz)
Harmonic
7 (350 Hz)
Harmonic
5 (250 Hz)
Harmonic
3 (150 Hz)
Fundamental
50 Hz
Total
Ih9
Ih5
Ih3
Ih1
I rms (IG
)
I peak
(Ic)
6
General
Representation of harmonics: the frequency spectrum
The frequency spectrum is a practical graphical means of representing the
harmonics contained in a periodic signal.
The graph indicates the amplitude of each harmonic order.
This type of representation is also referred to as spectral analysis.
The frequency spectrum indicates which harmonics are present and their relative
importance.
Figure 2 shows the frequency spectrum of the signal presented in figure 1.
Figure 2 - spectrum of a signal comprising a 50 Hz fundamental and harmonic orders
3 (150 Hz), 5 (250 Hz), 7 (350 Hz) and 9 (450 Hz)
1.1.2 Origin of harmonics
Devices causing harmonics are present in all industrial, commercial and residential
installations. Harmonics are caused by non-linear loads.
Definition of non-linear loads
A load is said to be non-linear when the current it draws does not have the same
wave form as the supply voltage.
Examples of non-linear loads
Devices comprising power electronics circuits are typical non-linear loads.
Such loads are increasingly frequent and their percentage in overall electrical
consumption is growing steadily.
Examples include:
c industrial equipment (welding machines, arc furnaces, induction furnaces,
rectifiers),
c variable-speed drives for asynchronous and DC motors,
c office equipment (PCs, photocopy machines, fax machines, etc.),
c household appliances (television sets, microwave ovens, fluorescent lighting, etc.),
c UPSs.
Saturation of equipment (essentially transformers) may also cause non-linear
currents.
E55523
15050 250 350 450 f(Hz)
100
(%)
7
Disturbances caused by non-linear loads, i.e. current and
voltage harmonics
The supply of power to non-linear loads causes the flow of harmonic currents in the
distribution system.
Voltage harmonics are caused by the flow of harmonic currents through the
impedances of the supply circuits (e.g. transformer and distribution system a whole
in figure 3).
E55524
Figure 3 - single-line diagram showing the impedance of the supply circuit for h-order harmonic
Note that the impedance of a conductor increases as a function of the frequency of
the current flowing through it. For each h-order harmonic current, there is therefore
an impedance Zh
in the supply circuit.
The h-order harmonic current creates via impedance Zh
a harmonic voltage Uh
,
where Uh
= Zh
x Ih
, i.e. a simple application of Ohm’s law. The voltage at B is
therefore distorted and all devices supplied downstream of point B will receive a
distorted voltage.
Distortion increases in step with the level of the impedances in the distribution
system, for a given harmonic current.
Flow of harmonics in distribution systems
To better understand harmonic currents, it may be useful to imagine that the non-
linear loads reinject harmonic currents upstream into the distribution system, in the
direction of the source.
Figures 4a and 4b show an installation confronted with harmonic disturbances.
Figure 4a shows the flow of the fundamental 50 Hz current, whereas in 4b, the h-
order harmonic current is presented.
E55525
Figure 4b - diagram of the same installation, showing only the phenomena related to the h-order
harmonic
Supply of this non-linear load causes the flow in the distribution system of current
I50Hz
(shown in figure 4a) to which is added each of the harmonic currents Ih
(shown
in figure 4b) corresponding to each harmonic (order h).
E55526
Zl
I 50 Hz
Non-linear
load
A
Zh B
Ih
Non-linear
load
Ih
Vh
Zh
Non-linear
load
Vh
= harmonic voltage
= Zs
x Ih
Inshort
Harmonic currents are caused by
non-linear loads connected to the
distribution system. The flow of
harmonic currents through system
impedances in turn creates voltage
harmonics, which distort the supply
voltage.
Figure 4a - diagram of an installation supplying a non-linear load, showing only the fundamental
50 Hz current
8
A
G
Ihe
Ihd
Ihb
Iha
Devices drawing
rectified currents
(television, computer
systems, etc...)
Fluorescent or
discharge lamps
Variable-speed
drives
Rectifiers
Arc furnaces
Welding machines
Linear loads
Backup power
source
Power factor
correction
(do not create
harmonics)
Harmonic disturbances
to distribution system
and other users
Σ Ih
and distorted
voltage
MV/LV
Using once again the model of non-linear loads reinjecting harmonic currents into
the distribution system, it is possible to graphically represent this phenomena
(figure 5).
E55527
General
Figure 5 - flow of harmonic currents in a distribution system
Note in this figure that certain loads cause harmonic currents in the distribution
system and other loads are disturbed by them.
9
1.2.1 Disturbances caused by harmonics
In distribution systems, the flow of harmonics reduces power quality and
consequently causes a number of problems:
c overloads on distribution systems due to the increase in the rms current,
c overloads on neutral conductors due to the summing of third-order harmonics
created by single-phase loads,
c overloads, vibrations and premature ageing of generators, transformers, motors,
etc., transformer hum,
c overloading and premature ageing of capacitors in power factor correction
equipment,
c distortion of the supply voltage, capable of disturbing sensitive loads,
c disturbances on communications networks and telephone lines.
1.2.2 The economic impact of disturbances
Harmonics have a significant economic impact, in that:
c premature ageing of equipment means that it must be replaced earlier, unless it
was oversized to begin with,
c overloads on the distribution system mean the level of subscribed power must be
increased, with additional losses, unless the installation can be upgraded,
c distortion of the current provokes nuisance tripping and shutdown of production
equipment.
These extra costs in terms of equipment, energy and productivity all contribute
to reducing the competitiveness of companies.
1.2.3 Increasingly serious consequences
As recently as ten years ago, harmonics were not considered a major problem,
because their effects on distribution systems were, generally speaking, relatively
slight. However, the massive increase in the use of loads employing power
electronics has significantly worsened the situation in all fields of activity.
Harmonics are all the more difficult to reduce in that they are often caused by
equipment that is vital to the operation of companies.
1.2.4 Practically speaking, which harmonics must be
measured and reduced ?
The harmonics most frequently encountered (and consequently the most
troublesome) on three-phase distribution systems are the odd-order harmonics (3rd,
5th, 7th, etc.).
Beyond the 50th order, harmonic currents are negligible and measurements are not
required.
Sufficient accuracy of measurements is obtained by taking into account harmonics
up to the 30th order.
Utilities monitor harmonic orders 3, 5, 7, 11 and 13.
It follows that conditioning of harmonics is imperative up to order 13 and ideally
should include harmonics up to order 25.
1.2 Why harmonics need to be detected
and suppressed?
10
The essential indicators
of harmonic distortion
and measurement principlesInshort
A number of indicators exist that
may be used to quantify and
assess the harmonic distortion of
current and voltage waves.
These indicators are:
c the power factor,
c the crest factor,
c the distortion power,
c the frequency spectrum,
c harmonic distortion.
These indicators are indispensable
in determining any corrective action
required.
The power factor will be noted “PF” in this document
2.1.1 Definition
The power factor is the ratio between the active power P and the apparent power S.
PF
P
S
=
In electrical jargon, the power factor is often confused with cosine phi (cos ϕ), which
may be defined by the equation:
cosϕ =
P
S
1
1
P1 = active power of the fundamental,
S1 = apparent power of the fundamental.
As the above equation makes clear, cos ϕ applies only to the fundamental frequency.
When harmonics are present, its value is different than that of the power factor.
2.1.2 Interpreting the value of the power factor
An initial indication that significant harmonic distortion exists is provided when the
measured power factor is not equal to cos ϕ (i.e. the power factor is less than cos ϕ).
2.1 Power factor
2.2 Crest factor
2.2.1 Definition
The crest factor is the ratio between the value of the peak current or voltage
(Im
or Um
) and the corresponding rms value.
k
I
I
m
rms
= or k
U
U
m
rms
=
For a sinusoidal signal, the crest factor is therefore equal to r.
For non-sinusoidal signals, the crest factor can be greater than or less than r.
This factor is particularly useful in drawing attention to exceptional peak values with
respect to the rms value.
2.2.2 Interpreting the value of the crest factor
A typical crest factor for the current drawn by non-linear loads is much greater than
r. Its value can range from 1.5 to 2 or even up to 5 in critical situations.
A very high crest factor indicates that high overcurrents occur from time to time.
These overcurrents, detected by the protection devices, may cause nuisance
tripping.
11
2.3.1 Active power
The active power P of a signal distorted by harmonics is the sum of the active
powers corresponding to the voltages and currents in the same frequency order.
The expansion of the voltage and current into their harmonic components may be
written as:
P U Ih h h
h
=
=
∞
∑ cosϕ
1
where ϕh is the displacement between voltage and current of harmonic order h.
Note:
c it is assumed that the signal does not contain a DC component, i.e. U0
= I0
= 0,
c when the signal is not distorted by harmonics, the equation P = U1
I1
cos ϕ1
again
applies, indicating the power of a sinusoidal signal, where cos ϕ1
is equal to “cos ϕ”.
2.3.2 Reactive power
Reactive power applies exclusively to the fundamental and is defined by the
equation:
Q = U1. .sinI1 1ϕ
2.3.3 Distortion power
Consider the apparent power S.
S U .Irms rms=
In the presence of harmonics, the equation becomes:
S U Ih
n
h
n
2 2
4
2
1
=












=
∞
=
∞
∑ ∑.
Consequently, in the presence of harmonics, the equation S2
=P2
+Q2
is no longer
valid. The distortion power D is defined as S2
=P2
+Q2
+D2
, i.e.:
D S P Q= − −2 2 2
2.3 Power and harmonics
12
H %
100
33
20
10 h2 3 4 5 6
2.4.1 Principle
Each device causing harmonics has its own harmonic-current "fingerprint", with
different amplitudes and displacements.
These values, notably the amplitude of each harmonic order, are essential elements
for analysis of harmonic distortion.
2.4.2 Individual harmonic distortion (or harmonic
distortion of order h)
Individual harmonic distortion is defined as the level of distortion, in percent, of order
h, with respect to the fundamental:
u
U
U
h
h
(%) = 100
1
or i
I
I
h
h
(%) = 100
1
2.4.3 Frequency spectrum
By plotting the amplitude of each harmonic order on a graph, we obtain a graphical
representation of the frequency spectrum. This technique is referred to as spectral
analysis.
Figure 6 shows the spectral analysis of a square-wave signal.
2.4 Frequency spectrum and harmonic
content
E55531
U(t)
1
t
E55530
The essential indicators
of harmonic distortion
and measurement principles
Figure 6 - spectral analysis of a square-wave signal, for voltage U t( )
2.4.4 RMS value
The rms value of a current or voltage is calculated on the basis of the rms values of
the various harmonic orders.
I Ieff h
h
=
=
∞
∑ 2
1
U Ueff h
h
=
=
∞
∑ 2
1
rms
rms
13
Inshort
THD stands for Total Harmonic
Distortion.
The level of harmonic distortion is
often used to define the degree of
harmonic content in an alternating
signal.
2.5.1 Definition of total harmonic distortion
For a signal y, the total harmonic distortion (THD) is defined by the equation:
THD
y
y
h
h
= =
∞
∑ 2
2
1
This definition complies with that of standard IEC 61000-2-2.
Note that the resulting value may exceed one.
According to the standard, h can generally be limited to 50. This equation produces a
single value indicating the distortion of a voltage or a current flowing at a given point
in a distribution system.
Harmonic distortion is generally expressed as a percentage.
2.5.2 Current and voltage THD
When dealing with current harmonics, the equation becomes:
THD
I
I
I
h
h
= =
∞
∑ 2
2
1
The above equation is equivalent to the one below, which is more direct and easier
to use when the total rms value is known:
THD
I
I
I
eff
=





 −
1
2
1
When dealing with voltage harmonics, the equation becomes:
THD
u
U
u
h
h
= =
∞
∑ 2
2
1
2.5.3 Total harmonic factor (THF)
In certain countries with different work habits, a different equation is used to determine
harmonic distortion. In this equation, the value of the fundamental voltage U1
or the
fundamental current I1
is replaced by the rms values Urms
and Irms
respectively.
To distinguish between the two equations, we will call the second the total harmonic
factor (THF).
Example of a voltage THF:
THF
U
U
u
h
h
eff
= =
∞
∑ 2
2
The total harmonic factor, whether for voltage or current, is always less than 100%. It
makes analogue measurements of signals easier but is used less and less because
the result is very close to the THD defined above when a signal is not significantly
distorted. What is more, it not well suited to highly distorted signals because it
cannot exceed the value of 100%, contrary to the THD defined at the beginning of
this section.
2.5 Total harmonic distortion (THD)
rms
rms
14
100500 THDi (%)100
0.6
0.4
PF/cos ϕ
0.2
0.8
1
1.2
2.5.4 Relation between power factor and THD
When the voltage is sinusoidal or virtually sinusoidal, it may be said that:
P P U I# . .cos1 1 1 1= ϕ
Consequently: FP
P
S
U I
U Ieff
= #
. .cos
.
1 1 1
1
ϕ
or :
I
I THDeff I
1
2
1
1
=
+
hence: FP
THDI
#
cosϕ1
2
1+
Figure 7 shows a graph of PF / cos ϕ as a function of THDi.
PF / cos ϕ = f (THDi)
E55528
The essential indicators
of harmonic distortion
and measurement principles
Figure 7 - variation of PF / cos ϕ as a function of THDi, where THDu = 0
PF
rms
PF
rms
15
Inshort
The primary indicator is the THD, a
single value that reflects the level of
distortion in voltage and current
waves.
The harmonic spectrum provides a
"fingerprint" of the distorted signal.
c The voltage THD indicates the distortion of the voltage wave.
The measured THDu can provide information on phenomena observed in the
installation. A THDu value of less than 5% is considered normal and there is virtually
no risk of equipment malfunctions.
A THDu value between 5% and 8% indicates significant harmonic distortion. Some
equipment malfunctions may occur.
A THDu value higher than 8% indicates high harmonic distortion. Equipment
malfunctions are probable. In-depth analysis is required and an attenuation system
must be installed.
c The current THD indicates the distortion of the current wave.
To identify the load causing the disturbance, the current THD must be measured on
the incomer and the outgoers of the different circuits.
The measured THDi can provide information on phenomena observed in the
installation. A THDi value of less than 10% is considered normal and there is virtually
no risk of equipment malfunctions.
A THDi value between 10% and 50% indicates significant harmonic distortion.
Temperature rise may occur, which means cables and sources must be oversized.
A THDi value higher than 50% indicates high harmonic distortion. Equipment
malfunctions are probable. In-depth analysis is required and an attenuation system
must be installed.
c The power factor PF indicates the extent to which the source of the installation
must be oversized.
c The crest factor is used to determine the capacity of a generator (UPS or
generator) to provide high instantaneous currents. For example, computers draw
highly distorted current with crest factors that may reach 3 or even 5.
c The spectrum (signal broken down into frequency) provides a different view of
electrical signals and may be used to assess distortion.
2.6 Usefulness of the various indicators
16
3.1.1 Selection of a measurement device
Only digital analysers, based on recent technology, provide sufficiently accurate
measurements for the indicators presented above.
Other measurement devices were used in the past.
c oscilloscopes for observation purposes
A general indication of the distortion of a signal may be obtained by viewing the
current or the voltage on an oscilloscope.
When the wave form is not sinusoidal, the signal is distorted by harmonics. The
voltage and current peaks can be displayed.
Note that using an oscilloscope, it is not possible to precisely quantify the harmonic
components.
c analogue spectral analysers
Implementing old technology, these devices are made up of a passband filter
combined with an rms voltmeter.
These devices, now outdated, produce mediocre results and do not provide any
information on displacement.
3.1.2 Functions of digital analysers
The microprocessors used in digital analysers:
c calculate the values of the harmonic indicators (power factor, crest factor,
distortion power, THD),
c offer a number of additional functions (correction, statistical detection,
management of measurements, display, communication, etc.),
c when they are multi-channel devices, provide simultaneously and nearly in real
time the spectral breakdown of voltage and current.
3.1.3 Operating principle of digital analysers and
data-processing techniques
Analogue signals are converted into a series of digital values.
On the basis of the digital values, an algorithm implementing the Fast Fourier
Transform (FFT) calculates the amplitude and the phases of the harmonics over a
large number of observation time windows.
Most digital analysers measure harmonics up to the 20th or 25th order for calculation
of the THD.
Processing of the various values calculated using the FFT algorithm (smoothing,
classification, statistics) can be carried out by the measurement device or by
external software.
3.1 Measurement devices
Measuring the values
of the indicators
17
Measurements are carried out on industrial and commercial sites as a:
c preventive measure:
v to obtain an overall assessment of the extent of the problem (map of the
distribution system),
c remedial measure:
v to determine the origin of a disturbance and devise solutions to correct the
problem,
v to check that the solutions implemented actually produced the desired effect.
Operating mode
Voltage and current measurements must be carried out:
c at the power source,
c on the incoming busbars of the main distribution switchboard,
c on each of the outgoers leaving the main distribution switchboard.
When the measurements are carried out, it is necessary to have precise information
on the conditions, in particular the status of capacitor banks (ON or OFF, number of
stages connected).
On the basis of analysis results, it may be necessary to:
c derate any future equipment installed,
or
c quantify the protection and harmonic-filtering solutions that must be installed,
c compare the values measured to the reference values of the utility (harmonic-
distortion limits, acceptable values, reference values).
Use of measurement devices
The devices show both the instantaneous effects and the long-term effects of
harmonics.
Correct analysis requires integrated values over time spans ranging from a few
seconds to a few minutes, for observation periods of a few days.
The required values are:
c the amplitude of voltage and current harmonics,
c the individual harmonic distortion of each order, for both current and voltage,
c total harmonic distortion for both current and voltage,
c where applicable, the displacement between voltage and current harmonics of the
same order and the phase of the harmonics with respect to a common reference (the
fundamental voltage, for example).
3.2 Procedure for harmonic analysis
of a distribution system
18
The harmonic indicators can be measured:
c by permanently installed devices,
c by an expert present at least a half-day on the site (for a view limited in time).
3.3.1 The advantages of permanently installed
devices
For a number of reasons, it is preferable to use devices installed permanently in the
distribution system.
c a visit by an expert is necessarily limited in time, whereas measurements at
different points in the installation over a sufficiently long period (one week to one
month) provide an overall view of system operation and cover all the situations that
may arise following:
v fluctuation of the power source,
v variations in system operation,
v installation of new equipment.
c measurement devices installed in the distribution system prepare and facilitate
troubleshooting by experts, thus reducing the number and duration of their visits.
c permanently installed measurement devices detect any new disturbances
caused by the installation of new equipment, by new operating modes or by
fluctuations on the distribution system.
3.3.2 The advantages of integrated measurement
and detection devices
Measurement and detection devices that are built into the electrical distribution
equipment offer a number of advantages.
c for an overall assessment of the distribution system (preventive measure),
they avoid:
v renting the measurement devices,
v hiring the services of experts,
v having to connect and disconnect all the measurement devices.
In an overall assessment of the distribution system, an analysis at the main low-
voltage switchboard level can commonly be carried out by the incoming device and/
or the measurement devices built into each outgoing device.
c for an assessment in view of remedial action, they:
v indicate the operating conditions when the incident occurred,
v provide a “map” of the installation and indications on the selected solution.
A full diagnosis will often also require additional information provided by specific
equipment suited to the problem at hand.
3.3 Anticipating harmonic conditioning
needs
Measuring the values
of the indicators
19
Ih
Ls
C
Non-linear
load
Capacitor
bank
Linear
load
Inshort
Harmonics have a major economic
impact on installations in that they
cause:
c higher energy bills,
c premature ageing of equipment,
c drops in productivity.
4.1 Resonance
The main effects of harmonics
in installations
The use of both capacitive and inductive devices in distribution systems leads to
resonance phenomena, resulting in extremely high or low impedance values. These
variations in impedance modify the current and voltage in the distribution system.
Here we will discuss only parallel-resonance phenomena, which are the most
frequent.
Consider the simplified diagram below, showing an installation made up of:
c a transformer supplying power,
c linear loads,
c non-linear loads causing harmonic currents,
c power factor correction capacitors.
E56828
For harmonic-analysis purposes, the equivalent diagram is shown below:
E56976
Ls C R Ih
Z
Z
jL
L C
s
s
=
−
ω
ω1 2
when R is neglected
Resonance occurs when the denominator 1-LsCω2
approaches zero. The
corresponding frequency is called the resonant frequency of the circuit. At this
frequency, the impedance is at its maximum value, resulting in considerable voltage
harmonics and consequently major voltage distortion. This voltage distortion is
accompanied by the circulation of harmonic currents in the Ls + C circuit which are
greater than the injected harmonic currents.
The distribution system and the power factor correction capacitors are subjected to
considerable harmonic currents, resulting in the risk of overloads.
Ls: supply inductance (distribution system
+ transformer + line)
C: power factor correction capacitance
R: resistance of the linear loads
Ih: harmonic current
20
The main effects of harmonics
in installations
0 20 40 60 80 100 120
1
1.2
1.4
1.6
1.8
2
2.2
0.8
THD
(%)
P Joules
I rms
4.2 Increased losses
4.2.1 Losses in conductors
The active power transmitted to a load depends on the fundamental current. When
the current drawn by the load contains harmonics, the rms value of the current (Irms
)
is greater than the fundamental I1
.
With THD defined as:
THD
I
I
eff
=





 −
1
2
1
it may be deduced that:
I I THDeff = +1
2
1
Figure 8 below shows, as a function of the harmonic distortion:
c the increase in the rms current (Irms
) for a load drawing a given fundamental
current,
c the increase in the Joule losses (PJoules), without taking into account the skin
effect.
(The reference point for Irms
and PJoules with no harmonics is set to 1 on the graph).
E55532
Figure 8 - increase in rms current and Joule losses as a function of THD
Current harmonics provoke an increase in Joule losses in all the conductors through
which they flow and additional temperature rise in the transformers, circuit breakers,
cables, etc.
rms
rms
21
19,1)13.()11.()7.()5.(1
.13..13..
.11..11..
.7..7..
.5..5..
..
2
13
2
11
2
7
2
5
1
2
1131313
1111111
1777
1555
11
=++++=
=
==
==
==
==
=
∑
uuuu
I
I
II
IuCUI
IuCUI
IuCUI
IuCUI
CUI
eff
heff
ω
ω
ω
ω
ω
4.2.2 Losses in asynchronous machines
Voltage harmonics, when applied to asynchronous machines, provoke the flow of
currents with frequencies higher than 50 Hz in the rotor. These currents cause
additional losses that are proportional to Uh
2
/h.
c Estimating the losses:
v a virtually square-wave supply voltage provokes a 20% increase in losses,
v a supply voltage with the following levels of individual harmonic distortion (uh
):
where U1
is the fundamental voltage:
- u5
: 8% of U1
,
- u7
: 5% of U1
,
- u11
: 3% of U1
,
- u13
: 1% of U1
,
(i.e. a voltage THD of 10%) results in additional losses of 6%.
4.2.3 Losses in transformers
Harmonic currents flowing in transformers provoke increased losses in the windings
through the Joule effect and increased iron losses due to eddy currents.
What is more, voltage harmonics cause iron losses due to hysterisis.
Roughly speaking, it may be said that the losses in the windings increase as the
square of the current THD, and losses in the core increase linearly with the voltage
THD.
c Estimating the losses:
v the increase in losses represents 10% to 15% for public-distribution
transformers, where distortion levels relatively low.
4.2.4 Losses in capacitors
Harmonic voltage, when applied to capacitors, provokes the flow of currents that are
proportional to the frequency of the harmonics. These currents cause additional
losses.
c Example:
Consider a supply voltage with the following levels of individual harmonic distortion
(uh
): where U1
is the fundamental voltage:
- u5
: 8% of U1
,
- u7
: 5% of U1
,
- u11
: 3% of U1
,
- u13
: 1% of U1
,
(i.e. a voltage THD of 10%).
rms
rms
In this example, Joule losses are multiplied by 1.192
= 1.4.
.
22
0 20 40 60 80 100
10
20
0
kVA
(%)
30
40
50
60
70
80
90
100
%
electronic
load
4.3 Overloads on installation equipment
4.3.1 Generators
Generators supplying non-linear loads must be derated due to the additional losses
caused by the harmonic currents. The derating coefficient is approximately 10%
for a generator supplying a set of loads in which 30% are non-linear loads. As a
result, the generator must be oversized.
4.3.2 UPSs
The current drawn by computer equipment has a high crest factor. A UPS sized
taking into account only the rms current value may not be capable of supplying the
required peak current and thus be overloaded.
4.3.3 Transformers
c The curve in figure 9 below shows typical derating values for a transformer
supplying electronic (i.e. non-linear) loads.
E55533
The main effects of harmonics
in installations
Figure 9 - derating values for a transformer supplying electronic loads
Example: a transformer supplying loads that are 40% electronic must be derated
40 %.
23
c Standard UTE C15-112 indicates a derating factor for transformers calculated as a
function of the harmonic currents:
1
40
2
26,1
..1,01
1
I
I
T
Th
k
h
h
h
h
=






+
=
∑=
Typical values:
v “square-wave” current (spectrum inversely proportional to h (*)): k = 0.86,
v current drawn by a frequency converter (THD ≈ 50%): k = 0.80.
(*) in fact, the current wave form is approximately that of a square wave form. This is the case for
all current rectifiers (three-phase rectifiers, induction furnaces, etc.).
c “K factor”:
Standard ANSI C57.110 defines a derating method based on the “K factor”, with the
equation below.
K
I h
I
I
I
h
h
h
h
h
h
effh
= =






=
∞
=
∞
=
∞∑
∑
∑
2 2
1
2
1
2
2
1
.
.
The K factor produces more severe derating and is widely used in North America.
In the example presented below, the resulting “K factor” is 13.
Order h Ih
(%)
5 30
7 20
11 14
13 11
17 8
19 7
23 5
25 4
The increase in cost for a transformer sized using the “K factor” varies from 30% to
60% depending on the rating, in a range from 15 to 500 kVA.
4.3.4 Asynchronous machines
Standard IEC 60892 defines a weighted harmonic voltage factor (HVF) for which the
equation and the maximum permissible value are presented below:
HVF
U
h
h
h
= ≤
=
∑
∆
2
2
13
0 02,
c Example:
Consider a supply voltage with the following levels of individual harmonic distortion
(uh
): where U1
is the fundamental voltage:
- u3
: 2 % de U1
,
- u5
: 3 % de U1
,
- u7
: 1 % de U1
,
(i.e. a voltage THD of 3.7% and a HVF of 0.018).
In this example, the harmonic voltage factor is very close to the maximum value at
which the machine must be derated.
Practically speaking, an asynchronous machine must not be supplied with power
having a THDu greater than 10%.
rms
.
24
4.3.5 Capacitors
According to standards, the rms current flowing in capacitors must not exceed 1.3
times the rated current.
c Example (already presented above):
Consider a supply voltage with the following levels of individual harmonic distortion
(uh
): where U1
is the fundamental voltage:
- u5
: 8 % de U1
,
- u7
: 5 % de U1
,
- u11
: 3 % de U1
,
- u13
: 1 % de U1
,
(i.e. a voltage THD of 10%).
as a result
I
I
eff
1
1 19= , , at the rated voltage.
At a voltage level equal to 1.1 times the rated voltage,
I
I
eff
1
1 3= , the maximum
current level is overrun and the capacitors must be resized.
4.3.6 Neutral conductors
Consider a system made up of a balanced three-phase source and three identical
single-phase loads connected phase-to-neutral.
E55534
Is
Ir
It
In
Source
Load
Load
Load
The main effects of harmonics
in installations
Figure 10 - flow of currents in the various conductors connected to a three-phase source
rms
rms
.
.
25
0
A
0
A
0
A
20 400
it
t (ms)
is
t
ir
t
E55535
0
A
20 400
in
t (ms)
E55536
The graphs in figure 11 below show an example of the currents flowing in the three
phases and the resulting current in the neutral conductor.
Figure 11 - example of currents flowing in the various conductors connected to a three-phase
load, where In = ir
+ is
+ it
In this example, the rms value of the current in the neutral conductor is e times
greater than that of the current in a phase. The neutral conductor must therefore be
resized accordingly.
26
4.5 Economic consequences
4.5.1 Power losses
The Joule effect, induced by harmonic currents in the conductors and equipment,
causes additional power losses.
4.5.2 Additional subscribed power costs
The presence of harmonic currents makes it necessary to increase the subscribed
power level and, consequently, the cost of the subscription.
What is more, utilities will be increasingly inclined in the future to transfer costs to the
producers of harmonic disturbances.
4.5.3 Oversizing of equipment
c Derating of power sources (generators, transformers and UPSs) means they must
be oversized.
c Conductors must be sized taking into account the flow of harmonic currents.
Because the frequencies of the harmonics are higher than that of the fundamental,
the impedances encountered by these currents are higher. To avoid excessive
losses due to the Joule effect, the conductors must be oversized.
c The circulation of harmonic currents in the neutral conductor means the conductor
must be oversized.
The main effects of harmonics
in installations
4.4 Disturbances to sensitive loads
4.4.1 Effects of supply-voltage distortion
c Distortion of the supply voltage may disturb operation of sensitive loads, including:
v regulation systems (temperature, etc.),
v computer equipment,
v control and monitoring systems (protection relays).
4.4.2 Disturbances on telephone lines
c Harmonics can induce disturbances in circuits conducting low currents. The
degree of disturbance depends on the distance over which the power and signal
lines run in parallel, the distance between the lines and the frequency of the
harmonics.
27
4.5.4 Reduction in the service life of equipment
(Data obtained from the Canadian Electrical Association).
When distortion of the supply voltage is in the 10% range, equipment service life is
significantly reduced. Depending on the type of device, the reduction in service life
may be estimated at:
c 32.5% for single-phase machines,
c 18% for three-phase machines,
c 5% for transformers.
To maintain the service life observed with a normal supply voltage, devices must be
oversized.
4.5.5 Nuisance tripping and installation shutdown
Installation circuit breakers are subjected to current peaks caused by harmonics.
These current peaks cause nuisance tripping and result in production losses as well
as costs corresponding to the time required to put the installation back into running
order.
4.5.6 A few examples
For the installations in the examples below, the significant economic consequences
made necessary the use of harmonic filters.
c Computer centre of an insurance company:
In this computer centre, nuisance tripping of a circuit breaker caused a loss
estimated at 100 000 euros per hour of down time.
c Pharmaceutical laboratory:
Harmonics provoked the failure of an engine generator set and interruption of a very
lengthy test phase on a new product. The estimated loss amounted to 17 million
euros.
c Metallurgy factory:
Induction furnaces provoked overloads causing irreversible damage to three
transformers ranging from 1500 to 2500 kVA in one year, and production losses
estimated at 20 000 euros per hour.
c Garden-furniture factory:
Failure of variable-speed drives provoked production losses estimated at 10 000
euros per hour.
28
Standards and the regulatory
environment
Inshort
Harmonic levels are governed by a
series of standards and regulations:
c compatibility standards for
distribution systems.
c standards setting limit values for
devices causing harmonics.
c recommendations issued by
utilities and applicable to
installations.
In order to rapidly reduce the effects of harmonic disturbances, a three-part system
of standards and regulations is now in force. This system is presented below.
5.3 Standards on devices
c IEC 61000-3-2 or EN 61000-3-2 for low-voltage devices drawing less than 16 A,
c IEC 61000-3-4 or EN 61000-3-4 for low-voltage devices drawing more than 16 A.
5.1 Compatibility standards between
distribution systems and products
These standards stipulate a number of criteria concerning compatibility between
distribution systems and products, such that:
c the harmonic disturbances caused by a device in the system must not exceed the
set limits,
c each device must be capable of operating normally in the presence of
disturbances at least equal to the set limits.
c IEC 1000-2-2 for low-voltage public distribution systems,
c IEC 1000-2-4 for low-voltage and medium-voltage industrial installations.
5.2 Distribution-system quality standards
c Standard EN 50160 stipulates the characteristics of the voltage supplied by low-
voltage public distribution systems,
c Standard IEEE 519 (Recommended practices for harmonic control in electrical
power systems) is a joint approach between utilities and their customers to limit the
impact of non-linear loads.
What is more, utilities encourage preventive action to limit the impact on the quality
of electricity, temperature rise and reductions in the power factor. They are also
considering applying financial penalties to those customers producing disturbances.
29
5.4 Maximum permissible harmonic values
On the basis of data drawn from a number of international studies, it was possible to
estimate the typical harmonic values encountered in distribution systems.
Formulated on the basis of work carried out by the CIGRE organisation, the table
below reflects the opinion of a large number of utilities concerning harmonic limits
that should not be exceeded.
Odd harmonics, non-multiples of 3 Odd harmonics, multiples of 3 Even harmonics
Order h LV MV VHV Order h LV MV VHV Order h LV MV VHV
5 6 6 2 3 5 2.5 1.5 2 2 1.5 1.5
7 5 5 2 9 1.5 1.5 1 4 1 1 1
11 3.5 3.5 1.5 15 0.3 0.3 0.3 6 0.5 0.5 0.5
13 3 3 1.5 21 0.2 0.2 0.2 8 0.5 0.2 0.2
17 2 2 1 >21 0.2 0.2 0.2 10 0.5 0.2 0.2
19 1.5 1.5 1 12 0.2 0.2 0.2
23 1.5 1 0.7 >12 0.2 0.2 0.2
25 1.5 1 0.7
>25 0.2+25h 0.2+25h 0.1+25h
30
no
Sensitive
loads
Line impedance
Disturbing
load 1
Disturbing
load 2
yes
Inshort
There are three different types of
solutions that may be used to
attenuate the effects of harmonics:
c modifications to the installation,
c use of special devices in the power
supply system (inductors, special
transformers),
c filters.
6.1 General solutions
To limit the propagation of harmonics in the distribution system, a number of
measures may be taken, particularly when designing a new installation.
6.1.1 Positioning the disturbing loads upstream in
the system
The overall level of harmonic disturbance increases as the short-circuit power
decreases.
Economic considerations aside, it is therefore preferable to connect the disturbing
loads as far upstream as possible (see figure 13a).
E55537
Figure 13a - supply of non-linear loads as far upstream as possible (recommended diagram)
6.1.2 Grouping the disturbing loads
When preparing the single-line diagram, separate where possible the disturbing
equipment from the other loads (see figure 13b). Practically speaking, the different
types of loads should be supplied by different busbars.
By grouping the disturbing loads, the possibilities of angular recomposition are
increased. The reason is that the vector sum of the harmonic currents is lower than
their algebraic sum.
An effort should also be made to avoid the flow of harmonic currents in the cables,
thus limiting voltage drops and temperature rise in the cables.
E55538
Z2
Z1
Sensitive
loads
Disturbing
load
Where Z1 < Z2
Z1
< Z2
Figure 13b - grouping of non-linear loads and supply as far upstream as possible
(recommended diagram)
Solutions to attenuate
harmonics
31
h11, h13
h5, h7, h11, h13
h5, h7, h11, h13
Non-linear
loads
Linear
loads
MV
distribution
system
6.1.3 Separating the sources
In efforts to attenuate harmonics, an additional improvement may be obtained by
supplying the different loads via different transformers, as indicated in the simplified
diagram below (figure 14).
E55539
Figure 14 - supply of the disturbing loads via a separate transformer
This disadvantage of this solution is the increase in the cost of the installation.
6.1.4 Using transformers with special connections
Special types of connection may be used in transformers to eliminate certain
harmonic orders.
The harmonic orders eliminated depend on the type of connection implemented:
c a delta-star-delta connection eliminates harmonic orders 5 and 7 (see figure 15),
c a delta-star connection eliminates harmonic order 3 (the harmonics flow in each of
the phases and loop back via the transformer neutral),
c a delta-zigzag5
connection eliminates harmonic order 5 (loop back via the
magnetic circuit).
E55543
Figure 15 - a delta-star-delta transformer prevents propagation of harmonic orders 5 and 7
upstream in the distribution system
6.1.5 Installing inductors
In installations comprising variable-speed drives, the current can be smoothed by
installing line inductors. By increasing the impedance of the supply circuit, the
harmonic current is limited.
Use of harmonic inductors on capacitor banks is a means of increasing the
impedance of the inductor and capacitor assembly, for harmonics with high
frequencies.
32
Solutions to attenuate
harmonics
6.1.6 Selection of a suitable system earthing
arrangement
c TNC system.
In TNC systems, a single conductor, the PEN, ensures protection in the event of an
earth fault and carries imbalance currents.
Under steady-state conditions, the harmonic currents flow through the PEN.
However, the PEN has a certain impedance, resulting in slight voltage differences (a
few volts) between devices which may lead to malfunctions of electronic equipment.
The TNC system must therefore be used only for the supply of power circuits on the
upstream end of installations and must never be used for the supply of sensitive
loads.
c TNS system.
This system is recommended when harmonics are present.
The neutral conductor and the protection conductor PE are completely separate,
thus ensuring a much more stable voltage on the distribution system.
33
I har
Non-linear
load
Filter
Inshort
In cases where the preventive
measures presented above are not
sufficient, the installation must be
equipped with filters.
There are three types of filters:
c passive filters,
c active filters,
c hybrid filters.
6.2 Solutions when limit values are
exceeded
6.2.1 Passive filters
c Typical applications:
v industrial installations comprising a set of devices causing harmonics with a total
power rating greater than approximately 200 kVA (variable-speed drives, UPSs,
rectifiers, etc.),
v installations where power factor correction is required,
v situations where voltage distortion must be reduced to avoid disturbing sensitive
loads,
v situations where current distortion must be reduced to avoid overloads.
c Operating principle:
An LC circuit, tuned to each of the harmonic frequencies requiring filtering, is
installed in parallel with the device causing the harmonic distortion (see figure 16).
This bypass circuit draws the harmonics, thus avoiding the flow of harmonics to the
power source.
E55540
Figure 16 - operating principle of a passive filter
Generally speaking, the passive filter is tuned to a harmonic order near the one to be
eliminated. A number of parallel-connected filters may be used when a significant
reduction in distortion over a range of orders is required.
6.2.2 Active filters (active harmonic conditioners)
c Typical applications:
v commercial installations comprising a set of devices causing harmonics with a total
power rating less than 200 kVA (variable-speed drives, UPSs, office equipment,
etc.),
v situations where current distortion must be reduced to avoid overloads.
c Operating principle:
Active filters are systems employing power electronics, installed in series or in
parallel with the non-linear load, to provide the harmonic currents required by non-
linear loads and thereby avoid distortion on the power system.
34
Solutions to attenuate
harmonics
Is
I har
Iact
Non-linear
load
Linear
loadHybrid filter
Active
filter
Is
I har
Iact
Non-linear
load
Linear
load
Active
filter
E55541
Figure 17 shows an example of an active filter compensating the harmonic current (Ihar
= -Iact
).
Figure 17 - operating principle of an active filter
The active filter injects, in opposite phase, the harmonics drawn by the load, such
that the line current Is remains sinusoidal.
6.2.3 Hybrid filters
c Typical applications:
v industrial installations comprising a set of devices causing harmonics with a total
power rating greater than 200 kVA approximately (variable-speed drives, UPSs,
rectifiers, etc.),
v installations where power factor correction is required,
v situations where voltage distortion must be reduced to avoid disturbing sensitive
loads,
v situations where current distortion must be reduced to avoid overloads,
v situations where conformity with strict harmonic-emission limits is required.
c Operating principle:
The two types of filters presented above can be combined in a single device, thus
constituting a hybrid filter (see figure 18). This new filtering solution combines the
advantages of the existing systems and provides a high-performance solution
covering a wide power range.
E55542
Figure 18 - operating principle of a hybrid filter
35
6.2.4 Selection criteria
c Passive filters offer both:
v power factor correction,
v large capacity for current filtering.
Installations where passive filters are installed must be sufficiently stable, i.e. a low
level of load fluctuations.
If a high level of reactive power is supplied, it is advised to de-energise the passive
filter when load levels are low.
Preliminary studies for a filter must take into account any capacitor banks and may
lead to their elimination.
c Active harmonic conditioners compensate harmonics over a wide range of
frequencies. They can adapt to any load, however, their conditioning capacity is
limited.
c Hybrid filters combine the strong points of both passive filters and active
harmonic conditioners.
36
Inshort
Schneider Electric offers a complete
range of harmonic-distortion
detection devices:
c Digipact,
c Powerlogic (Power Meter and
Circuit Monitor),
c Micrologic.
Harmonic-detection devices
from Schneider Electric
7.1 Detection
Management of harmonic disturbances is based above all on measurement
functions. Depending on the type of each installation, different types of equipment
from Schneider Electric provide the solution.
7.1.1 Power meters
Digipact
Digipact is designed for simple applications in the field of low-voltage electrical-
distribution management, including indication and remote-control functions, alarms,
etc.
The PM digital power meters of the Digipact range combine a number of traditionally
separate functions in a single unit, including ammeter, voltmeter, wattmeter, watthour
meter and harmonic measurements.
To provide information on power quality in low-voltage distribution systems, Digipact
indicates the:
c voltage THD,
c current THD,
c power factor (depending on the model in the range),
locally and/or remotely via a communications system and supervision software.
Digipact devices are easy to wire and use. They detect power-quality problems and
can be used to monitor the installation over time.
On the basis of the power-quality information provided by Digipact, the operator can
launch a more in-depth analysis of the installation before critical disturbance levels
are reached.
Digipact is part of the overall management of an electrical distribution system.
Power Meter and Circuit Monitor of PowerLogic System
Powerlogic products are high-performance analysis tools for medium- and low-
voltage distribution systems. They are digital power meters designed to measure
power quality.
The Powerlogic range is made up of Power Meters (PM) and Circuit Monitors (CM).
This highly modular range provides solutions for very simple needs, covered by the
PMs, up to the most complex, covered by the CMs. These products are used in new
or existing installations where a high level of power quality is mandatory. They may
be operated both locally and remotely.
Depending on their position in the installation, Power Meters offer an initial
estimation of power quality. The main measurements carried out by PMs are the:
c current and voltage THD,
c power factor.
Depending on the model in the range, these functions may be combined with time
stamping and alarms.
Circuit Monitors provide in-depth analysis of power quality and system disturbances.
The main CM functions are:
c measurement of over 100 electrical parameters,
c storage in memory and time stamping of the minimum and maximum values for
each electrical parameter,
c alarm tripping by electrical parameters,
c event logging,
c recording of current and voltage disturbances,
c harmonic analysis,
c recording of wave forms (waveform capture).
053162054520054531
Digipact
Circuit Monitor
Power Meter
37
Micrologic : a power meter built into circuit breakers
For new installations, the Micrologic H control unit, built into the circuit breaker, is a
particularly useful solution for measurements on the upstream side of the installation
or on large outgoing circuits.
The Micrologic H control unit provides in-depth analysis of power quality and detailed
diagnostics of events. The data provided by Micrologic H is intended for use on a
switchboard display unit or a supervisor.
It provides:
c measurement of currents, voltages, active and reactive power,
c measurement of the current and voltage THD and THF,
c display of the current and voltage harmonic components (amplitude and phase up
to the 50th order),
c recording of wave forms (waveform capture).
The functions offered by Micrologic H control units are equivalent to those provided
by Circuit Monitor devices.
7.1.2 Using power-meter data
Remote management and analysis software
In the wider framework of an entire distribution system that must be monitored,
Schneider Electric offers the communications systems required to interconnect all
the various devices via a network, thus making it possible to centralise information
and obtain an overall view of disturbances over the entire distribution system.
Depending on the devices and software used, it is possible to carry out
measurements in real time, calculate averages, record wave forms, anticipate on
alarms, etc.
The power meters transmit all the accessible data via either ModBus or the Digipact
bus.
The primary purpose of these systems is to assist in identifying and planning
maintenance work. They can significantly reduce servicing times and installation
costs for temporary devices used for on-site measurements or for sizing of
equipment (filters).
Schneider Electric offers two supervision-software products.
Digivision
The Digivision supervision software, installed on a standard PC, can be used to
manage all the measurement and protection data supplied by the low-voltage
devices. It represents the first level of supervision software for electrical installations.
Via the PC, the operator can:
c view the information provided by the PM power meters and Micrologic H control
units,
c set alarm thresholds,
c communicate with the various connected protection and control devices to view
their status and settings, as well as remotely control opening and closing.
SMS
SMS is a very complete software system for analysis of distribution systems, used in
conjunction with Powerlogic products.
Installed on a standard PC, it can be used to:
c view measurements on a real time basis,
c view histories, over a set period,
c select the manner in which data is displayed (tables, various curves),
c process statistical data (display of histograms).
056404054503
Micrologic H control unit integrated into the new NW
and NT power circuit breaker
Digivision supervision software
38
Functions
Detection
Diagnostics
Analysis
PM100 to 300
(Digipact)
PM600-620
(Powerlogic)
SMS
CM 2050 to 2450
(Powerlogic)
Digivision
PM650
(Powerlogic)
Micrologic H
(Masterpact)
Harmonic-detection devices
from Schneider Electric
7.2 Selection guide
The table below presents the most suitable applications of the various devices for
harmonic measurements:
Goal of detection PM100/300 PM650 Micrologic H CM2000/2450
Overall evaluation c c c c c c c c c c c c
of distribution-system
status
Precise diagnostics c c c c c c c c c
Analysis c c c c c c c c
Advantages Basic Complete Built-into the Very complete,
measurements, measurement circuit breaker, highly accurate
easy to use, device with monitors measurement
inexpensive, small built-in alarms incomers or device, large
size and high and non- large outgoing data-storage
accuracy volatile circuits without capacity,
memory additional wiring programmable,
or current fast
transformers measurements
Key:
c c c : perfectly suited
c c : satisfactory
c : indicates a disturbance, other functions require other devices
E56977
Figure 19 - relative positions of the various detection products
39
PM100 PM150 PM300 PM600 PM620 PM650 Micrologic H CM2150 CM2250 CM2350 CM2450
communications
no communication c
communication via Digipact bus c
communication via RS-485 / Modbus c c c c c c c c c
metering and monitoring
current, voltage, frequency c c c c c c c c c c c
power, energy, power factor c c c c c c c c c c c
true rms metering through 31st harmonic c c c c c c c c c c c
THD for voltage and current, per phase c c c c c c c c c c
relay output (programmable) c c c c c c c c c c c
low-voltage applications c c c c c c c c c c c
medium-voltage applications (via PTs) c c c c c c c
current/voltage accuracy class 0.5 % 0.5 % 0.5 % 0.2 % 0.2 % 1 % for I(1)
0.2 % 0.2 % 0.2 % 0.2 % 0.2 %
1.5 % for U
demand current per phase, present and maximum c c c c c c c
demand power per phase, present and maximum c c c c c c c c
time/date stamping c c c c c c c
user-configurable alarms c c c c c c c
predicted demand power c c c c c c c
synchronised demand via comm. c c c c c c c
min/max recording c c c c c c c
on-board memory for data and event logs c c c c c c c
advanced monitoring and analysis
time/data stamping of min/max values c c c c c
optional input/output module c c c c c
front optical comm. port c c c c
extended memory (2) c c c c
field-upgradeable firmware c c c c
waveform capture for harmonic analysis c c c c
voltage disturbance monitoring (dips, spikes) c c
programmable for special applications c c
(1) Including the sensors.
(2) User-accessible memory of100 k standard on all CM devices, 512 k and 1 M optional.
Selection table
40
Inshort
Harmonic-management
solutions from Schneider
Electric
Schneider Electric offers a complete
range of harmonic-management
services:
c expert analysis,
c measurement and surveillance
devices,
c filters.
8.1 Analysis and diagnostics from
Schneider Electric
Selection of the best solution, from both the technical and economic point of view,
requires an in-depth study of the installation.
MV and LV diagnostics
When an expert from a Schneider Electric CEAT unit is called in, the user is
guaranteed that the proposed solution will be effective (e.g. a guaranteed maximum
THDu level).
The harmonic analysis and diagnostics are carried out by an engineer specialised in
the field of disturbances in electrical distribution systems and equipped with powerful
analysis and simulation equipment.
The service provided by Schneider Electric is divided into steps:
c measurement of disturbances, in current and in phase-to-neutral and phase-to-
phase voltages, on the disturbing loads, on the disturbed outgoing circuits and the
power sources,
c a computer model of the measured phenomena is created, providing a precise
explanation of their causes and optimised selection of the possible solutions,
c a complete report is drawn up, indicating:
v the measured levels of disturbance,
v the maximum permissible levels of disturbance (IEC 61000, IEC 34, etc.),
c the performance of the selected solutions is guaranteed,
c the final solution is implemented, using the selected equipment and systems.
The entire service is certified ISO 9002.
41
8.2 Specific Schneider Electric products
8.2.1 Passive filters
Passive filters are made up of inductors and capacitors set up as resonant circuits
tuned to the frequency of the harmonic order to be eliminated. A system may
comprise a number of filters to eliminate several harmonic orders.
General characteristics
Voltage 400 V three phase
Power rating up to 265 kvar / 470 A for the 5th order filter
up to 145 kvar / 225 A for the 7th order filter
up to 105 kvar / 145 A for the 11th order filter
Enclosure Prisma
8.2.2 Active filters of MGE UPS SYSTEMS
General characteristics
Voltage 400 V
Conditioning
capacity per 20 to 120 A rms
phase (A rms)
Conditioned
harmonic orders 2 to 25, complete spectrum or selected orders
currents
Harmonic Load THDi / Upstream THDi greater than 10 at rated load
attenuation on conditioner
Functions displacement power-factor correction, 7-language alphanumeric
display, diagnostics and maintenance system, parallel
connection, remote control, communications interface
JBus/RS485
8.2.3 Hybrid filters
Hybrid filters combine the advantages of a passive filter and a SineWave active
harmonic conditioner in a single unit.
General characteristics
Passive filter 5th order harmonics
Active harmonic conditioner 20 to 180 A
Voltage 400 V three phase
Reactive energy compensation up to 265 kvar
Harmonic orders conditioned 2 to 25
Total harmonic current up to 440 A
Enclosure Prisma
Schneid1
Passive filter
Hybrid filter
Schneid2
Active filter of MGE UPS SYSTEMS
sinewave
42
8.2.4 Selection guide
Type of application Rectiphase SineWave MGE UPS Rectiphase
passive filter SYSTEMS harmonic hybrid filter
conditioner
Commercial buildings c c c c c c
(computer systems, air-
conditioning, lighting, lifts)
Paper, cardboard, plastics c c c c c c
industry (conveyers,
winding/unwinding
equipment)
Water-treatment (pumps, c c c c c c c c
mixers)
Handling (cranes, ski lifts) c c c c c c
Key:
c c c : perfectly suited
c c : perfectly suited technically, but costly
c : satisfactory
Harmonic-management
solutions from Schneider
Electric
43
c ISF : Technical Seminar: “Understanding and managing harmonics” (in French)
c ISF : Technical Publications: “Harmonics in electrical installations” (in French)
c IEC standards
c Utility recommendations
c EDF: Harmonique 5.1 software, User Manual (in French)
c EDF: Les cahiers de l’ingénierie: Management of harmonics on industrial and
commercial distribution systems, Parts 1 and 2 (Ref. GEDO 1.48.B.07/96 and
1.48.B.01/97) (in French)
c Merlin Gerin: Guide to reactive-energy compensation and harmonic filtering -
HV/MV (Ref. CG0065)
c Schneider Electric: “Cahiers Techniques” publications nos. 152, 159, 160, 183
Bibliography
As standards, specifications and designs change from time to time, please ask for
confirmation of the information given iin this publication.
Published by: Schneider Electric
Designed by: AMEG
Printed by:
Schneider Electric Industries SA
5 rue Nadar
92506 Rueil-Malmaison
Cedex France
Tel : +33 (0)1 41 29 82 00
Fax : +33 (0)1 47 51 80 20
http://www.schneiderelectric.com
This document has been printed on ecological paper.
DBTP152GUI/E
DBTP152GUI/E-©1999SchneiderElectric-Allrightsreserved
11-99

More Related Content

What's hot

FACTS DEVICES
FACTS DEVICESFACTS DEVICES
FACTS DEVICESamit8847
 
Power System Stabilizer
Power System StabilizerPower System Stabilizer
Power System StabilizerSuman Sourabh
 
Interconnection issue in microgrid
Interconnection issue in microgridInterconnection issue in microgrid
Interconnection issue in microgridAmarjeet S Pandey
 
Power system harmonics
Power system harmonicsPower system harmonics
Power system harmonicsKartik Mali
 
implementation of statcom and reactive power compensation
implementation of statcom and reactive power compensationimplementation of statcom and reactive power compensation
implementation of statcom and reactive power compensationprashant shekhar
 
Load flow study Part-II
Load flow study Part-IILoad flow study Part-II
Load flow study Part-IIAsif Jamadar
 
Loading Capability Limits of Transmission Lines
Loading Capability Limits of Transmission LinesLoading Capability Limits of Transmission Lines
Loading Capability Limits of Transmission LinesRaja Adapa
 
Harmonics and mitigation techniques
Harmonics and mitigation techniquesHarmonics and mitigation techniques
Harmonics and mitigation techniquesrifat maryum
 
Unit 2 Reactive Power Management
Unit 2 Reactive Power ManagementUnit 2 Reactive Power Management
Unit 2 Reactive Power ManagementSANTOSH GADEKAR
 
Transient overvoltages and currents: lightning surges
Transient overvoltages and currents: lightning surgesTransient overvoltages and currents: lightning surges
Transient overvoltages and currents: lightning surgesBruno De Wachter
 
Active filter iora 2 consul
Active filter iora 2 consulActive filter iora 2 consul
Active filter iora 2 consulrajesh thulasi
 

What's hot (20)

Facts controllers
Facts controllersFacts controllers
Facts controllers
 
FACTS DEVICES
FACTS DEVICESFACTS DEVICES
FACTS DEVICES
 
Power System Stabilizer
Power System StabilizerPower System Stabilizer
Power System Stabilizer
 
Interconnection issue in microgrid
Interconnection issue in microgridInterconnection issue in microgrid
Interconnection issue in microgrid
 
Power system harmonics
Power system harmonicsPower system harmonics
Power system harmonics
 
DC MICROGRID PPT.pptx
DC MICROGRID PPT.pptxDC MICROGRID PPT.pptx
DC MICROGRID PPT.pptx
 
implementation of statcom and reactive power compensation
implementation of statcom and reactive power compensationimplementation of statcom and reactive power compensation
implementation of statcom and reactive power compensation
 
Power quality
Power qualityPower quality
Power quality
 
Harmonics
HarmonicsHarmonics
Harmonics
 
Load flow study Part-II
Load flow study Part-IILoad flow study Part-II
Load flow study Part-II
 
Loading Capability Limits of Transmission Lines
Loading Capability Limits of Transmission LinesLoading Capability Limits of Transmission Lines
Loading Capability Limits of Transmission Lines
 
Power System Stability Introduction
Power System Stability IntroductionPower System Stability Introduction
Power System Stability Introduction
 
Power quality
Power qualityPower quality
Power quality
 
Harmonics and mitigation techniques
Harmonics and mitigation techniquesHarmonics and mitigation techniques
Harmonics and mitigation techniques
 
Power Quality
Power QualityPower Quality
Power Quality
 
Power system-analysis-psr murthy
Power system-analysis-psr murthyPower system-analysis-psr murthy
Power system-analysis-psr murthy
 
Unit 2 Reactive Power Management
Unit 2 Reactive Power ManagementUnit 2 Reactive Power Management
Unit 2 Reactive Power Management
 
What is Power Swing | Power Swing
What is Power Swing | Power Swing What is Power Swing | Power Swing
What is Power Swing | Power Swing
 
Transient overvoltages and currents: lightning surges
Transient overvoltages and currents: lightning surgesTransient overvoltages and currents: lightning surges
Transient overvoltages and currents: lightning surges
 
Active filter iora 2 consul
Active filter iora 2 consulActive filter iora 2 consul
Active filter iora 2 consul
 

Similar to Harmonic Detection and Filtering Guide

Similar to Harmonic Detection and Filtering Guide (8)

8_I_en.pdf
8_I_en.pdf8_I_en.pdf
8_I_en.pdf
 
8_I_en.pdf
8_I_en.pdf8_I_en.pdf
8_I_en.pdf
 
Fadal CNC Safety Section Manual
Fadal CNC Safety Section Manual Fadal CNC Safety Section Manual
Fadal CNC Safety Section Manual
 
Fadal Parts Manual
Fadal Parts ManualFadal Parts Manual
Fadal Parts Manual
 
Jerome 431 manual
Jerome 431 manualJerome 431 manual
Jerome 431 manual
 
New holland td90 tractor service repair manual
New holland td90 tractor service repair manualNew holland td90 tractor service repair manual
New holland td90 tractor service repair manual
 
New holland td60 tractor service repair manual
New holland td60 tractor service repair manualNew holland td60 tractor service repair manual
New holland td60 tractor service repair manual
 
New holland td70 tractor service repair manual
New holland td70 tractor service repair manualNew holland td70 tractor service repair manual
New holland td70 tractor service repair manual
 

Harmonic Detection and Filtering Guide

  • 1. M M M M MMMM M M M M Harmonic detection and filtering Low-voltageexpertguidesN°4
  • 2. 1 1 General..................................................................................... 5 1.1 Definition of harmonics and their origin ............................................... 5 1.1.1 distortion of a sinusoidal signal......................................................................... 5 1.1.2 origin of harmonics ........................................................................................... 6 1.2 Why harmonics need to be detected and suppressed? ...................... 9 1.2.1 disturbances caused by harmonics .................................................................. 9 1.2.2 the economic impact of disturbances ............................................................... 9 1.2.3 increasingly serious consequences .................................................................. 9 1.2.4 practically speaking, which harmonics must be measured and reduced? ....... 9 2 The essential indicators of harmonic distortion and measurement principles ..................................................... 10 2.1 Power factor ....................................................................................... 10 2.1.1 definition.......................................................................................................... 10 2.1.2 interpreting the value of the power factor ....................................................... 10 2.2 Crest factor......................................................................................... 10 2.2.1 definition.......................................................................................................... 10 2.2.2 interpreting the value of the crest factor ......................................................... 10 2.3 Power and harmonics .........................................................................11 2.3.1 active power .................................................................................................... 11 2.3.2 reactive power .................................................................................................11 2.3.3 distortion power .............................................................................................. 11 2.4 Frequency spectrum and harmonic content ...................................... 12 2.4.1 principle........................................................................................................... 12 2.4.2 individual harmonic distortion (or harmonic distortion of order h) .................. 12 2.4.3 frequency spectrum ........................................................................................ 12 2.4.4 RMS value ...................................................................................................... 12 2.5 Total harmonic distortion (THD) ......................................................... 13 2.5.1 definition of total harmonic distortion .............................................................. 13 2.5.2 current and voltage THD ................................................................................ 13 2.5.3 total harmonic factor (THF) ............................................................................. 13 2.5.4 relation between power factor and THD ......................................................... 14 2.6 Usefulness of the various indicators .................................................. 15 3 Measuring the values of the indicators .............................. 16 3.1 Measurement devices ........................................................................ 16 3.1.1 selection of a measurement device ................................................................ 16 3.1.2 functions of digital analysers .......................................................................... 16 3.1.3 operating principle of digital analysers and data-processing techniques ....... 16 3.2 Procedure for harmonic analysis of a distribution system ................. 17 3.3 Anticipating harmonic conditioning needs.......................................... 18 3.3.1 the advantages of permanently installed devices ........................................... 18 3.3.2 the advantages of integrated measurement and detection devices ............... 18 4 The main effects of harmonics in installations ................. 19 4.1 Resonance ......................................................................................... 19 4.2 Increased losses ................................................................................ 20 4.2.1 losses in conductors ....................................................................................... 20 4.2.2 losses in asynchronous machines .................................................................. 21 4.2.3 losses in transformers..................................................................................... 21 4.2.4 losses in capacitors ........................................................................................ 21 4.3 Overloads on installation equipment .................................................. 22 4.3.1 generators ....................................................................................................... 22 4.3.2 UPSs ............................................................................................................... 22 4.3.3 transformers .................................................................................................... 22 4.3.4 asynchronous machines ................................................................................. 23 4.3.5 capacitors........................................................................................................ 24 4.3.6 neutral conductors .......................................................................................... 24 Contents
  • 3. 2
  • 4. 3 4.4 Disturbances to sensitive loads ......................................................... 26 4.4.1 effects of supply-voltage distortion ................................................................. 26 4.4.2 disturbances on telephon lines ....................................................................... 26 4.5 Economic consequences ................................................................... 26 4.5.1 power losses ................................................................................................... 26 4.5.2 additional subscribed power costs .................................................................. 26 4.5.3 oversizing of equipment .................................................................................. 26 4.5.4 reduction in the service life of equipment ....................................................... 27 4.5.5 nuisance tripping and installation shutdown ................................................... 27 4.5.6 a few examples ............................................................................................... 27 5 Standards and the regulatory environment ....................... 28 5.1 Compatibility standards between distribution systems and products ............................................................................................. 28 5.2 Distribution-system quality standards ................................................. 28 5.3 Standards on devices ......................................................................... 28 5.4 Maximum permissible harmonic values .............................................. 29 6 Solutions to attenuate harmonics ....................................... 30 6.1 General solutions ............................................................................... 30 6.1.1 positioning the disturbing loads upstream in the system ................................ 30 6.1.2 grouping the disturbing loads ......................................................................... 30 6.1.3 separating the sources ................................................................................... 31 6.1.4 using transformers with special connections .................................................. 31 6.1.5 installing inductors .......................................................................................... 31 6.1.6 selection of a suitable system earthing arrangement ..................................... 32 6.2 Solutions when limit values are exceeded ......................................... 33 6.2.1 passive filters .................................................................................................. 33 6.2.2 active filters (active harmonic conditioners).................................................... 33 6.2.3 hybrid filters .................................................................................................... 34 6.2.4 selection criteria .............................................................................................. 35 7 Harmonic-detection devices from Schneider Electric ...... 36 7.1 Detection ............................................................................................ 36 7.1.1 power meters .................................................................................................. 36 7.1.2 using power-meter data .................................................................................. 37 7.2 Selection guide................................................................................... 38 8 Harmonic-management solutions from Schneider Electric.............................................................. 40 8.1 Analysis and diagnostics from Schneider Electric ............................. 40 8.2 Specific Schneider Electric products.................................................. 41 8.2.1 passive filters .................................................................................................. 41 8.2.2 active filters of MGE UPS SYSTEMS ............................................................. 41 8.2.3 hybrid filters .................................................................................................... 41 8.2.4 selection guide ................................................................................................ 42 Bibliography ................................................................................ 43 Contents
  • 5. 4
  • 6. 5 General 1.1.1 Distortion of a sinusoidal signal The Fourier theorem states that all non-sinusoidal periodic functions can be represented as the sum of terms (i.e. a series) made up of: c a sinusoidal term at the fundamental frequency, c sinusoidal terms (harmonics) whose frequencies are whole multiples of the fundamental frequency, c a DC component, where applicable. The nth order harmonic (commonly referred to as simply the nth harmonic) in a signal is the sinusoidal component with a frequency that is n times the fundamental frequency. The equation for the harmonic expansion of a periodic function is presented below: y t Yo Y n tn n n n ( ) sin( )= + − = =∞ ∑ 2 1 ω ϕ where: c Yo: value of the DC component, generally zero and considered as such hereinafter, c Yn: rms value of the nth harmonic, c ω: angular frequency of the fundamental frequency, c ϕn : displacement of the harmonic component at t = 0. Example of signals (current and voltage waves) on the French electrical distribution system: c the value of the fundamental frequency (or first order harmonic) is 50 Hertz (Hz), c the second (order) harmonic has a frequency of 100 Hz, c the third harmonic has a frequency of 150 Hz, c the fourth harmonic has a frequency of 200 Hz, c etc. A distorted signal is the sum of a number of superimposed harmonics. Figure 1 shows an example of a current wave affected by harmonic distortion. Inshort 1.1 Definition of harmonics and their origin Harmonics distort current and/or voltage waves, disturbing the electrical distribution system and degrading power quality. Figure 1 - example of a current containing harmonics and expansion of the overall current into its harmonic orders 1 (fundamental), 3, 5, 7 and 9 E55522 Ih7 Harmonic 9 (450 Hz) Harmonic 7 (350 Hz) Harmonic 5 (250 Hz) Harmonic 3 (150 Hz) Fundamental 50 Hz Total Ih9 Ih5 Ih3 Ih1 I rms (IG ) I peak (Ic)
  • 7. 6 General Representation of harmonics: the frequency spectrum The frequency spectrum is a practical graphical means of representing the harmonics contained in a periodic signal. The graph indicates the amplitude of each harmonic order. This type of representation is also referred to as spectral analysis. The frequency spectrum indicates which harmonics are present and their relative importance. Figure 2 shows the frequency spectrum of the signal presented in figure 1. Figure 2 - spectrum of a signal comprising a 50 Hz fundamental and harmonic orders 3 (150 Hz), 5 (250 Hz), 7 (350 Hz) and 9 (450 Hz) 1.1.2 Origin of harmonics Devices causing harmonics are present in all industrial, commercial and residential installations. Harmonics are caused by non-linear loads. Definition of non-linear loads A load is said to be non-linear when the current it draws does not have the same wave form as the supply voltage. Examples of non-linear loads Devices comprising power electronics circuits are typical non-linear loads. Such loads are increasingly frequent and their percentage in overall electrical consumption is growing steadily. Examples include: c industrial equipment (welding machines, arc furnaces, induction furnaces, rectifiers), c variable-speed drives for asynchronous and DC motors, c office equipment (PCs, photocopy machines, fax machines, etc.), c household appliances (television sets, microwave ovens, fluorescent lighting, etc.), c UPSs. Saturation of equipment (essentially transformers) may also cause non-linear currents. E55523 15050 250 350 450 f(Hz) 100 (%)
  • 8. 7 Disturbances caused by non-linear loads, i.e. current and voltage harmonics The supply of power to non-linear loads causes the flow of harmonic currents in the distribution system. Voltage harmonics are caused by the flow of harmonic currents through the impedances of the supply circuits (e.g. transformer and distribution system a whole in figure 3). E55524 Figure 3 - single-line diagram showing the impedance of the supply circuit for h-order harmonic Note that the impedance of a conductor increases as a function of the frequency of the current flowing through it. For each h-order harmonic current, there is therefore an impedance Zh in the supply circuit. The h-order harmonic current creates via impedance Zh a harmonic voltage Uh , where Uh = Zh x Ih , i.e. a simple application of Ohm’s law. The voltage at B is therefore distorted and all devices supplied downstream of point B will receive a distorted voltage. Distortion increases in step with the level of the impedances in the distribution system, for a given harmonic current. Flow of harmonics in distribution systems To better understand harmonic currents, it may be useful to imagine that the non- linear loads reinject harmonic currents upstream into the distribution system, in the direction of the source. Figures 4a and 4b show an installation confronted with harmonic disturbances. Figure 4a shows the flow of the fundamental 50 Hz current, whereas in 4b, the h- order harmonic current is presented. E55525 Figure 4b - diagram of the same installation, showing only the phenomena related to the h-order harmonic Supply of this non-linear load causes the flow in the distribution system of current I50Hz (shown in figure 4a) to which is added each of the harmonic currents Ih (shown in figure 4b) corresponding to each harmonic (order h). E55526 Zl I 50 Hz Non-linear load A Zh B Ih Non-linear load Ih Vh Zh Non-linear load Vh = harmonic voltage = Zs x Ih Inshort Harmonic currents are caused by non-linear loads connected to the distribution system. The flow of harmonic currents through system impedances in turn creates voltage harmonics, which distort the supply voltage. Figure 4a - diagram of an installation supplying a non-linear load, showing only the fundamental 50 Hz current
  • 9. 8 A G Ihe Ihd Ihb Iha Devices drawing rectified currents (television, computer systems, etc...) Fluorescent or discharge lamps Variable-speed drives Rectifiers Arc furnaces Welding machines Linear loads Backup power source Power factor correction (do not create harmonics) Harmonic disturbances to distribution system and other users Σ Ih and distorted voltage MV/LV Using once again the model of non-linear loads reinjecting harmonic currents into the distribution system, it is possible to graphically represent this phenomena (figure 5). E55527 General Figure 5 - flow of harmonic currents in a distribution system Note in this figure that certain loads cause harmonic currents in the distribution system and other loads are disturbed by them.
  • 10. 9 1.2.1 Disturbances caused by harmonics In distribution systems, the flow of harmonics reduces power quality and consequently causes a number of problems: c overloads on distribution systems due to the increase in the rms current, c overloads on neutral conductors due to the summing of third-order harmonics created by single-phase loads, c overloads, vibrations and premature ageing of generators, transformers, motors, etc., transformer hum, c overloading and premature ageing of capacitors in power factor correction equipment, c distortion of the supply voltage, capable of disturbing sensitive loads, c disturbances on communications networks and telephone lines. 1.2.2 The economic impact of disturbances Harmonics have a significant economic impact, in that: c premature ageing of equipment means that it must be replaced earlier, unless it was oversized to begin with, c overloads on the distribution system mean the level of subscribed power must be increased, with additional losses, unless the installation can be upgraded, c distortion of the current provokes nuisance tripping and shutdown of production equipment. These extra costs in terms of equipment, energy and productivity all contribute to reducing the competitiveness of companies. 1.2.3 Increasingly serious consequences As recently as ten years ago, harmonics were not considered a major problem, because their effects on distribution systems were, generally speaking, relatively slight. However, the massive increase in the use of loads employing power electronics has significantly worsened the situation in all fields of activity. Harmonics are all the more difficult to reduce in that they are often caused by equipment that is vital to the operation of companies. 1.2.4 Practically speaking, which harmonics must be measured and reduced ? The harmonics most frequently encountered (and consequently the most troublesome) on three-phase distribution systems are the odd-order harmonics (3rd, 5th, 7th, etc.). Beyond the 50th order, harmonic currents are negligible and measurements are not required. Sufficient accuracy of measurements is obtained by taking into account harmonics up to the 30th order. Utilities monitor harmonic orders 3, 5, 7, 11 and 13. It follows that conditioning of harmonics is imperative up to order 13 and ideally should include harmonics up to order 25. 1.2 Why harmonics need to be detected and suppressed?
  • 11. 10 The essential indicators of harmonic distortion and measurement principlesInshort A number of indicators exist that may be used to quantify and assess the harmonic distortion of current and voltage waves. These indicators are: c the power factor, c the crest factor, c the distortion power, c the frequency spectrum, c harmonic distortion. These indicators are indispensable in determining any corrective action required. The power factor will be noted “PF” in this document 2.1.1 Definition The power factor is the ratio between the active power P and the apparent power S. PF P S = In electrical jargon, the power factor is often confused with cosine phi (cos ϕ), which may be defined by the equation: cosϕ = P S 1 1 P1 = active power of the fundamental, S1 = apparent power of the fundamental. As the above equation makes clear, cos ϕ applies only to the fundamental frequency. When harmonics are present, its value is different than that of the power factor. 2.1.2 Interpreting the value of the power factor An initial indication that significant harmonic distortion exists is provided when the measured power factor is not equal to cos ϕ (i.e. the power factor is less than cos ϕ). 2.1 Power factor 2.2 Crest factor 2.2.1 Definition The crest factor is the ratio between the value of the peak current or voltage (Im or Um ) and the corresponding rms value. k I I m rms = or k U U m rms = For a sinusoidal signal, the crest factor is therefore equal to r. For non-sinusoidal signals, the crest factor can be greater than or less than r. This factor is particularly useful in drawing attention to exceptional peak values with respect to the rms value. 2.2.2 Interpreting the value of the crest factor A typical crest factor for the current drawn by non-linear loads is much greater than r. Its value can range from 1.5 to 2 or even up to 5 in critical situations. A very high crest factor indicates that high overcurrents occur from time to time. These overcurrents, detected by the protection devices, may cause nuisance tripping.
  • 12. 11 2.3.1 Active power The active power P of a signal distorted by harmonics is the sum of the active powers corresponding to the voltages and currents in the same frequency order. The expansion of the voltage and current into their harmonic components may be written as: P U Ih h h h = = ∞ ∑ cosϕ 1 where ϕh is the displacement between voltage and current of harmonic order h. Note: c it is assumed that the signal does not contain a DC component, i.e. U0 = I0 = 0, c when the signal is not distorted by harmonics, the equation P = U1 I1 cos ϕ1 again applies, indicating the power of a sinusoidal signal, where cos ϕ1 is equal to “cos ϕ”. 2.3.2 Reactive power Reactive power applies exclusively to the fundamental and is defined by the equation: Q = U1. .sinI1 1ϕ 2.3.3 Distortion power Consider the apparent power S. S U .Irms rms= In the presence of harmonics, the equation becomes: S U Ih n h n 2 2 4 2 1 =             = ∞ = ∞ ∑ ∑. Consequently, in the presence of harmonics, the equation S2 =P2 +Q2 is no longer valid. The distortion power D is defined as S2 =P2 +Q2 +D2 , i.e.: D S P Q= − −2 2 2 2.3 Power and harmonics
  • 13. 12 H % 100 33 20 10 h2 3 4 5 6 2.4.1 Principle Each device causing harmonics has its own harmonic-current "fingerprint", with different amplitudes and displacements. These values, notably the amplitude of each harmonic order, are essential elements for analysis of harmonic distortion. 2.4.2 Individual harmonic distortion (or harmonic distortion of order h) Individual harmonic distortion is defined as the level of distortion, in percent, of order h, with respect to the fundamental: u U U h h (%) = 100 1 or i I I h h (%) = 100 1 2.4.3 Frequency spectrum By plotting the amplitude of each harmonic order on a graph, we obtain a graphical representation of the frequency spectrum. This technique is referred to as spectral analysis. Figure 6 shows the spectral analysis of a square-wave signal. 2.4 Frequency spectrum and harmonic content E55531 U(t) 1 t E55530 The essential indicators of harmonic distortion and measurement principles Figure 6 - spectral analysis of a square-wave signal, for voltage U t( ) 2.4.4 RMS value The rms value of a current or voltage is calculated on the basis of the rms values of the various harmonic orders. I Ieff h h = = ∞ ∑ 2 1 U Ueff h h = = ∞ ∑ 2 1 rms rms
  • 14. 13 Inshort THD stands for Total Harmonic Distortion. The level of harmonic distortion is often used to define the degree of harmonic content in an alternating signal. 2.5.1 Definition of total harmonic distortion For a signal y, the total harmonic distortion (THD) is defined by the equation: THD y y h h = = ∞ ∑ 2 2 1 This definition complies with that of standard IEC 61000-2-2. Note that the resulting value may exceed one. According to the standard, h can generally be limited to 50. This equation produces a single value indicating the distortion of a voltage or a current flowing at a given point in a distribution system. Harmonic distortion is generally expressed as a percentage. 2.5.2 Current and voltage THD When dealing with current harmonics, the equation becomes: THD I I I h h = = ∞ ∑ 2 2 1 The above equation is equivalent to the one below, which is more direct and easier to use when the total rms value is known: THD I I I eff =       − 1 2 1 When dealing with voltage harmonics, the equation becomes: THD u U u h h = = ∞ ∑ 2 2 1 2.5.3 Total harmonic factor (THF) In certain countries with different work habits, a different equation is used to determine harmonic distortion. In this equation, the value of the fundamental voltage U1 or the fundamental current I1 is replaced by the rms values Urms and Irms respectively. To distinguish between the two equations, we will call the second the total harmonic factor (THF). Example of a voltage THF: THF U U u h h eff = = ∞ ∑ 2 2 The total harmonic factor, whether for voltage or current, is always less than 100%. It makes analogue measurements of signals easier but is used less and less because the result is very close to the THD defined above when a signal is not significantly distorted. What is more, it not well suited to highly distorted signals because it cannot exceed the value of 100%, contrary to the THD defined at the beginning of this section. 2.5 Total harmonic distortion (THD) rms rms
  • 15. 14 100500 THDi (%)100 0.6 0.4 PF/cos ϕ 0.2 0.8 1 1.2 2.5.4 Relation between power factor and THD When the voltage is sinusoidal or virtually sinusoidal, it may be said that: P P U I# . .cos1 1 1 1= ϕ Consequently: FP P S U I U Ieff = # . .cos . 1 1 1 1 ϕ or : I I THDeff I 1 2 1 1 = + hence: FP THDI # cosϕ1 2 1+ Figure 7 shows a graph of PF / cos ϕ as a function of THDi. PF / cos ϕ = f (THDi) E55528 The essential indicators of harmonic distortion and measurement principles Figure 7 - variation of PF / cos ϕ as a function of THDi, where THDu = 0 PF rms PF rms
  • 16. 15 Inshort The primary indicator is the THD, a single value that reflects the level of distortion in voltage and current waves. The harmonic spectrum provides a "fingerprint" of the distorted signal. c The voltage THD indicates the distortion of the voltage wave. The measured THDu can provide information on phenomena observed in the installation. A THDu value of less than 5% is considered normal and there is virtually no risk of equipment malfunctions. A THDu value between 5% and 8% indicates significant harmonic distortion. Some equipment malfunctions may occur. A THDu value higher than 8% indicates high harmonic distortion. Equipment malfunctions are probable. In-depth analysis is required and an attenuation system must be installed. c The current THD indicates the distortion of the current wave. To identify the load causing the disturbance, the current THD must be measured on the incomer and the outgoers of the different circuits. The measured THDi can provide information on phenomena observed in the installation. A THDi value of less than 10% is considered normal and there is virtually no risk of equipment malfunctions. A THDi value between 10% and 50% indicates significant harmonic distortion. Temperature rise may occur, which means cables and sources must be oversized. A THDi value higher than 50% indicates high harmonic distortion. Equipment malfunctions are probable. In-depth analysis is required and an attenuation system must be installed. c The power factor PF indicates the extent to which the source of the installation must be oversized. c The crest factor is used to determine the capacity of a generator (UPS or generator) to provide high instantaneous currents. For example, computers draw highly distorted current with crest factors that may reach 3 or even 5. c The spectrum (signal broken down into frequency) provides a different view of electrical signals and may be used to assess distortion. 2.6 Usefulness of the various indicators
  • 17. 16 3.1.1 Selection of a measurement device Only digital analysers, based on recent technology, provide sufficiently accurate measurements for the indicators presented above. Other measurement devices were used in the past. c oscilloscopes for observation purposes A general indication of the distortion of a signal may be obtained by viewing the current or the voltage on an oscilloscope. When the wave form is not sinusoidal, the signal is distorted by harmonics. The voltage and current peaks can be displayed. Note that using an oscilloscope, it is not possible to precisely quantify the harmonic components. c analogue spectral analysers Implementing old technology, these devices are made up of a passband filter combined with an rms voltmeter. These devices, now outdated, produce mediocre results and do not provide any information on displacement. 3.1.2 Functions of digital analysers The microprocessors used in digital analysers: c calculate the values of the harmonic indicators (power factor, crest factor, distortion power, THD), c offer a number of additional functions (correction, statistical detection, management of measurements, display, communication, etc.), c when they are multi-channel devices, provide simultaneously and nearly in real time the spectral breakdown of voltage and current. 3.1.3 Operating principle of digital analysers and data-processing techniques Analogue signals are converted into a series of digital values. On the basis of the digital values, an algorithm implementing the Fast Fourier Transform (FFT) calculates the amplitude and the phases of the harmonics over a large number of observation time windows. Most digital analysers measure harmonics up to the 20th or 25th order for calculation of the THD. Processing of the various values calculated using the FFT algorithm (smoothing, classification, statistics) can be carried out by the measurement device or by external software. 3.1 Measurement devices Measuring the values of the indicators
  • 18. 17 Measurements are carried out on industrial and commercial sites as a: c preventive measure: v to obtain an overall assessment of the extent of the problem (map of the distribution system), c remedial measure: v to determine the origin of a disturbance and devise solutions to correct the problem, v to check that the solutions implemented actually produced the desired effect. Operating mode Voltage and current measurements must be carried out: c at the power source, c on the incoming busbars of the main distribution switchboard, c on each of the outgoers leaving the main distribution switchboard. When the measurements are carried out, it is necessary to have precise information on the conditions, in particular the status of capacitor banks (ON or OFF, number of stages connected). On the basis of analysis results, it may be necessary to: c derate any future equipment installed, or c quantify the protection and harmonic-filtering solutions that must be installed, c compare the values measured to the reference values of the utility (harmonic- distortion limits, acceptable values, reference values). Use of measurement devices The devices show both the instantaneous effects and the long-term effects of harmonics. Correct analysis requires integrated values over time spans ranging from a few seconds to a few minutes, for observation periods of a few days. The required values are: c the amplitude of voltage and current harmonics, c the individual harmonic distortion of each order, for both current and voltage, c total harmonic distortion for both current and voltage, c where applicable, the displacement between voltage and current harmonics of the same order and the phase of the harmonics with respect to a common reference (the fundamental voltage, for example). 3.2 Procedure for harmonic analysis of a distribution system
  • 19. 18 The harmonic indicators can be measured: c by permanently installed devices, c by an expert present at least a half-day on the site (for a view limited in time). 3.3.1 The advantages of permanently installed devices For a number of reasons, it is preferable to use devices installed permanently in the distribution system. c a visit by an expert is necessarily limited in time, whereas measurements at different points in the installation over a sufficiently long period (one week to one month) provide an overall view of system operation and cover all the situations that may arise following: v fluctuation of the power source, v variations in system operation, v installation of new equipment. c measurement devices installed in the distribution system prepare and facilitate troubleshooting by experts, thus reducing the number and duration of their visits. c permanently installed measurement devices detect any new disturbances caused by the installation of new equipment, by new operating modes or by fluctuations on the distribution system. 3.3.2 The advantages of integrated measurement and detection devices Measurement and detection devices that are built into the electrical distribution equipment offer a number of advantages. c for an overall assessment of the distribution system (preventive measure), they avoid: v renting the measurement devices, v hiring the services of experts, v having to connect and disconnect all the measurement devices. In an overall assessment of the distribution system, an analysis at the main low- voltage switchboard level can commonly be carried out by the incoming device and/ or the measurement devices built into each outgoing device. c for an assessment in view of remedial action, they: v indicate the operating conditions when the incident occurred, v provide a “map” of the installation and indications on the selected solution. A full diagnosis will often also require additional information provided by specific equipment suited to the problem at hand. 3.3 Anticipating harmonic conditioning needs Measuring the values of the indicators
  • 20. 19 Ih Ls C Non-linear load Capacitor bank Linear load Inshort Harmonics have a major economic impact on installations in that they cause: c higher energy bills, c premature ageing of equipment, c drops in productivity. 4.1 Resonance The main effects of harmonics in installations The use of both capacitive and inductive devices in distribution systems leads to resonance phenomena, resulting in extremely high or low impedance values. These variations in impedance modify the current and voltage in the distribution system. Here we will discuss only parallel-resonance phenomena, which are the most frequent. Consider the simplified diagram below, showing an installation made up of: c a transformer supplying power, c linear loads, c non-linear loads causing harmonic currents, c power factor correction capacitors. E56828 For harmonic-analysis purposes, the equivalent diagram is shown below: E56976 Ls C R Ih Z Z jL L C s s = − ω ω1 2 when R is neglected Resonance occurs when the denominator 1-LsCω2 approaches zero. The corresponding frequency is called the resonant frequency of the circuit. At this frequency, the impedance is at its maximum value, resulting in considerable voltage harmonics and consequently major voltage distortion. This voltage distortion is accompanied by the circulation of harmonic currents in the Ls + C circuit which are greater than the injected harmonic currents. The distribution system and the power factor correction capacitors are subjected to considerable harmonic currents, resulting in the risk of overloads. Ls: supply inductance (distribution system + transformer + line) C: power factor correction capacitance R: resistance of the linear loads Ih: harmonic current
  • 21. 20 The main effects of harmonics in installations 0 20 40 60 80 100 120 1 1.2 1.4 1.6 1.8 2 2.2 0.8 THD (%) P Joules I rms 4.2 Increased losses 4.2.1 Losses in conductors The active power transmitted to a load depends on the fundamental current. When the current drawn by the load contains harmonics, the rms value of the current (Irms ) is greater than the fundamental I1 . With THD defined as: THD I I eff =       − 1 2 1 it may be deduced that: I I THDeff = +1 2 1 Figure 8 below shows, as a function of the harmonic distortion: c the increase in the rms current (Irms ) for a load drawing a given fundamental current, c the increase in the Joule losses (PJoules), without taking into account the skin effect. (The reference point for Irms and PJoules with no harmonics is set to 1 on the graph). E55532 Figure 8 - increase in rms current and Joule losses as a function of THD Current harmonics provoke an increase in Joule losses in all the conductors through which they flow and additional temperature rise in the transformers, circuit breakers, cables, etc. rms rms
  • 22. 21 19,1)13.()11.()7.()5.(1 .13..13.. .11..11.. .7..7.. .5..5.. .. 2 13 2 11 2 7 2 5 1 2 1131313 1111111 1777 1555 11 =++++= = == == == == = ∑ uuuu I I II IuCUI IuCUI IuCUI IuCUI CUI eff heff ω ω ω ω ω 4.2.2 Losses in asynchronous machines Voltage harmonics, when applied to asynchronous machines, provoke the flow of currents with frequencies higher than 50 Hz in the rotor. These currents cause additional losses that are proportional to Uh 2 /h. c Estimating the losses: v a virtually square-wave supply voltage provokes a 20% increase in losses, v a supply voltage with the following levels of individual harmonic distortion (uh ): where U1 is the fundamental voltage: - u5 : 8% of U1 , - u7 : 5% of U1 , - u11 : 3% of U1 , - u13 : 1% of U1 , (i.e. a voltage THD of 10%) results in additional losses of 6%. 4.2.3 Losses in transformers Harmonic currents flowing in transformers provoke increased losses in the windings through the Joule effect and increased iron losses due to eddy currents. What is more, voltage harmonics cause iron losses due to hysterisis. Roughly speaking, it may be said that the losses in the windings increase as the square of the current THD, and losses in the core increase linearly with the voltage THD. c Estimating the losses: v the increase in losses represents 10% to 15% for public-distribution transformers, where distortion levels relatively low. 4.2.4 Losses in capacitors Harmonic voltage, when applied to capacitors, provokes the flow of currents that are proportional to the frequency of the harmonics. These currents cause additional losses. c Example: Consider a supply voltage with the following levels of individual harmonic distortion (uh ): where U1 is the fundamental voltage: - u5 : 8% of U1 , - u7 : 5% of U1 , - u11 : 3% of U1 , - u13 : 1% of U1 , (i.e. a voltage THD of 10%). rms rms In this example, Joule losses are multiplied by 1.192 = 1.4. .
  • 23. 22 0 20 40 60 80 100 10 20 0 kVA (%) 30 40 50 60 70 80 90 100 % electronic load 4.3 Overloads on installation equipment 4.3.1 Generators Generators supplying non-linear loads must be derated due to the additional losses caused by the harmonic currents. The derating coefficient is approximately 10% for a generator supplying a set of loads in which 30% are non-linear loads. As a result, the generator must be oversized. 4.3.2 UPSs The current drawn by computer equipment has a high crest factor. A UPS sized taking into account only the rms current value may not be capable of supplying the required peak current and thus be overloaded. 4.3.3 Transformers c The curve in figure 9 below shows typical derating values for a transformer supplying electronic (i.e. non-linear) loads. E55533 The main effects of harmonics in installations Figure 9 - derating values for a transformer supplying electronic loads Example: a transformer supplying loads that are 40% electronic must be derated 40 %.
  • 24. 23 c Standard UTE C15-112 indicates a derating factor for transformers calculated as a function of the harmonic currents: 1 40 2 26,1 ..1,01 1 I I T Th k h h h h =       + = ∑= Typical values: v “square-wave” current (spectrum inversely proportional to h (*)): k = 0.86, v current drawn by a frequency converter (THD ≈ 50%): k = 0.80. (*) in fact, the current wave form is approximately that of a square wave form. This is the case for all current rectifiers (three-phase rectifiers, induction furnaces, etc.). c “K factor”: Standard ANSI C57.110 defines a derating method based on the “K factor”, with the equation below. K I h I I I h h h h h h effh = =       = ∞ = ∞ = ∞∑ ∑ ∑ 2 2 1 2 1 2 2 1 . . The K factor produces more severe derating and is widely used in North America. In the example presented below, the resulting “K factor” is 13. Order h Ih (%) 5 30 7 20 11 14 13 11 17 8 19 7 23 5 25 4 The increase in cost for a transformer sized using the “K factor” varies from 30% to 60% depending on the rating, in a range from 15 to 500 kVA. 4.3.4 Asynchronous machines Standard IEC 60892 defines a weighted harmonic voltage factor (HVF) for which the equation and the maximum permissible value are presented below: HVF U h h h = ≤ = ∑ ∆ 2 2 13 0 02, c Example: Consider a supply voltage with the following levels of individual harmonic distortion (uh ): where U1 is the fundamental voltage: - u3 : 2 % de U1 , - u5 : 3 % de U1 , - u7 : 1 % de U1 , (i.e. a voltage THD of 3.7% and a HVF of 0.018). In this example, the harmonic voltage factor is very close to the maximum value at which the machine must be derated. Practically speaking, an asynchronous machine must not be supplied with power having a THDu greater than 10%. rms .
  • 25. 24 4.3.5 Capacitors According to standards, the rms current flowing in capacitors must not exceed 1.3 times the rated current. c Example (already presented above): Consider a supply voltage with the following levels of individual harmonic distortion (uh ): where U1 is the fundamental voltage: - u5 : 8 % de U1 , - u7 : 5 % de U1 , - u11 : 3 % de U1 , - u13 : 1 % de U1 , (i.e. a voltage THD of 10%). as a result I I eff 1 1 19= , , at the rated voltage. At a voltage level equal to 1.1 times the rated voltage, I I eff 1 1 3= , the maximum current level is overrun and the capacitors must be resized. 4.3.6 Neutral conductors Consider a system made up of a balanced three-phase source and three identical single-phase loads connected phase-to-neutral. E55534 Is Ir It In Source Load Load Load The main effects of harmonics in installations Figure 10 - flow of currents in the various conductors connected to a three-phase source rms rms . .
  • 26. 25 0 A 0 A 0 A 20 400 it t (ms) is t ir t E55535 0 A 20 400 in t (ms) E55536 The graphs in figure 11 below show an example of the currents flowing in the three phases and the resulting current in the neutral conductor. Figure 11 - example of currents flowing in the various conductors connected to a three-phase load, where In = ir + is + it In this example, the rms value of the current in the neutral conductor is e times greater than that of the current in a phase. The neutral conductor must therefore be resized accordingly.
  • 27. 26 4.5 Economic consequences 4.5.1 Power losses The Joule effect, induced by harmonic currents in the conductors and equipment, causes additional power losses. 4.5.2 Additional subscribed power costs The presence of harmonic currents makes it necessary to increase the subscribed power level and, consequently, the cost of the subscription. What is more, utilities will be increasingly inclined in the future to transfer costs to the producers of harmonic disturbances. 4.5.3 Oversizing of equipment c Derating of power sources (generators, transformers and UPSs) means they must be oversized. c Conductors must be sized taking into account the flow of harmonic currents. Because the frequencies of the harmonics are higher than that of the fundamental, the impedances encountered by these currents are higher. To avoid excessive losses due to the Joule effect, the conductors must be oversized. c The circulation of harmonic currents in the neutral conductor means the conductor must be oversized. The main effects of harmonics in installations 4.4 Disturbances to sensitive loads 4.4.1 Effects of supply-voltage distortion c Distortion of the supply voltage may disturb operation of sensitive loads, including: v regulation systems (temperature, etc.), v computer equipment, v control and monitoring systems (protection relays). 4.4.2 Disturbances on telephone lines c Harmonics can induce disturbances in circuits conducting low currents. The degree of disturbance depends on the distance over which the power and signal lines run in parallel, the distance between the lines and the frequency of the harmonics.
  • 28. 27 4.5.4 Reduction in the service life of equipment (Data obtained from the Canadian Electrical Association). When distortion of the supply voltage is in the 10% range, equipment service life is significantly reduced. Depending on the type of device, the reduction in service life may be estimated at: c 32.5% for single-phase machines, c 18% for three-phase machines, c 5% for transformers. To maintain the service life observed with a normal supply voltage, devices must be oversized. 4.5.5 Nuisance tripping and installation shutdown Installation circuit breakers are subjected to current peaks caused by harmonics. These current peaks cause nuisance tripping and result in production losses as well as costs corresponding to the time required to put the installation back into running order. 4.5.6 A few examples For the installations in the examples below, the significant economic consequences made necessary the use of harmonic filters. c Computer centre of an insurance company: In this computer centre, nuisance tripping of a circuit breaker caused a loss estimated at 100 000 euros per hour of down time. c Pharmaceutical laboratory: Harmonics provoked the failure of an engine generator set and interruption of a very lengthy test phase on a new product. The estimated loss amounted to 17 million euros. c Metallurgy factory: Induction furnaces provoked overloads causing irreversible damage to three transformers ranging from 1500 to 2500 kVA in one year, and production losses estimated at 20 000 euros per hour. c Garden-furniture factory: Failure of variable-speed drives provoked production losses estimated at 10 000 euros per hour.
  • 29. 28 Standards and the regulatory environment Inshort Harmonic levels are governed by a series of standards and regulations: c compatibility standards for distribution systems. c standards setting limit values for devices causing harmonics. c recommendations issued by utilities and applicable to installations. In order to rapidly reduce the effects of harmonic disturbances, a three-part system of standards and regulations is now in force. This system is presented below. 5.3 Standards on devices c IEC 61000-3-2 or EN 61000-3-2 for low-voltage devices drawing less than 16 A, c IEC 61000-3-4 or EN 61000-3-4 for low-voltage devices drawing more than 16 A. 5.1 Compatibility standards between distribution systems and products These standards stipulate a number of criteria concerning compatibility between distribution systems and products, such that: c the harmonic disturbances caused by a device in the system must not exceed the set limits, c each device must be capable of operating normally in the presence of disturbances at least equal to the set limits. c IEC 1000-2-2 for low-voltage public distribution systems, c IEC 1000-2-4 for low-voltage and medium-voltage industrial installations. 5.2 Distribution-system quality standards c Standard EN 50160 stipulates the characteristics of the voltage supplied by low- voltage public distribution systems, c Standard IEEE 519 (Recommended practices for harmonic control in electrical power systems) is a joint approach between utilities and their customers to limit the impact of non-linear loads. What is more, utilities encourage preventive action to limit the impact on the quality of electricity, temperature rise and reductions in the power factor. They are also considering applying financial penalties to those customers producing disturbances.
  • 30. 29 5.4 Maximum permissible harmonic values On the basis of data drawn from a number of international studies, it was possible to estimate the typical harmonic values encountered in distribution systems. Formulated on the basis of work carried out by the CIGRE organisation, the table below reflects the opinion of a large number of utilities concerning harmonic limits that should not be exceeded. Odd harmonics, non-multiples of 3 Odd harmonics, multiples of 3 Even harmonics Order h LV MV VHV Order h LV MV VHV Order h LV MV VHV 5 6 6 2 3 5 2.5 1.5 2 2 1.5 1.5 7 5 5 2 9 1.5 1.5 1 4 1 1 1 11 3.5 3.5 1.5 15 0.3 0.3 0.3 6 0.5 0.5 0.5 13 3 3 1.5 21 0.2 0.2 0.2 8 0.5 0.2 0.2 17 2 2 1 >21 0.2 0.2 0.2 10 0.5 0.2 0.2 19 1.5 1.5 1 12 0.2 0.2 0.2 23 1.5 1 0.7 >12 0.2 0.2 0.2 25 1.5 1 0.7 >25 0.2+25h 0.2+25h 0.1+25h
  • 31. 30 no Sensitive loads Line impedance Disturbing load 1 Disturbing load 2 yes Inshort There are three different types of solutions that may be used to attenuate the effects of harmonics: c modifications to the installation, c use of special devices in the power supply system (inductors, special transformers), c filters. 6.1 General solutions To limit the propagation of harmonics in the distribution system, a number of measures may be taken, particularly when designing a new installation. 6.1.1 Positioning the disturbing loads upstream in the system The overall level of harmonic disturbance increases as the short-circuit power decreases. Economic considerations aside, it is therefore preferable to connect the disturbing loads as far upstream as possible (see figure 13a). E55537 Figure 13a - supply of non-linear loads as far upstream as possible (recommended diagram) 6.1.2 Grouping the disturbing loads When preparing the single-line diagram, separate where possible the disturbing equipment from the other loads (see figure 13b). Practically speaking, the different types of loads should be supplied by different busbars. By grouping the disturbing loads, the possibilities of angular recomposition are increased. The reason is that the vector sum of the harmonic currents is lower than their algebraic sum. An effort should also be made to avoid the flow of harmonic currents in the cables, thus limiting voltage drops and temperature rise in the cables. E55538 Z2 Z1 Sensitive loads Disturbing load Where Z1 < Z2 Z1 < Z2 Figure 13b - grouping of non-linear loads and supply as far upstream as possible (recommended diagram) Solutions to attenuate harmonics
  • 32. 31 h11, h13 h5, h7, h11, h13 h5, h7, h11, h13 Non-linear loads Linear loads MV distribution system 6.1.3 Separating the sources In efforts to attenuate harmonics, an additional improvement may be obtained by supplying the different loads via different transformers, as indicated in the simplified diagram below (figure 14). E55539 Figure 14 - supply of the disturbing loads via a separate transformer This disadvantage of this solution is the increase in the cost of the installation. 6.1.4 Using transformers with special connections Special types of connection may be used in transformers to eliminate certain harmonic orders. The harmonic orders eliminated depend on the type of connection implemented: c a delta-star-delta connection eliminates harmonic orders 5 and 7 (see figure 15), c a delta-star connection eliminates harmonic order 3 (the harmonics flow in each of the phases and loop back via the transformer neutral), c a delta-zigzag5 connection eliminates harmonic order 5 (loop back via the magnetic circuit). E55543 Figure 15 - a delta-star-delta transformer prevents propagation of harmonic orders 5 and 7 upstream in the distribution system 6.1.5 Installing inductors In installations comprising variable-speed drives, the current can be smoothed by installing line inductors. By increasing the impedance of the supply circuit, the harmonic current is limited. Use of harmonic inductors on capacitor banks is a means of increasing the impedance of the inductor and capacitor assembly, for harmonics with high frequencies.
  • 33. 32 Solutions to attenuate harmonics 6.1.6 Selection of a suitable system earthing arrangement c TNC system. In TNC systems, a single conductor, the PEN, ensures protection in the event of an earth fault and carries imbalance currents. Under steady-state conditions, the harmonic currents flow through the PEN. However, the PEN has a certain impedance, resulting in slight voltage differences (a few volts) between devices which may lead to malfunctions of electronic equipment. The TNC system must therefore be used only for the supply of power circuits on the upstream end of installations and must never be used for the supply of sensitive loads. c TNS system. This system is recommended when harmonics are present. The neutral conductor and the protection conductor PE are completely separate, thus ensuring a much more stable voltage on the distribution system.
  • 34. 33 I har Non-linear load Filter Inshort In cases where the preventive measures presented above are not sufficient, the installation must be equipped with filters. There are three types of filters: c passive filters, c active filters, c hybrid filters. 6.2 Solutions when limit values are exceeded 6.2.1 Passive filters c Typical applications: v industrial installations comprising a set of devices causing harmonics with a total power rating greater than approximately 200 kVA (variable-speed drives, UPSs, rectifiers, etc.), v installations where power factor correction is required, v situations where voltage distortion must be reduced to avoid disturbing sensitive loads, v situations where current distortion must be reduced to avoid overloads. c Operating principle: An LC circuit, tuned to each of the harmonic frequencies requiring filtering, is installed in parallel with the device causing the harmonic distortion (see figure 16). This bypass circuit draws the harmonics, thus avoiding the flow of harmonics to the power source. E55540 Figure 16 - operating principle of a passive filter Generally speaking, the passive filter is tuned to a harmonic order near the one to be eliminated. A number of parallel-connected filters may be used when a significant reduction in distortion over a range of orders is required. 6.2.2 Active filters (active harmonic conditioners) c Typical applications: v commercial installations comprising a set of devices causing harmonics with a total power rating less than 200 kVA (variable-speed drives, UPSs, office equipment, etc.), v situations where current distortion must be reduced to avoid overloads. c Operating principle: Active filters are systems employing power electronics, installed in series or in parallel with the non-linear load, to provide the harmonic currents required by non- linear loads and thereby avoid distortion on the power system.
  • 35. 34 Solutions to attenuate harmonics Is I har Iact Non-linear load Linear loadHybrid filter Active filter Is I har Iact Non-linear load Linear load Active filter E55541 Figure 17 shows an example of an active filter compensating the harmonic current (Ihar = -Iact ). Figure 17 - operating principle of an active filter The active filter injects, in opposite phase, the harmonics drawn by the load, such that the line current Is remains sinusoidal. 6.2.3 Hybrid filters c Typical applications: v industrial installations comprising a set of devices causing harmonics with a total power rating greater than 200 kVA approximately (variable-speed drives, UPSs, rectifiers, etc.), v installations where power factor correction is required, v situations where voltage distortion must be reduced to avoid disturbing sensitive loads, v situations where current distortion must be reduced to avoid overloads, v situations where conformity with strict harmonic-emission limits is required. c Operating principle: The two types of filters presented above can be combined in a single device, thus constituting a hybrid filter (see figure 18). This new filtering solution combines the advantages of the existing systems and provides a high-performance solution covering a wide power range. E55542 Figure 18 - operating principle of a hybrid filter
  • 36. 35 6.2.4 Selection criteria c Passive filters offer both: v power factor correction, v large capacity for current filtering. Installations where passive filters are installed must be sufficiently stable, i.e. a low level of load fluctuations. If a high level of reactive power is supplied, it is advised to de-energise the passive filter when load levels are low. Preliminary studies for a filter must take into account any capacitor banks and may lead to their elimination. c Active harmonic conditioners compensate harmonics over a wide range of frequencies. They can adapt to any load, however, their conditioning capacity is limited. c Hybrid filters combine the strong points of both passive filters and active harmonic conditioners.
  • 37. 36 Inshort Schneider Electric offers a complete range of harmonic-distortion detection devices: c Digipact, c Powerlogic (Power Meter and Circuit Monitor), c Micrologic. Harmonic-detection devices from Schneider Electric 7.1 Detection Management of harmonic disturbances is based above all on measurement functions. Depending on the type of each installation, different types of equipment from Schneider Electric provide the solution. 7.1.1 Power meters Digipact Digipact is designed for simple applications in the field of low-voltage electrical- distribution management, including indication and remote-control functions, alarms, etc. The PM digital power meters of the Digipact range combine a number of traditionally separate functions in a single unit, including ammeter, voltmeter, wattmeter, watthour meter and harmonic measurements. To provide information on power quality in low-voltage distribution systems, Digipact indicates the: c voltage THD, c current THD, c power factor (depending on the model in the range), locally and/or remotely via a communications system and supervision software. Digipact devices are easy to wire and use. They detect power-quality problems and can be used to monitor the installation over time. On the basis of the power-quality information provided by Digipact, the operator can launch a more in-depth analysis of the installation before critical disturbance levels are reached. Digipact is part of the overall management of an electrical distribution system. Power Meter and Circuit Monitor of PowerLogic System Powerlogic products are high-performance analysis tools for medium- and low- voltage distribution systems. They are digital power meters designed to measure power quality. The Powerlogic range is made up of Power Meters (PM) and Circuit Monitors (CM). This highly modular range provides solutions for very simple needs, covered by the PMs, up to the most complex, covered by the CMs. These products are used in new or existing installations where a high level of power quality is mandatory. They may be operated both locally and remotely. Depending on their position in the installation, Power Meters offer an initial estimation of power quality. The main measurements carried out by PMs are the: c current and voltage THD, c power factor. Depending on the model in the range, these functions may be combined with time stamping and alarms. Circuit Monitors provide in-depth analysis of power quality and system disturbances. The main CM functions are: c measurement of over 100 electrical parameters, c storage in memory and time stamping of the minimum and maximum values for each electrical parameter, c alarm tripping by electrical parameters, c event logging, c recording of current and voltage disturbances, c harmonic analysis, c recording of wave forms (waveform capture). 053162054520054531 Digipact Circuit Monitor Power Meter
  • 38. 37 Micrologic : a power meter built into circuit breakers For new installations, the Micrologic H control unit, built into the circuit breaker, is a particularly useful solution for measurements on the upstream side of the installation or on large outgoing circuits. The Micrologic H control unit provides in-depth analysis of power quality and detailed diagnostics of events. The data provided by Micrologic H is intended for use on a switchboard display unit or a supervisor. It provides: c measurement of currents, voltages, active and reactive power, c measurement of the current and voltage THD and THF, c display of the current and voltage harmonic components (amplitude and phase up to the 50th order), c recording of wave forms (waveform capture). The functions offered by Micrologic H control units are equivalent to those provided by Circuit Monitor devices. 7.1.2 Using power-meter data Remote management and analysis software In the wider framework of an entire distribution system that must be monitored, Schneider Electric offers the communications systems required to interconnect all the various devices via a network, thus making it possible to centralise information and obtain an overall view of disturbances over the entire distribution system. Depending on the devices and software used, it is possible to carry out measurements in real time, calculate averages, record wave forms, anticipate on alarms, etc. The power meters transmit all the accessible data via either ModBus or the Digipact bus. The primary purpose of these systems is to assist in identifying and planning maintenance work. They can significantly reduce servicing times and installation costs for temporary devices used for on-site measurements or for sizing of equipment (filters). Schneider Electric offers two supervision-software products. Digivision The Digivision supervision software, installed on a standard PC, can be used to manage all the measurement and protection data supplied by the low-voltage devices. It represents the first level of supervision software for electrical installations. Via the PC, the operator can: c view the information provided by the PM power meters and Micrologic H control units, c set alarm thresholds, c communicate with the various connected protection and control devices to view their status and settings, as well as remotely control opening and closing. SMS SMS is a very complete software system for analysis of distribution systems, used in conjunction with Powerlogic products. Installed on a standard PC, it can be used to: c view measurements on a real time basis, c view histories, over a set period, c select the manner in which data is displayed (tables, various curves), c process statistical data (display of histograms). 056404054503 Micrologic H control unit integrated into the new NW and NT power circuit breaker Digivision supervision software
  • 39. 38 Functions Detection Diagnostics Analysis PM100 to 300 (Digipact) PM600-620 (Powerlogic) SMS CM 2050 to 2450 (Powerlogic) Digivision PM650 (Powerlogic) Micrologic H (Masterpact) Harmonic-detection devices from Schneider Electric 7.2 Selection guide The table below presents the most suitable applications of the various devices for harmonic measurements: Goal of detection PM100/300 PM650 Micrologic H CM2000/2450 Overall evaluation c c c c c c c c c c c c of distribution-system status Precise diagnostics c c c c c c c c c Analysis c c c c c c c c Advantages Basic Complete Built-into the Very complete, measurements, measurement circuit breaker, highly accurate easy to use, device with monitors measurement inexpensive, small built-in alarms incomers or device, large size and high and non- large outgoing data-storage accuracy volatile circuits without capacity, memory additional wiring programmable, or current fast transformers measurements Key: c c c : perfectly suited c c : satisfactory c : indicates a disturbance, other functions require other devices E56977 Figure 19 - relative positions of the various detection products
  • 40. 39 PM100 PM150 PM300 PM600 PM620 PM650 Micrologic H CM2150 CM2250 CM2350 CM2450 communications no communication c communication via Digipact bus c communication via RS-485 / Modbus c c c c c c c c c metering and monitoring current, voltage, frequency c c c c c c c c c c c power, energy, power factor c c c c c c c c c c c true rms metering through 31st harmonic c c c c c c c c c c c THD for voltage and current, per phase c c c c c c c c c c relay output (programmable) c c c c c c c c c c c low-voltage applications c c c c c c c c c c c medium-voltage applications (via PTs) c c c c c c c current/voltage accuracy class 0.5 % 0.5 % 0.5 % 0.2 % 0.2 % 1 % for I(1) 0.2 % 0.2 % 0.2 % 0.2 % 0.2 % 1.5 % for U demand current per phase, present and maximum c c c c c c c demand power per phase, present and maximum c c c c c c c c time/date stamping c c c c c c c user-configurable alarms c c c c c c c predicted demand power c c c c c c c synchronised demand via comm. c c c c c c c min/max recording c c c c c c c on-board memory for data and event logs c c c c c c c advanced monitoring and analysis time/data stamping of min/max values c c c c c optional input/output module c c c c c front optical comm. port c c c c extended memory (2) c c c c field-upgradeable firmware c c c c waveform capture for harmonic analysis c c c c voltage disturbance monitoring (dips, spikes) c c programmable for special applications c c (1) Including the sensors. (2) User-accessible memory of100 k standard on all CM devices, 512 k and 1 M optional. Selection table
  • 41. 40 Inshort Harmonic-management solutions from Schneider Electric Schneider Electric offers a complete range of harmonic-management services: c expert analysis, c measurement and surveillance devices, c filters. 8.1 Analysis and diagnostics from Schneider Electric Selection of the best solution, from both the technical and economic point of view, requires an in-depth study of the installation. MV and LV diagnostics When an expert from a Schneider Electric CEAT unit is called in, the user is guaranteed that the proposed solution will be effective (e.g. a guaranteed maximum THDu level). The harmonic analysis and diagnostics are carried out by an engineer specialised in the field of disturbances in electrical distribution systems and equipped with powerful analysis and simulation equipment. The service provided by Schneider Electric is divided into steps: c measurement of disturbances, in current and in phase-to-neutral and phase-to- phase voltages, on the disturbing loads, on the disturbed outgoing circuits and the power sources, c a computer model of the measured phenomena is created, providing a precise explanation of their causes and optimised selection of the possible solutions, c a complete report is drawn up, indicating: v the measured levels of disturbance, v the maximum permissible levels of disturbance (IEC 61000, IEC 34, etc.), c the performance of the selected solutions is guaranteed, c the final solution is implemented, using the selected equipment and systems. The entire service is certified ISO 9002.
  • 42. 41 8.2 Specific Schneider Electric products 8.2.1 Passive filters Passive filters are made up of inductors and capacitors set up as resonant circuits tuned to the frequency of the harmonic order to be eliminated. A system may comprise a number of filters to eliminate several harmonic orders. General characteristics Voltage 400 V three phase Power rating up to 265 kvar / 470 A for the 5th order filter up to 145 kvar / 225 A for the 7th order filter up to 105 kvar / 145 A for the 11th order filter Enclosure Prisma 8.2.2 Active filters of MGE UPS SYSTEMS General characteristics Voltage 400 V Conditioning capacity per 20 to 120 A rms phase (A rms) Conditioned harmonic orders 2 to 25, complete spectrum or selected orders currents Harmonic Load THDi / Upstream THDi greater than 10 at rated load attenuation on conditioner Functions displacement power-factor correction, 7-language alphanumeric display, diagnostics and maintenance system, parallel connection, remote control, communications interface JBus/RS485 8.2.3 Hybrid filters Hybrid filters combine the advantages of a passive filter and a SineWave active harmonic conditioner in a single unit. General characteristics Passive filter 5th order harmonics Active harmonic conditioner 20 to 180 A Voltage 400 V three phase Reactive energy compensation up to 265 kvar Harmonic orders conditioned 2 to 25 Total harmonic current up to 440 A Enclosure Prisma Schneid1 Passive filter Hybrid filter Schneid2 Active filter of MGE UPS SYSTEMS sinewave
  • 43. 42 8.2.4 Selection guide Type of application Rectiphase SineWave MGE UPS Rectiphase passive filter SYSTEMS harmonic hybrid filter conditioner Commercial buildings c c c c c c (computer systems, air- conditioning, lighting, lifts) Paper, cardboard, plastics c c c c c c industry (conveyers, winding/unwinding equipment) Water-treatment (pumps, c c c c c c c c mixers) Handling (cranes, ski lifts) c c c c c c Key: c c c : perfectly suited c c : perfectly suited technically, but costly c : satisfactory Harmonic-management solutions from Schneider Electric
  • 44. 43 c ISF : Technical Seminar: “Understanding and managing harmonics” (in French) c ISF : Technical Publications: “Harmonics in electrical installations” (in French) c IEC standards c Utility recommendations c EDF: Harmonique 5.1 software, User Manual (in French) c EDF: Les cahiers de l’ingénierie: Management of harmonics on industrial and commercial distribution systems, Parts 1 and 2 (Ref. GEDO 1.48.B.07/96 and 1.48.B.01/97) (in French) c Merlin Gerin: Guide to reactive-energy compensation and harmonic filtering - HV/MV (Ref. CG0065) c Schneider Electric: “Cahiers Techniques” publications nos. 152, 159, 160, 183 Bibliography
  • 45. As standards, specifications and designs change from time to time, please ask for confirmation of the information given iin this publication. Published by: Schneider Electric Designed by: AMEG Printed by: Schneider Electric Industries SA 5 rue Nadar 92506 Rueil-Malmaison Cedex France Tel : +33 (0)1 41 29 82 00 Fax : +33 (0)1 47 51 80 20 http://www.schneiderelectric.com This document has been printed on ecological paper. DBTP152GUI/E DBTP152GUI/E-©1999SchneiderElectric-Allrightsreserved 11-99