Download to read offline
![M. Viquar Mohiuddin et al. Int. Journal of Engineering Research and Applications www.ijera.com
ISSN : 2248-9622, Vol. 5, Issue 3, ( Part -1) March 2015, pp.37-41
www.ijera.com 37 | P a g e
Effect of Composition of Sand Mold on Mechanical Properties
and Density of Al-Alloy Casting Using Taguchi Design Approach
M. Viquar Mohiuddin1
, A. Krishnaiah2
, S. Ferhathullah Hussainy3
1, 3
(Mechanical Engineering Department, Muffakham Jah College of Engineering & Technology, India)
2
(Mechanical Engineering Department, Osmania University, India)
ABSTRACT
Sand casting process involves many parameters such as size of the sand grain, amount of clay, percentage of
moisture, green compressive strength, permeability, number of ramming, shatter index, mold type, mold
hardness, etc. to name a few. In this paper the effect of sand mold casting process parameters, especially
composition of molding sand, on hardness, tensile strength and density of aluminium alloy castings are studied.
While other parameters are kept constant, grain fineness number, amount of clay, amount of moisture and
number of ramming are varied. Experiments are conducted based on Taguchi’s L9 orthogonal array and cast
specimens are tested to obtain their mechanical properties and density. The results obtained are evaluated to
optimize process parameters at three different levels. . Optimum levels are found as Grain fineness number 55,
two times ramming, 12 percent Clay and 13 percent Moisture. Based on optimum level of process parameters,
confirmation test is conducted and results are found to be in confidence level.
Keywords - Al-alloys, Casting parameters, Mechanical properties, Mold composition, and Taguchi method.
I. INTRODUCTION
Casting is a process of obtaining metallic
products by allowing molten metal to get filled and
solidify in a mold. The quality of the product is
determined by the quality of the mold. In this
competitive environment, it is very much important
to maintain the quality of products and produce them
right first time and every time. If the casting process
is not being managed properly, the problems may
aggravate and result in defects which render the
products weak and of low quality, thus making them
unfit for use [1]. In spite of science getting to a new
level every passing minute, there are defects, flaws
or imperfections which still remain and are very
difficult to eliminate from castings. Hence to
overcome the problems in the casting, optimization
of the process parameters should be done.
Optimization is required right from the stage of
selecting the sand to removal of casting from the
sand mold.
Genichi Taguchi has introduced several
statistical tools and concepts for quality
improvement. According to him, the key element for
achieving high quality and low cost product is
parameter design. Through parameter design optimal
levels of process parameters (or control factors) are
selected such that the influence of uncontrollable (or
noise) factors causes minimum variation of system
performance or response. These parameters should
be controlled to improve the quality of both casting
process and product [2].
In this study, aluminium alloy castings of same
shape and size produced by sand casting process at
selected sand grain fineness number, amount of clay,
amount of moisture and number of ramming. The
castings produced are tested for mechanical
properties and density. The aim of study is to
determine the optimum levels at which these
parameters produce quality castings.
II. METHODOLOGY
Objective of present study is to make out
most influencing process parameters of aluminum
alloy sand mold casting and to optimize them for
improved mechanical properties and density to
produce quality castings. Taguchi DoE methodology
is applied in this study to assess the influence of
process parameters on quality of castings. Selection
of orthogonal array depends on number of
parameters and their levels, here number of
parameters is ‘four’ and number of levels is ‘three’
as given in Table 1.
Table 1: Parameters and their levels
Parameters CODE
LEVELS
1 2 3
Grain Fineness
No.
A 40 55 70
% of Clay B 6 9 12
% of Moisture C 7 10 13
No. of Ramming D 2 3 4
RESEARCH ARTICLE OPEN ACCESS](https://image.slidesharecdn.com/h503013741-150323043920-conversion-gate01/85/Effect-of-Composition-of-Sand-Mold-on-Mechanical-Properties-and-Density-of-Al-Alloy-Casting-Using-Taguchi-Design-Approach-1-320.jpg)
![M. Viquar Mohiuddin et al. Int. Journal of Engineering Research and Applications www.ijera.com
ISSN : 2248-9622, Vol. 5, Issue 3, ( Part -1) March 2015, pp.37-41
www.ijera.com 37 | P a g e
Effect of Composition of Sand Mold on Mechanical Properties
and Density of Al-Alloy Casting Using Taguchi Design Approach
M. Viquar Mohiuddin1
, A. Krishnaiah2
, S. Ferhathullah Hussainy3
1, 3
(Mechanical Engineering Department, Muffakham Jah College of Engineering & Technology, India)
2
(Mechanical Engineering Department, Osmania University, India)
ABSTRACT
Sand casting process involves many parameters such as size of the sand grain, amount of clay, percentage of
moisture, green compressive strength, permeability, number of ramming, shatter index, mold type, mold
hardness, etc. to name a few. In this paper the effect of sand mold casting process parameters, especially
composition of molding sand, on hardness, tensile strength and density of aluminium alloy castings are studied.
While other parameters are kept constant, grain fineness number, amount of clay, amount of moisture and
number of ramming are varied. Experiments are conducted based on Taguchi’s L9 orthogonal array and cast
specimens are tested to obtain their mechanical properties and density. The results obtained are evaluated to
optimize process parameters at three different levels. . Optimum levels are found as Grain fineness number 55,
two times ramming, 12 percent Clay and 13 percent Moisture. Based on optimum level of process parameters,
confirmation test is conducted and results are found to be in confidence level.
Keywords - Al-alloys, Casting parameters, Mechanical properties, Mold composition, and Taguchi method.
I. INTRODUCTION
Casting is a process of obtaining metallic
products by allowing molten metal to get filled and
solidify in a mold. The quality of the product is
determined by the quality of the mold. In this
competitive environment, it is very much important
to maintain the quality of products and produce them
right first time and every time. If the casting process
is not being managed properly, the problems may
aggravate and result in defects which render the
products weak and of low quality, thus making them
unfit for use [1]. In spite of science getting to a new
level every passing minute, there are defects, flaws
or imperfections which still remain and are very
difficult to eliminate from castings. Hence to
overcome the problems in the casting, optimization
of the process parameters should be done.
Optimization is required right from the stage of
selecting the sand to removal of casting from the
sand mold.
Genichi Taguchi has introduced several
statistical tools and concepts for quality
improvement. According to him, the key element for
achieving high quality and low cost product is
parameter design. Through parameter design optimal
levels of process parameters (or control factors) are
selected such that the influence of uncontrollable (or
noise) factors causes minimum variation of system
performance or response. These parameters should
be controlled to improve the quality of both casting
process and product [2].
In this study, aluminium alloy castings of same
shape and size produced by sand casting process at
selected sand grain fineness number, amount of clay,
amount of moisture and number of ramming. The
castings produced are tested for mechanical
properties and density. The aim of study is to
determine the optimum levels at which these
parameters produce quality castings.
II. METHODOLOGY
Objective of present study is to make out
most influencing process parameters of aluminum
alloy sand mold casting and to optimize them for
improved mechanical properties and density to
produce quality castings. Taguchi DoE methodology
is applied in this study to assess the influence of
process parameters on quality of castings. Selection
of orthogonal array depends on number of
parameters and their levels, here number of
parameters is ‘four’ and number of levels is ‘three’
as given in Table 1.
Table 1: Parameters and their levels
Parameters CODE
LEVELS
1 2 3
Grain Fineness
No.
A 40 55 70
% of Clay B 6 9 12
% of Moisture C 7 10 13
No. of Ramming D 2 3 4
RESEARCH ARTICLE OPEN ACCESS](https://image.slidesharecdn.com/h503013741-150323043920-conversion-gate01/75/Effect-of-Composition-of-Sand-Mold-on-Mechanical-Properties-and-Density-of-Al-Alloy-Casting-Using-Taguchi-Design-Approach-1-2048.jpg)
![M. Viquar Mohiuddin et al. Int. Journal of Engineering Research and Applications www.ijera.com
ISSN : 2248-9622, Vol. 5, Issue 3, ( Part -1) March 2015, pp.37-41
www.ijera.com 39 | P a g e
3.3.3 Degassing process
Degassing is done to flush out the gases
absorbed in the molten metal during melting.
Hydrogen gas absorption in molten metal is shown
in equation 1. The liberated hydrogen gas occupies
interstitial spaces of metal which may lead to
formation of porosity if not removed.
2 2 32 3 6Al H O Al O H -------- (i)
Tablets of hexachloroethane (C2Cl6) are added
to molten aluminium for degassing purpose.
Chemical reaction that liberates stable chlorine gas
is shown in the equation 2, which flushes hydrogen
gas by creating partial pressure in molten
aluminium[3].
2 6 22 3C Cl C Cl -------- (ii)
3.3.4 Fluxing process
For the protection of molten metal from getting
oxidized, coveral-36 powder is used as flux which is
spread on the top of the molten charge as shown in
Fig. 3.
Figure 3: Adding flux to molten metal
3.3.5 Temperature Measurement
Digital temperature indicators connected to k-
type thermocouples are used for measuring
temperature of molten metal for pouring the casings.
3.3.6 Pouring of molds
All nine molds prepared are poured (as shown
in Fig. 4) to produce test casting (as shown in Fig.
5). Fettling process is done to take out castings after
solidification and cooling of molds.
Figure 4: Molds after pouring
Figure 5: Test castings after fettling
Finally machining is done on CNC machine to
prepare eighteen standard test specimens (as shown
in Fig. 6) as per ASTM A370 standards for testing
tensile strength.
Figure 6: Tensile test specimens
Universal tensile strength testing machine
(UTE-40) is used for measurement of tensile
strength; Hardness is measured using Dynamic
hardness tester (DHT-6); and measurement of
density is done by using Archimedes Principle.
IV. RESULTS AND DISCUSSION
As two test samples are prepared for each
experiment, average value of two test samples are
taken and the results obtained are listed against each
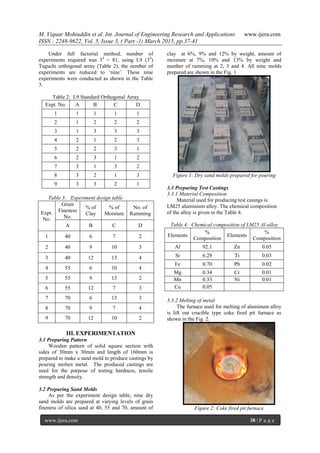
experiment as shown in Table 5.](https://image.slidesharecdn.com/h503013741-150323043920-conversion-gate01/85/Effect-of-Composition-of-Sand-Mold-on-Mechanical-Properties-and-Density-of-Al-Alloy-Casting-Using-Taguchi-Design-Approach-3-320.jpg)
![M. Viquar Mohiuddin et al. Int. Journal of Engineering Research and Applications www.ijera.com
ISSN : 2248-9622, Vol. 5, Issue 3, ( Part -1) March 2015, pp.37-41
www.ijera.com 40 | P a g e
Table 5: Experimental Results
Expt.
No.
Response
Hardness
(BHN)
Tensile
Strength (MPa)
Density
(g/cm3
)
1 41 104 2.527
2 41 107 2.556
3 51 126 2.676
4 40 103 2.513
5 46 119 2.641
6 44 118 2.628
7 42 111 2.583
8 42 109 2.571
9 42 115 2.601
Total 391 1012 23.296
Mean 43.44 112.4 2.59
4.1 Calculating S/N ratios
For analysis of results obtained from
experiments, the S/N ratios were calculated [4]. As
hardness, tensile strength and density were selected
as a quality characteristics, for all the three
responses ‘larger the better’ S/N ratio is considered.
For larger the better S/N ratio is
4.1.1. S/N ratio for Hardness
S/N ratio for experiment 1 for Hardness is
= 32.25
Similarly, S/N ratio values for all the nine
experiments for hardness, tensile strength and
density are calculated and tabled as shown in the
Table 6.
Table 6: S/N – Ratios for responses
Expt.
No.
S/N Ratios
Hardness
Tensile
strength
Density
1 32.25 40.38 8.052
2 32.25 40.57 8.151
3 34.15 41.98 8.549
4 32.04 40.24 8.003
5 33.25 41.52 8.435
6 32.86 41.41 8.392
7 32.46 40.91 8.242
8 32.46 40.74 8.202
9 32.86 41.19 8.302
The average S/N values are calculated for each
factor and each level.
S/NA,1 = Average S/N ratio for factor A at level 1
S/NA,1= (32.25+32.25+34.15)/3 = 32.88
Similarly the average S/N values are calculated
for each factor and level for hardness, tensile
strength and density and tabulated as shown in the
Tables 7, 8 and 9 respectively.
Table 7: S/N Ratio response table for hardness
LEVEL A B C D
1 32.88 32.25 32.52 32.78
2 32.71 32.65 32.38 32.52
3 32.59 33.29 33.28 32.88
Max-Min 0.29 1.04 0.90 0.36
Rank 4 1 2 3
Optimum
level
A1 B3 C3 D3
Table 8: S/N Ratio response for tensile strength
LEVEL A B C D
1 40.97 40.51 40.99 41.03
2 41.05 40.94 40.64 40.96
3 40.94 41.52 41.47 40.98
Max-Min 0.11 1.01 0.83 0.07
Rank 3 1 2 4
Optimum
level
A2 B3 C3 D1
Table 9: S/N Ratio response table for density
LEVEL A B C D
1 8.250 8.099 8.215 8.263
2 8.276 8.262 8.152 8.261
3 8.248 8.414 8.408 8.251
Max-Min 0.028 0.315 0.283 0.012
Rank 3 1 2 4
Optimum
level
A2 B3 C3 D1
4.2 Response Curves
From the S/N ratio response tables, the response
curves drawn are as follows.](https://image.slidesharecdn.com/h503013741-150323043920-conversion-gate01/85/Effect-of-Composition-of-Sand-Mold-on-Mechanical-Properties-and-Density-of-Al-Alloy-Casting-Using-Taguchi-Design-Approach-4-320.jpg)
![M. Viquar Mohiuddin et al. Int. Journal of Engineering Research and Applications www.ijera.com
ISSN : 2248-9622, Vol. 5, Issue 3, ( Part -1) March 2015, pp.37-41
www.ijera.com 41 | P a g e
Figure 7: Response curve for hardness
Figure 8: Response curve for tensile strength
Figure 9: Response curve for density
Where,
A – grain fineness number, B – amount of clay, C –
amount of moisture, and D - number of rammings.
From the S/N Ratio response curves, the
optimum level for process parameters are grain
fineness number – 55, amount of clay – 12%,
amount of moisture – 13%, and Number of
rammings – 2.
4.3 Confirmation Test:
Confirmation test is conducted based on
optimum level of process parameters, the results
obtained from confirmation test are hardness - 53
BHN, tensile strength - 130 MPa, and density -
2.69g/cm3
. These values are found to be with in the
confidence level.
Hence hardness, tensile strength and density of
aluminum alloy castings produced by sand casting
process is increased from 41 BHN, 104 MPa and
2.52 g/cm3
to 53 BHN, 130 MPa and 2.69g/cm3
respectively.
V. CONCLUSIONS
The experiments conducted have shown that the
process parameters selected have significant
influence on mechanical properties and density of
sand casting. The optimum levels for process
parameters are grain fineness number – 55, amount
of clay – 12%, amount of moisture – 13%, and
Number of rammings – 2. Amount of clay and
amount of moisture are the significant control
factors among the selected factors. The confirmation
test results obtained for hardness, tensile strength
and density are 53 BHN, 130 MPa, and 2.69 g/cm3
respectively. These results are found to be in
confidence level.
Casting defects occur because optimum
conditions were not met during casting process. By
this study it is concluded that the data obtained can
be applied to set the parameters at optimum level to
improve mechanical properties (hardness, tensile
strength) and enhance density so as to minimize
defects and improve quality of aluminium alloy sand
castings.
REFERENCES
[1] Datta, G.L., Sand and mold related casting
defects, Indian Foundry Journal, 44(9),
1998, 148-154
[2] Mekonnen Liben Nekere, Ajit Pal Singh,
Optimization of aluminium blanks sand
casting for process by using Taguchi
Robust Design Method, International
Journal for Quality research Vol.6, No.1,
2012, 81-97.
[3] M. Viquar Mohiuddin, et. al., Experimental
study of sand mold process parameters on
Al-alloy sand castings using DoE, ISOR
journal of Mechanical and Civil
Engineering, Vol. 11, Issue 6, 2015, 01-06.
[4] Phadke, M.S., Quality engineering using
robust design. Prentice Hall International,
Inc.,1989, Englewood Cliffs, New Jersey,
NJ.
[5] Taguchi G., Introduction to quality
engineering: design quality into products
and process, (Asian Productivity
Organization, Tokio, 1986).](https://image.slidesharecdn.com/h503013741-150323043920-conversion-gate01/85/Effect-of-Composition-of-Sand-Mold-on-Mechanical-Properties-and-Density-of-Al-Alloy-Casting-Using-Taguchi-Design-Approach-5-320.jpg)

This study investigates the impact of sand mold composition on the mechanical properties and density of aluminum alloy castings using Taguchi's design approach. Key parameters such as grain fineness, clay content, moisture, and ramming frequency were optimized, resulting in improved hardness, tensile strength, and density. The results indicated that optimal levels for these parameters significantly enhance the quality of aluminum castings, reducing defects during the casting process.


![МОСТ [Мастерская Осознанного Танца]](https://cdn.slidesharecdn.com/ss_thumbnails/jpeg-150324054309-conversion-gate01-thumbnail.jpg?width=640&height=640&fit=bounds)


