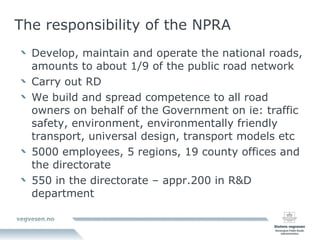
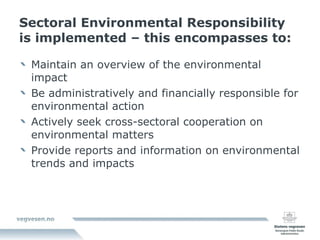
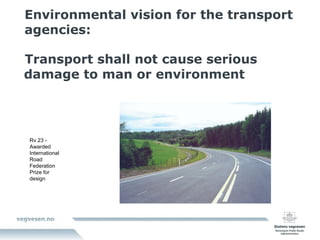
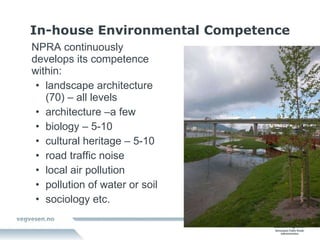
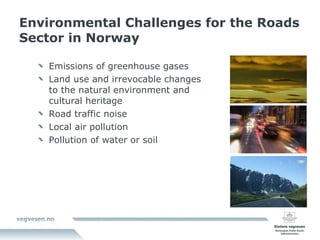
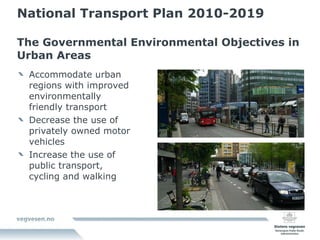
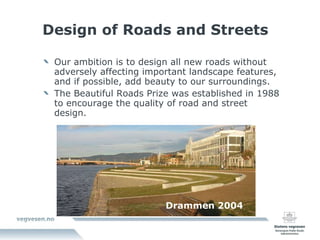
The Norwegian Public Roads Administration   -  and the environment Gyda Grendstad Special adviser to the Director General  Staff of the Director General Norwegian Public Roads Administration
The responsibility of the NPRA Develop, maintain and operate the national roads, amounts to about 1/9 of the public road network Carry out RD We build and spread competence to all road owners on behalf of the Government on ie: traffic safety, environment, environmentally friendly transport, universal design, transport models etc 5000 employees, 5 regions, 19 county offices and the directorate 550 in the directorate – appr.200 in R&D department
Sectoral Environmental Responsibility is implemented – this encompasses to: Maintain an overview of the environmental impact Be administratively and financially responsible for environmental action Actively seek cross-sectoral cooperation on environmental matters Provide reports and information on environmental trends and impacts
Environmental vision for the transport agencies: Transport shall not cause serious damage to man or environment Rv 23 - Awarded International Road Federation Prize for design
In-house Environmental Competence NPRA continuously develops its competence within: landscape architecture (70) – all levels architecture –a few biology – 5-10 cultural heritage – 5-10 road traffic noise  local air pollution pollution of water or soil sociology etc.
Main design attitude and work method Adaptation to the landscape rather than contrast Site / landscape analysis Multidisciplinary teams are a mandatory for all projects A management plan for environment is mandatory for the construction and operation phase Public participation in the planning process
Environmental Challenges for the Roads Sector in Norway   Emissions of greenhouse gases Land use and irrevocable changes to the natural environment and cultural heritage  Road traffic noise Local air pollution Pollution of water or soil
Emissions of greenhouse gases Norway has committed to the Kyoto Protocol - stabilizing emissions at 1% above the 1990 emission level – also a goal to reduce emissions by 30% within 2020 compared to 1990 - willing to have a goal of 40%  - in order to reach an international agreement where other countries make the same commitment Emissions are expected to increase without new measures. The transport sector is increasing it’s emissions more than other sectors. Road transport contributes to about 18 % of national emissions, about 10 mill. tons per year  - goal is to  contribute  to a red. of 2,5-4 mill. tons compared to trend
Measures to reduce CO 2 -emissions Purchase tax to encourage reduced emissions per vehicle – the average of new cars sold 142 g/km at present, the target is 120 g/km by 2012 Measures to reduce motorised transport demand, such as land use, public transport, cycle and walking facilities, restrictions on car use in the bigger cities are recommended, but in the hands of local and regional governments ( potential of 0,6 mill.tons reduction) More bio fuels  Fuel taxes  Climate cure – new report on mitigation - english version available: http://www.klimakur.no/Templates/Public/Pages/Article.aspx?id=693&epslanguage=en
Expected effects of climate change in Norway Temperature will increase by 1,5-6 degrees Celsius in the coming century More rain, more intense rain, more storm and stronger storms, especially along the coast and in the northern parts of Norway Shorter winters with the temperatures that vary more frequently around zero Sea levels will increase
Natural environment Reducing negative impacts from roads and road traffic by: Better integration of new roads in the landscape Reducing the barrier effect for wildlife and people Using native species in road side vegetation – successful. Produce a plan for/against invasive non native species Improve problem stretches/points on existing roads
Photo: Stig Persson
Cultural heritage Reducing negative impacts by: Better integration of new roads in the landscape –cityscape included Follow up the national plan for protection of roads, highways, bridges and associated cultural relics – national bridges and roads are protected - a number of them are still in use
Road Traffic Noise About 25 % of the population are exposed to noise above 55 dB Implementing EU directives Source oriented measures (pavement, tyres) Indoor noise limit    legal requirements for noise insulation of houses with more than 42 dB Influence land use planning
Local air pollution 70.000 are exposed to pollution above the national limits – mostly in the larger cities Emission of small particles from vehicles is a major source to local air pollution in urban areas Restrictions on the use of studded tyres in the largest cities have been effective Reduced speed limits (80-60 km/h)on two main arterial roads into Oslo in winter
Pollution of water or soil Cleaning surface water of particles, particle bound heavy metals and PAH Extensive use of de-icing salt causes problems in lakes, kills roadside trees, pollutes ground water and private wells; - a strategy for reduced salt use is being developed Measures at vulnerable water recipients
National Transport Plan 2010-2019 The Governmental Environmental Objectives in Urban Areas Accommodate urban regions with improved environmentally friendly transport Decrease the use of privately owned motor vehicles Increase the use of public transport, cycling and walking
Development in daily travel on a national level Source: TØI The National Travel Survey  2005 Percentages Means of transport 1998 2001  2005 On foot 19 22 20 Bicycle 6 4  5 Public transport 9 9 8 Car driver  53 52 54 Car passenger  11 12 12 MC/Other 1 1 1 Sum  100  100 100
In land person traffic 1980 - 2006 Air Sea Road Rail Bill person km Source: TØI, Urbanet, Norconsult
Development person transport Source: TØI In percentages Change passenger transport 2006=100 Air Boat Rail Bus Car
NTP 2010 – 19 – to improve urban transport: It is not enough to just to improve conditions for public transport, walking and cycling  Competition between modes in cities must change in favour of public transport, cycling and walking  Restrictions on the use of private cars in towns and cities are recommended - parking, congestion charges, more 30 km/h, pedestrian zones etc Land use must support public transport , walking and cycling
Toll rings and traffic effects Toll rings with a low and ”flat” charge, typically 2  £, have little effect on traffic amounts The city of Trondheim had a higher charge 06 – 1800h for 14 years. Removed in 2006  Traffic increased by 12 %  between 0600 – 1800 h, resulting in slower buses and more congestion, the overall increase was 5% (not much more than trend) New toll packages for cities may include tolls with “congestions charge” –effect Legal framework for congestion charges is being prepared
The Stockholm example First: Cycle path network improved in the centre,  cycle traffic increased by 50% Public transport was improved – more buses, but not more passengers
The Stockholm example Second: Congestion charges introduced ÷ 22% car traffic + 5-6 % public transport More cycle traffic Commerce in the centre is unaffected The congestion charges is assessed to be cost effective and to make Stockholm more attractive Congestion charges is permanent from 2007
Parking policy is recommended  Source: National Travel Survey TØI  2001/2005 11 % 29 % 41 % 20 % No 4 % 8 % 75 % 12 % Yes Free and sufficient parking 6,0 % 13,5 % 66,3 % 14,2 % Average of all answers Car passenger/ MC/Other Public transport Car  driver Walk /cycle Travel mode
National Transport Plan 2010 -2019 National Cycling Strategy Main objectives: The goal to increase the share of cycling from 5 to 8 % of all trips - means that the amount of cycling has to double within 2019 in the larger cities 80% of children up to 15 shall walk or cycle to/from school (today 60%).
Norwegian Public Roads administration was given a new role in 2006: “ to be the  initiator  of increased cycle use, and spread knowledge about cycle traffic to municipalities, regions, the public transport industry, employers, the travel industry and others".
Cycling cities in region south works well Ambition: Increase cycling by 50% within 2015 Measures: Marketing, new facilities, improvements to existing facilities. Joint financing state, region, municipality Km on bike pr. innhabitant pr day 46% 9% 106% 36% 14% Source: Sintef
Explanations for high shares of cycling in cities 1.Difference in travel time between car and bicycle 2. Parking charges  for cars 3. Share of public transport 4. Area use and density  5. Population 6. Climate 7. Topography Source: Fitzberaad Continous and integral . The cycling policies of Groningen and other cycling cities – se www.sykkelby.no
Viktige anbefalinger for NTP 2010-2019 Continuous main cycle network in cities is prioritised   The aim is: Cyclists can follow the shortest routes and reach closer to the destination than cars –to plan for 20-30 km/h cycling Cycle traffic is given priority over, or is on an equal footing with, cars on public roads and streets  Accessibility and parking for bicycles is given priority at shopping centres and public transit nodes
Safe routes school, is prioritised. The objective is that parents shall feel that it is safe to let the children cycle to school  Inspection and improvements of existing cycle facilities
Competence building and communication Network of cycling cities www.sykkelby.no Campaigns for safer and more cycling The picture represents Swedish – Shared space – function when amounts of walking and cyclist are high enough to ”outrank” cars. Not a good solution for disabled people
50% of all trips less than 1km are carried out by car. There is a potential for more walking and on short trips NPRA is developing a national walking strategy
Increased public transport Local public transport is a joint responsibility of the national, regional and local authorities Co-operation between stakeholders is prioritised Governmental funding is increased NPRA is given an increased responsibility for competence building  Transport nodes The 13 largest urban regions are  prioritized and can apply for extra funding if they apply measures that results in less car use and more public transport
Universal design The goal in the National Transport Plan 2010-2019 is to  improve accessibility for all Legal framework is improved making universal design a requirement
Universal design Economic incentives to the municipal level have existed for 5 years, the total amount being 50 mill Nkr (about 5 mill. pounds). The local or regional level has to contribute with at least 25% of the costs Increased public investments in universal design. Access to public transport is prioritised Competence building – new road design manual etc
Universal design is a prerequisite in all new projects Indicators of direction, contrasting colours, acoustic contrast, indicator of dangerous area, requirements to gradient, width of pavement etc
New road and street design manual : In cities nets should be defined first – then design on stretches/streets For pedestrians For bicycle traffic Main net Local net Public transport- private cars- og freight transport Thorough fares Transport net between town boroughs  Transport net to / from terminals Local net Nets will partly overlaps – and design requirements and advice is related to nets
Three main solutions for bicycle traffic Shared carriageway bicycle and cars – mixed use –if low speed and low traffic volumes Cycle lane in the carriageway – if higher speed and/or traffic volumes Separate cycle lane – if school routes – if high speed( more than 50 km/h and/or traffic volumes) Recommended facilities vary between the main net and the rest. In addition public transport lanes can be part of the cycle network if width and speed allows In line with Dutch and other international “best practice”, ie the London Bicycle Facility Guideline
Example Norheimsund – mixed use – street enhancement project on a national road through a small town –  done where traffic is too low to require a bypass  - AADT 4000 or less –  taming the motorized traffic for the benefit of the local community  –  30 km/h an ambition  –  narrow carriageway 6,5m  –  trees, humps etc
2. Cycle lane in the carriage way
 
3. Separate pedestrian and cycle lane – usually asphalted – 3m
Pavements Required on two sides in streets – Pavement is zoned – min. width 2,5m –universal design requirement
 
Eks.: Streets with 2 lanes for motorised vehicles and 2 cycle lanes  3 3 3 3 3 3 3,25 m if a lot of heavy traffic Recommended when: Cross section of carriageway
Bicycle streets Street prohibited for motorized traffic, a solution to prioritize cycle traffic in pedestrian areas - 5,5m –if  delivery of goods with lorries
Ex. Carriage way with public transport lane and cycle lane At speed limit  30 and 40 km/h   and delays in public transport In one or both directions, should have a width that enables cycling.
Signal regulated junctions Withdrawn  stop line or bicycle box  Should be used – increases traffic safety
Design of Roads and Streets Our ambition is to design all new roads without adversely affecting important landscape features, and if possible, add beauty to our surroundings. The Beautiful Roads Prize was established in 1988 to encourage the quality of road and street design. Drammen 2004
BRP 2004- New main road network i Drammen
Flekkefjord – typical city street in small city – shared space bicycles cars Some examples…………..
Tynset bridge
BRP 1997 – Mannheller - ferry quai
BRP 1997 - Hafrsfjord
Lærdal tunnel 24,5 km -Awarded prize for lightning design – longest road tunnel in the world
BRP 2002 - Drøbak
E18 Leonardo Bridge, bicycle- andd walkway in Ås
BRP 2008 Vollen – road enhancement
National   tourist routes 18 routes in unique landscape – finished 2016 1,8 bill.Nkr 2016 (180 mill pounds) Internationally recognised for innovative design www.turistveg.no
The goals Strengthen the competitiveness of Norwegian  tourism internationally Increase the number of tourists visiting Norway Strengthen business, employment opportunities and settlement in the outlying districts (Included in the National Transport Plan 2010-2019 and the National tourism strategy
Requirements Quality throughout  Board, architectural council, selected innovative professionals in a pool, criteria for choosing sections of road, information system, branding National management Ensures consistent quality, priority and a good overview  Commitment of other participants ” Joint financing” and business development
18 National tourist routes   National tourist routes   in the north Varanger Havøysund Senja Andøya Lofoten Helgelandskysten nord Helgelandskysten sør   National tourist routes   in the south Atlanterhavsvegen Geiranger-Trollstigen Gamle Strynefjellsveg Sognefjellet Aurlandsfjellet Gaurlarfjellet Hardanger Ryfylke Jæren Valdresflye Rondane
Norwegian landscape (mountains, waterfalls, fjords, the coast)  The driving experience  Architecture (arranged experiences) Art Cultural history  The concept
 
Geiranger  - World heritage
Geiranger
Trollstigen/ Geiranger- Trollstigen
Sohlbergplassen/ Rondane
Tungeneset/ Senja
Mefjell/ Sognefjellet
Wiewing platform - Aurland
Stegastein/ Aurlandsfjellet
Avalanche protection measures
Lofoten avalanche protection
New Norwegian Architectural Policy from the Government in the autumn of 2009 Landscape architecture included The policy will be further developed Emphasis on climate, sustainability, city transformation and growth of cities Knowledge and innovation National Conference in 2010 – landscape architecture is the main theme  www.oslotriennale.no

Gyda Grendstad - Cabe UDSS Keynote

  • 1.
    The Norwegian PublicRoads Administration - and the environment Gyda Grendstad Special adviser to the Director General Staff of the Director General Norwegian Public Roads Administration
  • 2.
    The responsibility ofthe NPRA Develop, maintain and operate the national roads, amounts to about 1/9 of the public road network Carry out RD We build and spread competence to all road owners on behalf of the Government on ie: traffic safety, environment, environmentally friendly transport, universal design, transport models etc 5000 employees, 5 regions, 19 county offices and the directorate 550 in the directorate – appr.200 in R&D department
  • 3.
    Sectoral Environmental Responsibilityis implemented – this encompasses to: Maintain an overview of the environmental impact Be administratively and financially responsible for environmental action Actively seek cross-sectoral cooperation on environmental matters Provide reports and information on environmental trends and impacts
  • 4.
    Environmental vision forthe transport agencies: Transport shall not cause serious damage to man or environment Rv 23 - Awarded International Road Federation Prize for design
  • 5.
    In-house Environmental CompetenceNPRA continuously develops its competence within: landscape architecture (70) – all levels architecture –a few biology – 5-10 cultural heritage – 5-10 road traffic noise local air pollution pollution of water or soil sociology etc.
  • 6.
    Main design attitudeand work method Adaptation to the landscape rather than contrast Site / landscape analysis Multidisciplinary teams are a mandatory for all projects A management plan for environment is mandatory for the construction and operation phase Public participation in the planning process
  • 7.
    Environmental Challenges forthe Roads Sector in Norway Emissions of greenhouse gases Land use and irrevocable changes to the natural environment and cultural heritage Road traffic noise Local air pollution Pollution of water or soil
  • 8.
    Emissions of greenhousegases Norway has committed to the Kyoto Protocol - stabilizing emissions at 1% above the 1990 emission level – also a goal to reduce emissions by 30% within 2020 compared to 1990 - willing to have a goal of 40% - in order to reach an international agreement where other countries make the same commitment Emissions are expected to increase without new measures. The transport sector is increasing it’s emissions more than other sectors. Road transport contributes to about 18 % of national emissions, about 10 mill. tons per year - goal is to contribute to a red. of 2,5-4 mill. tons compared to trend
  • 9.
    Measures to reduceCO 2 -emissions Purchase tax to encourage reduced emissions per vehicle – the average of new cars sold 142 g/km at present, the target is 120 g/km by 2012 Measures to reduce motorised transport demand, such as land use, public transport, cycle and walking facilities, restrictions on car use in the bigger cities are recommended, but in the hands of local and regional governments ( potential of 0,6 mill.tons reduction) More bio fuels Fuel taxes Climate cure – new report on mitigation - english version available: http://www.klimakur.no/Templates/Public/Pages/Article.aspx?id=693&epslanguage=en
  • 10.
    Expected effects ofclimate change in Norway Temperature will increase by 1,5-6 degrees Celsius in the coming century More rain, more intense rain, more storm and stronger storms, especially along the coast and in the northern parts of Norway Shorter winters with the temperatures that vary more frequently around zero Sea levels will increase
  • 11.
    Natural environment Reducingnegative impacts from roads and road traffic by: Better integration of new roads in the landscape Reducing the barrier effect for wildlife and people Using native species in road side vegetation – successful. Produce a plan for/against invasive non native species Improve problem stretches/points on existing roads
  • 12.
  • 13.
    Cultural heritage Reducingnegative impacts by: Better integration of new roads in the landscape –cityscape included Follow up the national plan for protection of roads, highways, bridges and associated cultural relics – national bridges and roads are protected - a number of them are still in use
  • 14.
    Road Traffic NoiseAbout 25 % of the population are exposed to noise above 55 dB Implementing EU directives Source oriented measures (pavement, tyres) Indoor noise limit  legal requirements for noise insulation of houses with more than 42 dB Influence land use planning
  • 15.
    Local air pollution70.000 are exposed to pollution above the national limits – mostly in the larger cities Emission of small particles from vehicles is a major source to local air pollution in urban areas Restrictions on the use of studded tyres in the largest cities have been effective Reduced speed limits (80-60 km/h)on two main arterial roads into Oslo in winter
  • 16.
    Pollution of wateror soil Cleaning surface water of particles, particle bound heavy metals and PAH Extensive use of de-icing salt causes problems in lakes, kills roadside trees, pollutes ground water and private wells; - a strategy for reduced salt use is being developed Measures at vulnerable water recipients
  • 17.
    National Transport Plan2010-2019 The Governmental Environmental Objectives in Urban Areas Accommodate urban regions with improved environmentally friendly transport Decrease the use of privately owned motor vehicles Increase the use of public transport, cycling and walking
  • 18.
    Development in dailytravel on a national level Source: TØI The National Travel Survey 2005 Percentages Means of transport 1998 2001 2005 On foot 19 22 20 Bicycle 6 4 5 Public transport 9 9 8 Car driver 53 52 54 Car passenger 11 12 12 MC/Other 1 1 1 Sum 100  100 100
  • 19.
    In land persontraffic 1980 - 2006 Air Sea Road Rail Bill person km Source: TØI, Urbanet, Norconsult
  • 20.
    Development person transportSource: TØI In percentages Change passenger transport 2006=100 Air Boat Rail Bus Car
  • 21.
    NTP 2010 –19 – to improve urban transport: It is not enough to just to improve conditions for public transport, walking and cycling Competition between modes in cities must change in favour of public transport, cycling and walking Restrictions on the use of private cars in towns and cities are recommended - parking, congestion charges, more 30 km/h, pedestrian zones etc Land use must support public transport , walking and cycling
  • 22.
    Toll rings andtraffic effects Toll rings with a low and ”flat” charge, typically 2 £, have little effect on traffic amounts The city of Trondheim had a higher charge 06 – 1800h for 14 years. Removed in 2006 Traffic increased by 12 % between 0600 – 1800 h, resulting in slower buses and more congestion, the overall increase was 5% (not much more than trend) New toll packages for cities may include tolls with “congestions charge” –effect Legal framework for congestion charges is being prepared
  • 23.
    The Stockholm exampleFirst: Cycle path network improved in the centre, cycle traffic increased by 50% Public transport was improved – more buses, but not more passengers
  • 24.
    The Stockholm exampleSecond: Congestion charges introduced ÷ 22% car traffic + 5-6 % public transport More cycle traffic Commerce in the centre is unaffected The congestion charges is assessed to be cost effective and to make Stockholm more attractive Congestion charges is permanent from 2007
  • 25.
    Parking policy isrecommended  Source: National Travel Survey TØI 2001/2005 11 % 29 % 41 % 20 % No 4 % 8 % 75 % 12 % Yes Free and sufficient parking 6,0 % 13,5 % 66,3 % 14,2 % Average of all answers Car passenger/ MC/Other Public transport Car driver Walk /cycle Travel mode
  • 26.
    National Transport Plan2010 -2019 National Cycling Strategy Main objectives: The goal to increase the share of cycling from 5 to 8 % of all trips - means that the amount of cycling has to double within 2019 in the larger cities 80% of children up to 15 shall walk or cycle to/from school (today 60%).
  • 27.
    Norwegian Public Roadsadministration was given a new role in 2006: “ to be the initiator of increased cycle use, and spread knowledge about cycle traffic to municipalities, regions, the public transport industry, employers, the travel industry and others".
  • 28.
    Cycling cities inregion south works well Ambition: Increase cycling by 50% within 2015 Measures: Marketing, new facilities, improvements to existing facilities. Joint financing state, region, municipality Km on bike pr. innhabitant pr day 46% 9% 106% 36% 14% Source: Sintef
  • 29.
    Explanations for highshares of cycling in cities 1.Difference in travel time between car and bicycle 2. Parking charges for cars 3. Share of public transport 4. Area use and density 5. Population 6. Climate 7. Topography Source: Fitzberaad Continous and integral . The cycling policies of Groningen and other cycling cities – se www.sykkelby.no
  • 30.
    Viktige anbefalinger forNTP 2010-2019 Continuous main cycle network in cities is prioritised The aim is: Cyclists can follow the shortest routes and reach closer to the destination than cars –to plan for 20-30 km/h cycling Cycle traffic is given priority over, or is on an equal footing with, cars on public roads and streets Accessibility and parking for bicycles is given priority at shopping centres and public transit nodes
  • 31.
    Safe routes school,is prioritised. The objective is that parents shall feel that it is safe to let the children cycle to school Inspection and improvements of existing cycle facilities
  • 32.
    Competence building andcommunication Network of cycling cities www.sykkelby.no Campaigns for safer and more cycling The picture represents Swedish – Shared space – function when amounts of walking and cyclist are high enough to ”outrank” cars. Not a good solution for disabled people
  • 33.
    50% of alltrips less than 1km are carried out by car. There is a potential for more walking and on short trips NPRA is developing a national walking strategy
  • 34.
    Increased public transportLocal public transport is a joint responsibility of the national, regional and local authorities Co-operation between stakeholders is prioritised Governmental funding is increased NPRA is given an increased responsibility for competence building Transport nodes The 13 largest urban regions are prioritized and can apply for extra funding if they apply measures that results in less car use and more public transport
  • 35.
    Universal design Thegoal in the National Transport Plan 2010-2019 is to improve accessibility for all Legal framework is improved making universal design a requirement
  • 36.
    Universal design Economicincentives to the municipal level have existed for 5 years, the total amount being 50 mill Nkr (about 5 mill. pounds). The local or regional level has to contribute with at least 25% of the costs Increased public investments in universal design. Access to public transport is prioritised Competence building – new road design manual etc
  • 37.
    Universal design isa prerequisite in all new projects Indicators of direction, contrasting colours, acoustic contrast, indicator of dangerous area, requirements to gradient, width of pavement etc
  • 38.
    New road andstreet design manual : In cities nets should be defined first – then design on stretches/streets For pedestrians For bicycle traffic Main net Local net Public transport- private cars- og freight transport Thorough fares Transport net between town boroughs Transport net to / from terminals Local net Nets will partly overlaps – and design requirements and advice is related to nets
  • 39.
    Three main solutionsfor bicycle traffic Shared carriageway bicycle and cars – mixed use –if low speed and low traffic volumes Cycle lane in the carriageway – if higher speed and/or traffic volumes Separate cycle lane – if school routes – if high speed( more than 50 km/h and/or traffic volumes) Recommended facilities vary between the main net and the rest. In addition public transport lanes can be part of the cycle network if width and speed allows In line with Dutch and other international “best practice”, ie the London Bicycle Facility Guideline
  • 40.
    Example Norheimsund –mixed use – street enhancement project on a national road through a small town – done where traffic is too low to require a bypass - AADT 4000 or less – taming the motorized traffic for the benefit of the local community – 30 km/h an ambition – narrow carriageway 6,5m – trees, humps etc
  • 41.
    2. Cycle lanein the carriage way
  • 42.
  • 43.
    3. Separate pedestrianand cycle lane – usually asphalted – 3m
  • 44.
    Pavements Required ontwo sides in streets – Pavement is zoned – min. width 2,5m –universal design requirement
  • 45.
  • 46.
    Eks.: Streets with2 lanes for motorised vehicles and 2 cycle lanes 3 3 3 3 3 3 3,25 m if a lot of heavy traffic Recommended when: Cross section of carriageway
  • 47.
    Bicycle streets Streetprohibited for motorized traffic, a solution to prioritize cycle traffic in pedestrian areas - 5,5m –if delivery of goods with lorries
  • 48.
    Ex. Carriage waywith public transport lane and cycle lane At speed limit 30 and 40 km/h and delays in public transport In one or both directions, should have a width that enables cycling.
  • 49.
    Signal regulated junctionsWithdrawn stop line or bicycle box Should be used – increases traffic safety
  • 50.
    Design of Roadsand Streets Our ambition is to design all new roads without adversely affecting important landscape features, and if possible, add beauty to our surroundings. The Beautiful Roads Prize was established in 1988 to encourage the quality of road and street design. Drammen 2004
  • 51.
    BRP 2004- Newmain road network i Drammen
  • 52.
    Flekkefjord – typicalcity street in small city – shared space bicycles cars Some examples…………..
  • 53.
  • 54.
    BRP 1997 –Mannheller - ferry quai
  • 55.
    BRP 1997 -Hafrsfjord
  • 56.
    Lærdal tunnel 24,5km -Awarded prize for lightning design – longest road tunnel in the world
  • 57.
    BRP 2002 -Drøbak
  • 58.
    E18 Leonardo Bridge,bicycle- andd walkway in Ås
  • 59.
    BRP 2008 Vollen– road enhancement
  • 60.
    National tourist routes 18 routes in unique landscape – finished 2016 1,8 bill.Nkr 2016 (180 mill pounds) Internationally recognised for innovative design www.turistveg.no
  • 61.
    The goals Strengthenthe competitiveness of Norwegian tourism internationally Increase the number of tourists visiting Norway Strengthen business, employment opportunities and settlement in the outlying districts (Included in the National Transport Plan 2010-2019 and the National tourism strategy
  • 62.
    Requirements Quality throughout Board, architectural council, selected innovative professionals in a pool, criteria for choosing sections of road, information system, branding National management Ensures consistent quality, priority and a good overview Commitment of other participants ” Joint financing” and business development
  • 63.
    18 National touristroutes National tourist routes in the north Varanger Havøysund Senja Andøya Lofoten Helgelandskysten nord Helgelandskysten sør National tourist routes in the south Atlanterhavsvegen Geiranger-Trollstigen Gamle Strynefjellsveg Sognefjellet Aurlandsfjellet Gaurlarfjellet Hardanger Ryfylke Jæren Valdresflye Rondane
  • 64.
    Norwegian landscape (mountains,waterfalls, fjords, the coast) The driving experience Architecture (arranged experiences) Art Cultural history The concept
  • 65.
  • 66.
    Geiranger -World heritage
  • 67.
  • 68.
  • 69.
  • 70.
  • 71.
  • 72.
  • 73.
  • 74.
  • 75.
  • 76.
    New Norwegian ArchitecturalPolicy from the Government in the autumn of 2009 Landscape architecture included The policy will be further developed Emphasis on climate, sustainability, city transformation and growth of cities Knowledge and innovation National Conference in 2010 – landscape architecture is the main theme www.oslotriennale.no

Editor's Notes

  • #4 The sectoral environmental responsibility is a general principle in the Norwegian Government’s environmental policy, and all governmental sectors are instructed to follow up on the 4 bullet points on the slide. The sectors are also instructed to provide information on the costs of planned or implemented actions to eliminate or mitigate negative environmental effects within each sector. The operational parts of the sectoral environmental responsibility are delegated to the different transport departments (roads, rails, airports and coast).
  • #5 The Environmental Vision is decided upon by the Directors of all the 4 transport agencies: Norwegian Public Roads Administration (Vegvesenet) Norwegian National Rail Administration (Jernbaneverket) Avinor AS (a wholly state-owned limited company, responsible for planning, operation and maintenance of civil aviation infrastructure) The Norwegian Coastal Administration (Kystverket) The Environmental Vision is a parallel to the traffic safety 0-vision (Vision Zero); “Nobody shall be killed or severely injured in road accidents”.
  • #6 The Sectoral Environmental Responsibility has, among other things, lead to recruitment and development of a broad spectre of environmental competence inside the NPRA, counting approx 150 employees on national, regional and local level. The NPRA has a close co-operation with the major education centres, as universities and polytechnic colleges. Research and development projects are actively carried out by the NPRA, or in co-operation with scientific agencies and companies. The NPRA has an extensive international activity, both on purely scientific basis and in connection with aid projects. Environmental issues are often included.
  • #8 2006: The NPRA is responsible for approx. 28.000 km state roads and approx. 28.000 km county roads About 1.3 million people (out of 4.6 mill.) are exposed to road traffic noise levels exceeding 55 dBA outside their homes. 200 000 people are influenced by local air pollution (dust) above the limit. 150.000 tonnes of de-icing salt is used our roads each year, and it is increasing
  • #9 The transport sector is responsible for 26% of the total Norwegian emissions of CO2. Road traffic is responsible for 18%. Industry approx. 30% Oil production 30%
  • #12 The ecological effects of roads and road transport include habitat loss and degradation, pollution, and animal-vehicle collisions. In addition, roads impose movement barriers to many animals, barriers that together with our deep valleys, long fjords and high mountain ranges can isolate populations and lead to long-term population declines, and in the worst case, local extinction of species. The barrier effect is limited by a restrictive use of wildlife fences, building of over- and underpasses for animals, and adaptation or modification of pipes and culverts for handling water. Problem zones or -sites along the existing road network are now being registered, in order to mitigate or completely eliminate the negative impact on the ecology.
  • #13 The presence of the moose gives us some special challenges when it comes to traffic safety and wildlife.
  • #14 The NPRA has in cooperation with The Directorate of Cultural Heritage (Riksantikvaren) produced a protection plan for all roads and road related items of cultural importance from a national point of view. The items on the protection list includes about 350 ancient roads, highways, bridges and other relics associated with roads, and 26 buildings and 104 items of machinery. The items on the list are distributed throughout the whole country. The period in question covers the years from about 1537 until today. The principal purpose of the plan is to procure and provide information, and to safeguard – also for future generations – information about ancient highways and the environment regarding these. At the same time, the work will also add to the NPRA’s competence with regard to ancient monuments. The intention is to protect all governmentally owned items by law.
  • #15 The EU directive 2002/49/EC Assessment and management of environmental noise is implemented in our legal framework as a part of a regulation to the Pollution Control Act. About 1.3 million people (out of 4.6 mill) are exposed to road traffic noise levels exceeding 55 dBA outside their homes. Road traffic accounts for about 78 per cent of the total noise annoyance in Norway. In Norway, indoor noise levels shall not exceed a 24 hours average level of 42 dBA.
  • #16 Air quality measurements in the largest cities have shown that Norway have a challenge in fulfilling the EU-directives on local air quality. The main reason being the use of metal studded winter tyres. The most effective measure is to reduce the use by charging a fee on the use of studded tyres (NOK 30,- pr. day, NOK 400,- pr. month) in the three largest cities (Oslo, Bergen and Trondheim). The goal is to reduce the number of cars with studded tyres to less than 20%. In Oslo two main arterial roads have reduced speed limits (60 km/h) during winter. The reduction in small particles has been measured to 30-40%. Air quality is monitored in the larger cities, a website. Planning of new roads must be assessed with respect to air quality
  • #17 EU directive is being implemented, pollution is assessed and plans for mitigating measures will be developed Sedimentary ponds are built along the largest roads, and in or outside tunnels, to reduce the pollution from run-off water. Use of studded tyres increase the amount of particles in the run-off water. Particle bound heavy metals and PAH are deposited to a certain degree, but up to now no ponds can handle dissolved heavy metal effectively. Some new ponds will be prepared for use of additional filter to clean dissolved pollutants more effective. The use of de-icing salt has been heavily increased the last years in Norway. (140.000 tonnes of salt/year). Salt will not deposit in sedimentary ponds. On some road stretches the use of de-icing salt has been stopped to protect sources for drinking water.
  • #29 Alle sykkelbyene har nå en plan for sykkelvegnett - 2 hadde det ved oppstart..  Alle har inspisert, men er usikker på omfanget av utbedringer..  Alle har gjort noe mht til markedsføring - avisartikler, lokale arrangement, nettsider, "sykkelglede (magasin) til alle husstander i byen - sendt ut fra regionen..  Nytt tilrettelagt - vet ikke ennå, men en del i Kongsberg og Sandefjord..  30/40 - vet ikke..  FOU - tja - vi skal jo evaluere selv - med en form for sykkelregnskap...
  • #30 Erfaringer har vist at tilrettelegging for økt sykling ikke er tilstrekkelig, dersom det samtidig legges like godt eller enda bedre til rette for øvrige transportmidler. Den enkelte velger til enhver tid det transportmiddel som er best egnet for den aktuelle reise. Valget bestemmes også av økonomi og tilgang til bil, kollektivtransport eller sykkel. Når det samtidig er et mål å øke andelen kollektivreiser og gange, betyr det at det er konkurranseforholdet til bilkjøring som må endres i sykkelens favør. Virkemidler som redusert vegkapasitet, en restriktiv parkeringspolitikk i byene, vegprising, rushtidsprising og parkeringsavgifter må også tas i bruk. Erfaringer fra andre land i Europa bekrefter det kreves en helhetlig innsats for å oppnå økt sykling. En rapport fra Nederland har sammenliknet sykling i byer i Nederland, Tyskland, Belgia og Danmark. Her er det beskrevet hvilke faktorer som har hatt størst betydning for høy andel sykling. Den viktigste forutsetningen er forskjell i reisetid mellom bil og sykkel, nivå på parkeringsavgifter for bil, kollektivandel, utbyggingsmønster (tetthet), topografi, klima og befolkningssammensetning (alder, religion, sivilstatus og arbeidsforhold). ( Kilde: Continuous and integral: The cycling policies of Groningen and other European cycling cities. 2006 ).
  • #42 Med sykkkelfelt blir kjørebanen 8-9m og det kan være vanskelig få bilene til å holde farte som er lavere enn 40-50 km uten fysiske tiltak som fartshumper. Denne løsningen anbefales derfor der trafikken er moderat til farten opp til 60 km /t. For de trygghetssøkende syklistene, barn og eldre bør det i tillegg være fortau eller bakgater som kan brukes. På grunn av trafikksikkerheten er sykkelfelt den beste løsningen i by der det er tett med vegkryss, og langs innfartsårer
  • #50 Sammeløsninger brukes i Danmark med gode erfaringer
  • #51 Aesthetic values, residential environments, biological diversity and cultural monuments are all aspects that need to be incorporated into road planning. Roads are aligned and designed in accordance with two main principles; either as a positive contrast to the environment, or adapted to and anchored in it.  For most roads the principle of adaptation will be the natural choice.  The Norwegian landscape constitutes a significant challenge to road planners and engineers, and demands a multi-disciplinary approach in planning, construction, and maintenance of roads. The Road Director’s “Beautiful Roads Award” was established in 1989 in order to encourage high quality road architecture. The prize is now awarded every 2nd year. Norway have signed The European Landscape Convention, giving us a special responsibility to take landscape values into consideration in strategic planning, feasibility studies, detailed planning, and management of the roads.