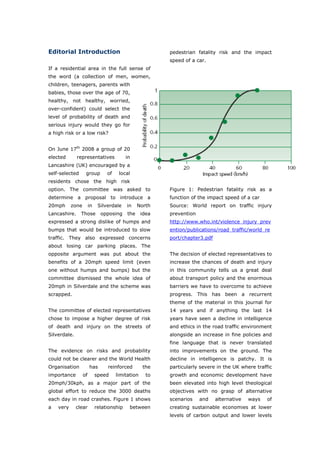
This document is the editorial introduction to an issue of the journal World Transport Policy & Practice. It discusses a recent decision by a local council committee in Lancashire, UK to reject a proposed 20mph speed limit zone in Silverdale due to opposition from residents. The editorial argues this decision will increase the risk of death and injury in the community despite clear evidence that lower speeds reduce crash risks. It calls for a shift towards more sustainable transport mindsets that prioritize safety over mobility. The mindset problem requires working from the bottom-up to empower communities and envision alternative futures, as was done to achieve major policy changes in the past like abolishing slavery.
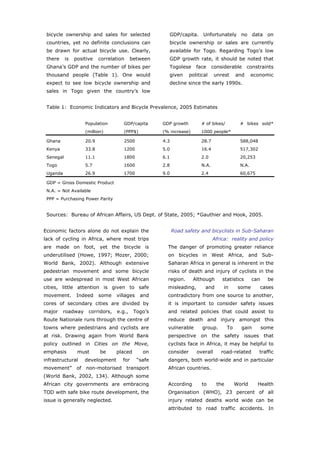
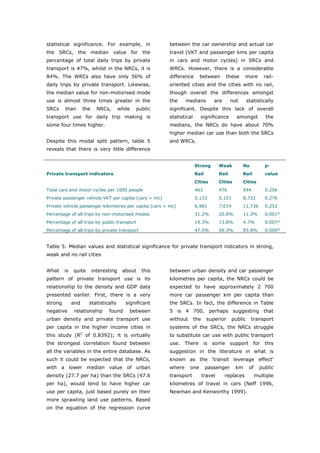
![non-government donor agencies and 9.5 bikes/1000 people in 2001 following a
individuals have generously donated used reduction in bicycle import tariffs. As a
bicycles from the U.S. and Europe to result, the CBC has identified a bicycle
Africa. Although well meaning, donations marketing strategy targeting those
are problematic in that used bikes are countries with low import duties such as
often of low quality, and are therefore Ghana and Kenya (op. cit.).
prone to mechanical failure. When these
foreign bicycles are introduced without While devising a strategy for the
proper marketing, there are few services Coalition, ITDP also considered annual
developed for repairs and parts made growth rates in gross domestic product
available to African cyclists. Gauthier and (GDP), as well as the level of existing bike
Hook bluntly state the problem: “it was ‘a use and sales in selected African
race to the bottom’ in terms of the quality countries. The CBC strategy to target
[of bicycles], and this undermined cycling countries with low tariffs seems logical;
as a legitimate form of transport” (2005, however, the reliance on GDP growth
9). rates as an indicator of success for the
development of the California Bike market
Having experienced the drawbacks to may be constraining. Kenya provides a
relying on used bikes, ITDP staff then strong example with an annual growth in
decided to take a new approach to the GDP from 2000-2004 of less than 1
bicycle commuting problem. ITDP percent, yet as previously noted, bicycle
technical team members worked with sales almost doubled from 2001 to 2002.
bicycle manufacturers, Trek and Sram to Indeed, the use of per capita GDP
develop the California Bike. The California estimates and fluctuating growth rates as
Bike, a six-speed, low end mountain bike indicators of actual prosperity is flawed.
is being produced by Giant Inc. (ironically, GDP figures mask differences in wealth
in Shanghai) and made available to within countries, and do not account for
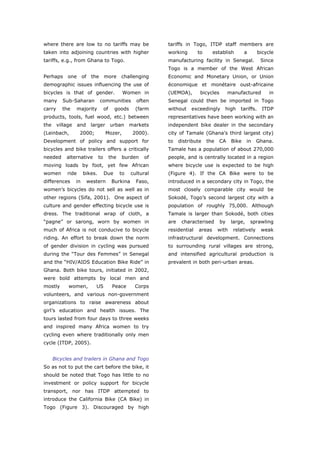
consumers in Senegal, Ghana, Tanzania the informal sector. Even the casual
and South Africa at an average price of observer in Sub-Saharan Africa can attest
$100 (Gauthier and Hook, 2005). Once to the significance of the informal sector
ITDP identified bike dealers and formed of these economies where much
the California Bike Coalition (CBC), the commerce goes undocumented and
bikes were sold at a rate many would not untaxed.
have anticipated.
Though the correlation between GDP
In spite of low average per capita incomes growth rate and per capita GDP is weak,
in most African countries, consumers in bicycle ownership appears to be closely
Ghana, Kenya and Tanzania are buying correlated with per capita income (Hook,
bikes at unprecedented rates. Indeed, 1995; Gauthier and Hook, 2005).
bicycle sales in Ghana in 2002 were However, bicycle sales and ownership do
estimated at almost 29 per thousand not necessarily equate with bicycle use.
people, higher than bicycle consumption Hook (1995) showed that the relationship
in China (Gauthier and Hook, 2005). between per capita income and bicycle
Kenya had the second highest bike sales commuting, or the total number of work
per 1000 people in Africa in 2002 (16.4 trips by bike, is not statistically
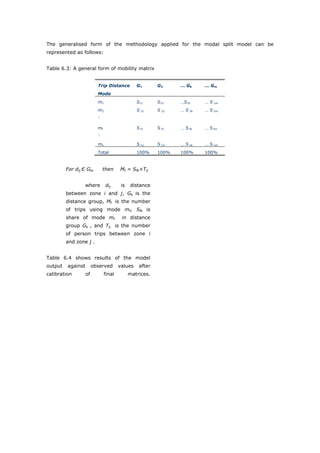
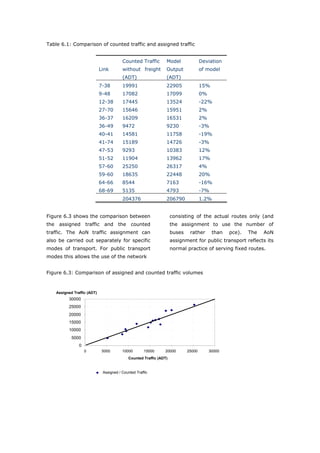
bikes/1000 population). It is important to significant. Table 1 shows relationships
note that sales in Kenya increased from between GDP and the prevalence of
World Transport Policy & Practice___________________________________________________ 11
Volume 14. Number 2. July 2008](https://image.slidesharecdn.com/worldtransportpolicy-111219100827-phpapp01/85/World-transport-policy-11-320.jpg)
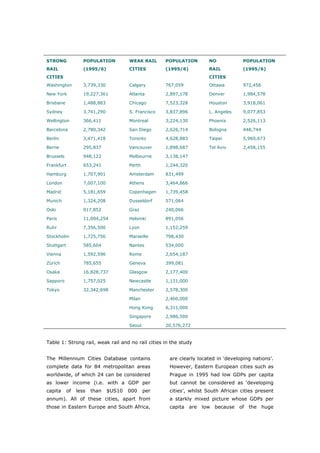
![Kenworthy, J., Laube, F., Newman, P. and Newman, P. and Kenworthy, J., 1989,
Barter, P.,1997, Indicators of transport Cities and automobile dependence: An
efficiency in 37 cities. Report to World international sourcebook (Aldershot, U.K.:
Bank, Institute for Science and Gower).
Technology Policy, Murdoch University,
Western Australia. Newman, P. and Kenworthy, J., 1991,
Towards a more sustainable Canberra: An
Kenworthy, J. and Laube, F. [with assessment of Canberra's transport,
Newman, P., Barter, P., Raad, T., Poboon, energy and land use. Institute for Science
C. and Guia, B. (Jr)], 1999 An and Technology Policy, Murdoch
international sourcebook of automobile University, Perth.
dependence in cities 1960-1990 (Boulder,
U.S.A.: University Press of Colorado). Newman, P. and Kenworthy, J., 1999a,
Sustainability and cities: Overcoming
Laube, F. B., 1998, Optimising urban automobile dependence (Washington DC,
passenger transport: Developing a least- U.S.A.: Island Press).
cost model based on international
comparison of urban transport cost, Newman, P. and Kenworthy, J., 1999b,
transport patterns, land use, ‘Relative speed’ not ‘time savings’: A new
infrastructure, environmental and best indicator for sustainable transport. Papers
practice in public transport. PhD thesis, of the 23rd Australasian Transport
Murdoch University, Perth, Western Research Forum, Perth, Western
Australia. Australia, 29 September – 1 October,
Volume 23, Part 1. pp. 425-440.
Laube, F.B., Kenworthy, J.R. and Zeibots,
M.E., 1999, Towards a city science: City Pickrell, D. H., 1990, Urban rail transit
observation and formulation of a city projects: Forecasts versus actual ridership
theory. In: Siedlungsstrukturen, räumliche costs (Cambridge, U.S.A.: US Department
Mobilität and Verkehr: Auf dem Weg zur of Transportation).
nachhaltigkeit in Stadtregionen, edited by
M. Hesse (Berlin, Germany: Institut für Pucher, J., 2002, Renaissance of public
Regionalentwicklung und transport in the United States?
Strukturplanung), pp. 99-118. Transportation Quarterly 56 (1), 33-49.
Lave, C., 1992, Cars and demographics. Pucher, J. and Dijkstra, L., 2003,
Access, 1, 4-11. Promoting safe walking and cycling to
improve public health: Lessons from The
Litman, T.A., 2004, Rail transit in Netherlands and Germany. American
America: Comprehensive evaluation of Journal of Public Health, 93, (9), 1509-
benefits. http://www.vtpi.org/railben.pdf 1516.
Neff, J.W., 1996, Substitution rates Thomson, J.M., 1978, Great cities and
between transit and automobile travel. their traffic (Harmondsworth, U.K.:
Paper presented at the Association of Penguin).
American Geographers’ Annual Meeting,
Charlotte, North Carolina, April.
World Transport Policy & Practice___________________________________________________ 36
Volume 14. Number 2. July 2008](https://image.slidesharecdn.com/worldtransportpolicy-111219100827-phpapp01/85/World-transport-policy-36-320.jpg)
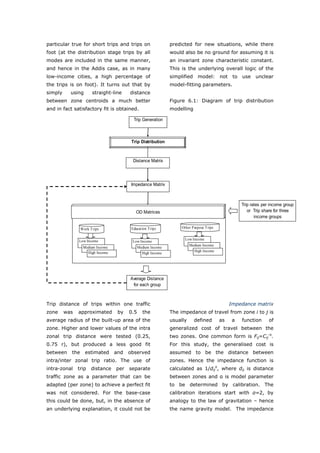
![considerations, etc. However, for Fischer, M. M. (1987). Travel Demand
strategic long-term planning the Modelling: A State-of-the Art Review.
sacrifice is considered to be small, in Transportation Planning in a Changing
view of the likelihood that the World. P. Nijkamp and S. Reichman.
elasticity’s (parameters) concerned England, Gower Publishing Company.
will change over time in a non-
predictable manner, and the fact that Foster, I. (1995). Designing and Building
reliable forecasts of some of the Parallel Programs : Case Study of
determining factors (the attitudinal Shortest-Path Algorithms [Online].
ones in particular) cannot be made. http://www-
unix.mcs.anl.gov/dbpp/text/node35.html
This argument doesn’t imply that the [Accessed Oct 3 2007].
analysis of modal choice determinants
is unimportant. On the contrary: it McNally, M. G. (2000). The Four-Step
provides very useful indications of the Model. Handbook of Transport Modelling.
effectiveness that different policies to D. A. Hensher and K. J. Button. New York,
influence modal choice are likely to Elsevier Science Ltd.
have. Yet, such analysis can more
successfully and efficiently be carried Ortúzar, J. d. D. and L. G. Willumsen
out in its own right, without being (1998). Modeling Transport. ,second
incorporated in the travel demand edition, West Sussex, England, John Wiley
model meant for long-term strategic & Sons Ltd.
planning.
Sheffi, Y. (1985). Urban Transportation
References Networks: Equilibrium Analysis with
Banister, D. (1994). Transport Planning. Mathematical Programming Method.
first edition, London, UK, E & FN Spon. U.S.A., Prentice-Hall, Inc.
Bayliss, B. (1992). Transport Policy and Thomson, J. M. (1983). Toward Better
Planning: An Integrated Analytical Urban Transport Planning in Developing
Approach. Washington, D.C., U.S.A., The Countries. Staff Working Paper No. 600.
International Bank for Reconstruction and Washington DC, USA, The World Bank.
Development / THE WORLD BANK.
Wegmann, F. and J. Everett (2005).
Bruton, M. J. (1988). Introduction to Minimum travel demand model calibraton
Transportation Planning. Great Britain, and validation guidelines for State of
Hutchinson & Co. (Publishers) Ltd. Tennessee [Online].
http://ctr.utk.edu/TNMUG/misc/valid.pdf .
Caliper (2001). Travel Demand Modelling [Acessed Mar 20 2007].
with TransCAD. U.S.A., Caliper
Corporation. Author contact information:
Binyam Bedelu
ERA (2005). Urban Transport Study and Addis Ababa City Roads Authority,
Preparation of Pilot Projects for Addis Ethiopia;
Ababa. Addis Ababa, Ethiopian Roads Email: binyambedelu@gmail.com
Authority.
World Transport Policy & Practice___________________________________________________ 73
Volume 14. Number 2. July 2008](https://image.slidesharecdn.com/worldtransportpolicy-111219100827-phpapp01/85/World-transport-policy-73-320.jpg)