This document discusses various techniques for analyzing financial statements, including ratio analysis, trend analysis, common size statements, comparative statements, and funds flow analysis. Ratio analysis involves calculating relationships between financial metrics to evaluate aspects like profitability, liquidity, and leverage. Trend analysis examines changes in financial figures over multiple periods. Common size statements express figures as percentages of totals for comparison. Comparative statements place figures from different periods side by side. Funds flow analysis shows sources and uses of funds. The document provides examples of applying these techniques and discusses their significance for understanding a company's financial condition and performance.


![Audit and legal implications
Although laws differ from country to country, an audit of the financial statements
of a public company is usually required for investment, financing, and tax purposes.
These are usually performed by independent accountants or auditing firms. Results of the
audit are summarized in an audit report that either provide an unqualified opinion on the
financial statements or qualifications as to its fairness and accuracy. The audit opinion on
the financial statements is usually included in the annual report.
There has been much legal debate over who an auditor is liable to. Since audit
reports tend to be addressed to the current shareholders, it is commonly thought that they
owe a legal duty of care to them. But this may not be the case as determined by common
law precedent. In Canada, auditors are liable only to investors using a prospectus to buy
shares in the primary market. In the United Kingdom, they have been held liable to
potential investors when the auditor was aware of the potential investor and how they
would use the information in the financial statements. Nowadays auditors tend to include
in their report liability restricting language, discouraging anyone other than the addressees
of their report from relying on it. Liability is an important issue: in the UK, for example,
auditors have unlimited liability.
In the United States, especially in the post-Enron era there has been substantial
concern about the accuracy of financial statements. Corporate officers (the chief
executive officer (CEO) and chief financial officer (CFO)) are personally liable for
attesting that financial statements "do not contain any untrue statement of a material fact
or omit to state a material fact necessary to make the statements made, in light of the
circumstances under which such statements were made, not misleading with respect to the
period covered by th[e] report." Making or certifying misleading financial statements
exposes the people involved to substantial civil and criminal liability. For example Bernie
Ebbers (former CEO of WorldCom) was sentenced to 25 years in federal prison for
allowing WorldCom's revenues to be overstated by billion over five years.
Standards and regulations
Different countries have developed their own accounting principles over time,
making international comparisons of companies difficult. To ensure uniformity and
18](https://image.slidesharecdn.com/maheshfinancialstatement-160415035836/85/financial-statement-18-320.jpg)


![No items may be presented in the income statement as extraordinary items under
IFRS regulations, but are permissible under US GAAP. Extraordinary items are both
unusual (abnormal) and infrequent, for example, unexpected natural disaster,
expropriation, prohibitions under new regulations. [Note: natural disaster might not
qualify depending on location (e.g. frost damage would not qualify in Canada but would
in the tropics).]
Additional items may be needed to fairly present the entity's results of operations.
Disclosures
Certain items must be disclosed separately in the notes (or the statement of
comprehensive income), if material, including:
• Write-downs of inventories to net realisable value or of property, plant and
equipment to recoverable amount, as well as reversals of such write-downs
• Restructurings of the activities of an entity and reversals of any provisions for the
costs of restructuring
• Disposals of items of property, plant and equipment
• Disposals of investments
• Discontinued operations
• Litigation settlements
• Other reversals of provisions
Earnings per share
Because of its importance, earnings per share (EPS) are required to be disclosed on the
face of the income statement. A company which reports any of the irregular items must
also report EPS for these items either in the statement or in the notes.
There are two forms of EPS reported:
• Basic: in this case "weighted average of shares outstanding" includes only actual
stocks outstanding.
• Diluted: in this case "weighted average of shares outstanding" is calculated as if
all stock options, warrants, convertible bonds, and other securities that could be
transformed into shares are transformed. This increases the number of shares and
27](https://image.slidesharecdn.com/maheshfinancialstatement-160415035836/85/financial-statement-27-320.jpg)


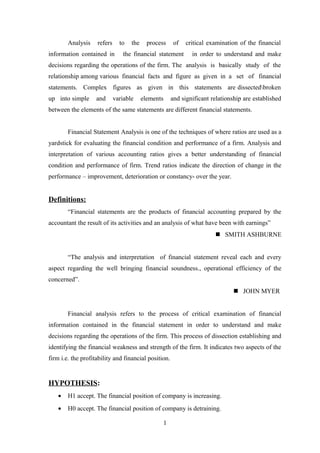
![b. Assets Turnover Ratio:
Assets are used to generate sales. Therefore a firm should manage its assets
efficiency to maximum sales. Assets turnover ratio shows relationship between sales &
assets. The various assets turnover ratio are:]]
i. Fixed Assets Turnover Ratio:
This ratio establishes the relationship between the costs of goods sold and fixed assets. It
can be calculated by ,
Fixed Assets Turnover Ratio = Sales
Fixed Assets
TABLE : 4.2 Fixed Assets Turnover Ratio
F/A TURNOVER RATIO
0.51
1.16
1.04
0.8
1.29
0
0.2
0.4
0.6
0.8
1
1.2
1.4
2004-05 2005-06 2006-07 2007-08 2008-09
YEAR
RATIO
Ratio
62
Year Sales Net Fixed Assets Ratio
2004-05 269842495 523585135 0.51
2005-06 622678642 532690595 1.16
2006-07 592532689 568828676 1.04
2007-08 453435123 570188858 0.80
2008-09 736206987 571266087 1.29](https://image.slidesharecdn.com/maheshfinancialstatement-160415035836/85/financial-statement-62-320.jpg)


![QUESTIONNAIRE
1. Profession [a]
a. Business man
B. private employed
c. Government employed
D. others
2. Marital status [b]
A. married
B. single
3. Income level of the respondents [c]
a. < 10,000Rs
b. 10000-25,000
c. 25,000-50,000
d. above 50,000
4. preferred investment plan [c]
a. Bank FD
b. ULIP
C. Mutual funds
d. Stock market
5. What type of mutual funds you prefer ? [b]
a. Debt funds
b. Equity funds
c. Hybrid funds
73](https://image.slidesharecdn.com/maheshfinancialstatement-160415035836/85/financial-statement-73-320.jpg)
![6. Risk preference in mutual funds [MF] investment plan [c]
a. High risk
b. Moderate risk
c. Low risk
7. What type of scheme you prefer much [a]
a. Open – Ended
b. Closed – Ended
8. What is your period of investment [a]
a. Long term
b. Short term
9. In which sector fund do you prefer much in estate funds [b]
a. Financial funds
b. Utility funds
c. Technology funds
d. Healthcare funds
10. Why do u prefer in investing in mutual funds [b]
a. Tax savings
b. Risk cover
c. Others
74](https://image.slidesharecdn.com/maheshfinancialstatement-160415035836/85/financial-statement-74-320.jpg)


