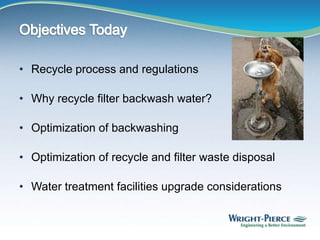
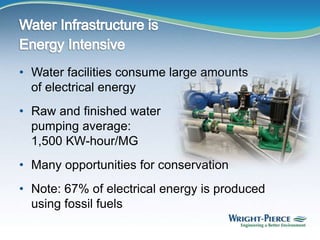
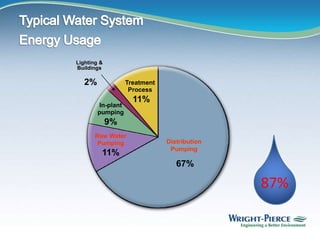
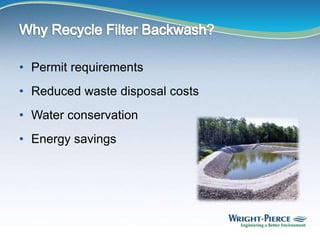
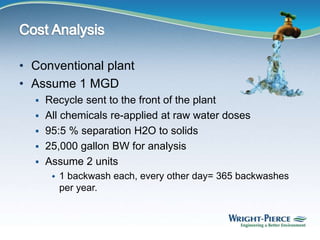
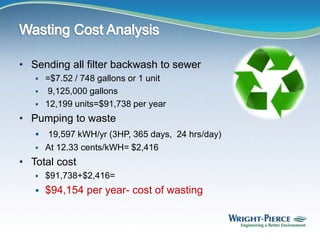
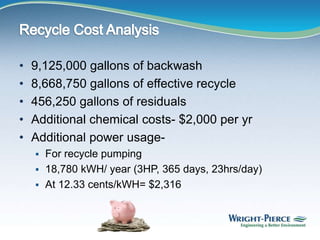
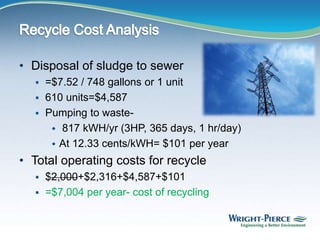
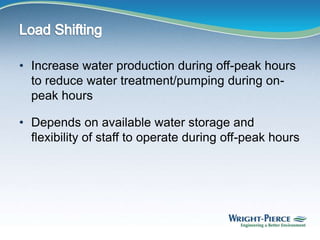
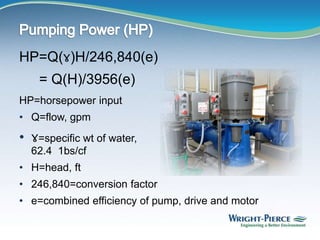
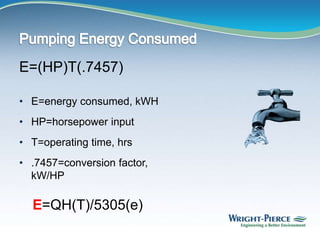
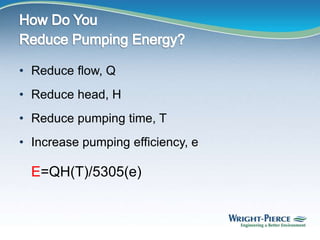
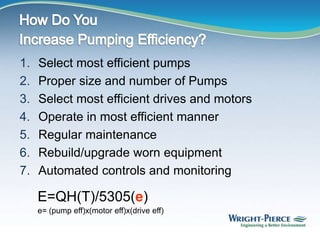
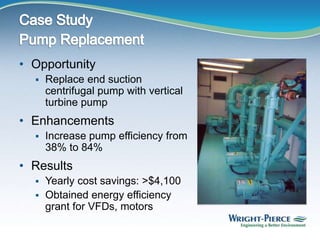
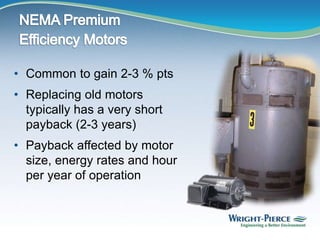
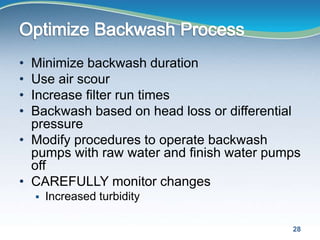
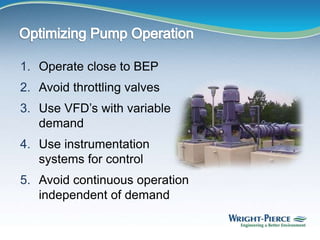
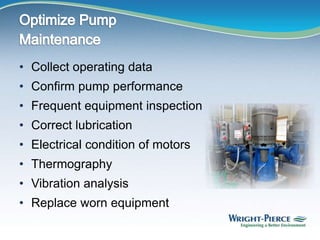
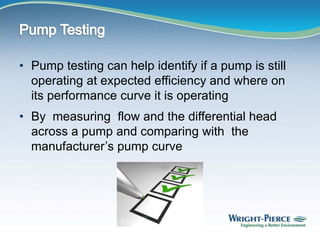
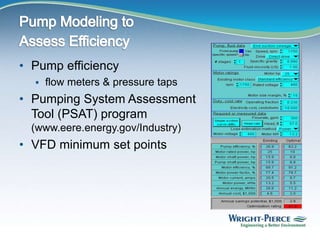
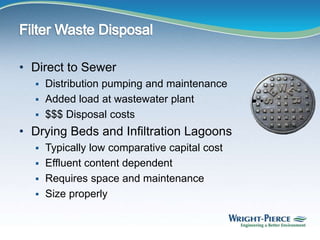
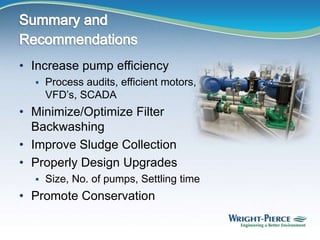
GWSRA 2015
Presented by:
Dylan B. Thisse, PE
Improving Plant Efficiency
Through Recycle Optimization
• Recycle process and regulations
• Why recycle filter backwash water?
• Optimization of backwashing
• Optimization of recycle and filter waste disposal
• Water treatment facilities upgrade considerations
• Water facilities consume large amounts
of electrical energy
• Raw and finished water
pumping average:
1,500 KW-hour/MG
• Many opportunities for conservation
• Note: 67% of electrical energy is produced
using fossil fuels
Distribution
Pumping
67%
Treatment
Process
11%
Raw Water
Pumping
11%
Lighting &
Buildings
2%
In-plant
pumping
9%
87%
• National Primary Drinking Water Regulations
• EPA Filter Backwash Recycle Rule- FBRR
 Cryptosporidium control
• 10 states standards
 Max 10% inflow
• NHDES Requirements
 Env-DW 716- Filtration, Disinfection, and Waste
Recycling
 Direct reference to NPDWR standards
• EPA Filter Backwash Recycle Rule- FBRR
 Cryptosporidium control
• For plants with ALL of the following
 Treating with conventional or direct filtration
 Surface or groundwater under influence of surface water
 Recycling filter backwash
• Requires
 Notifying state of practices
 Recycle to front of plant
 Maintain records- flows, frequency, quantity
• Great Resource
http://water.epa.gov/lawsregs/rulesregs/sdwa/filterbackwash.c
fm
7
• Permit requirements
• Reduced waste disposal costs
• Water conservation
• Energy savings
• Conventional plant
• Assume 1 MGD
 Recycle sent to the front of the plant
 All chemicals re-applied at raw water doses
 95:5 % separation H2O to solids
 25,000 gallon BW for analysis
 Assume 2 units
 1 backwash each, every other day= 365 backwashes
per year.
• Sending all filter backwash to sewer
 =$7.52 / 748 gallons or 1 unit
 9,125,000 gallons
 12,199 units=$91,738 per year
• Pumping to waste
 19,597 kWH/yr (3HP, 365 days, 24 hrs/day)
 At 12.33 cents/kWH= $2,416
• Total cost
 $91,738+$2,416=
 $94,154 per year- cost of wasting
• 9,125,000 gallons of backwash
• 8,668,750 gallons of effective recycle
• 456,250 gallons of residuals
• Additional chemical costs- $2,000 per yr
• Additional power usage-
 For recycle pumping
 18,780 kWH/ year (3HP, 365 days, 23hrs/day)
 At 12.33 cents/kWH= $2,316
• Disposal of sludge to sewer
 =$7.52 / 748 gallons or 1 unit
 610 units=$4,587
 Pumping to waste-
 817 kWH/yr (3HP, 365 days, 1 hr/day)
 At 12.33 cents/kWH= $101 per year
• Total operating costs for recycle
 $2,000+$2,316+$4,587+$101
 =$7,004 per year- cost of recycling
• $94,154 - $7,004= $87,150 per year
• Straight line payback on $1,000,000 capital cost
project= 12 years
• Capital and maintenance costs
• Conservation benefits
• Reduced wastewater burden
• Storage Capacity and Equipment
• Operations and Maintenance
 Pumps and piping
 Instrumentation
 Monitoring and recording
 Operator effort
• Benefit or Burden?
 Case by case
• Opportunity
 water plant had 10% filter waste
• Enhancements
 employed backwash
water recycle system
• Results
 reduced filter waste to 2%
 reduced raw water pumping energy by 8%
 reduced sewer bill by 80%
• Backwashing of filters consumes little energy
• Backwash pumps are significant contributors to
demand charges
• Modify procedures to operate backwash pumps
during off-peak hours- load shifting
• Variable frequency drives
• Optimize chemical addition
• Optimize backwash process
• Increase water production during off-peak hours
to reduce water treatment/pumping during on-
peak hours
• Depends on available water storage and
flexibility of staff to operate during off-peak hours
• Pumps consume the
majority of electrical
energy at water
facilities
• Biggest opportunity
for energy savings
HP=Q(ɤ)H/246,840(e)
= Q(H)/3956(e)
HP=horsepower input
• Q=flow, gpm
• ɤ=specific wt of water,
62.4 1bs/cf
• H=head, ft
• 246,840=conversion factor
• e=combined efficiency of pump, drive and motor
E=(HP)T(.7457)
• E=energy consumed, kWH
• HP=horsepower input
• T=operating time, hrs
• .7457=conversion factor,
kW/HP
E=QH(T)/5305(e)
• Reduce flow, Q
• Reduce head, H
• Reduce pumping time, T
• Increase pumping efficiency, e
E=QH(T)/5305(e)
1. Reduce backwash quantity
2. Recycle backwash water
3. Promote conservation
E=QH(T)/5305(e)
1. Select most efficient pumps
2. Proper size and number of Pumps
3. Select most efficient drives and motors
4. Operate in most efficient manner
5. Regular maintenance
6. Rebuild/upgrade worn equipment
7. Automated controls and monitoring
E=QH(T)/5305(e)
e= (pump eff)x(motor eff)x(drive eff)
• Pump testing can identify
where a pump operates
on its performance curve
• Measure flow and TDH
to determine pump curve
operating point
What is on a pump curve diagram?
• pump I.D. (model #, RPM, etc.)
• pumping rate vs. total
head (per impeller)
• efficiency curves
• horse power curves
• net positive suction head
requirements
• operating range
• Opportunity
 Replace end suction
centrifugal pump with vertical
turbine pump
• Enhancements
 Increase pump efficiency from
38% to 84%
• Results
 Yearly cost savings: >$4,100
 Obtained energy efficiency
grant for VFDs, motors
• Common to gain 2-3 % pts
• Replacing old motors
typically has a very short
payback (2-3 years)
• Payback affected by motor
size, energy rates and hour
per year of operation
• Minimize backwash duration
• Use air scour
• Increase filter run times
• Backwash based on head loss or differential
pressure
• Modify procedures to operate backwash
pumps with raw water and finish water pumps
off
• CAREFULLY monitor changes
 Increased turbidity
28
1. Operate close to BEP
2. Avoid throttling valves
3. Use VFD’s with variable
demand
4. Use instrumentation
systems for control
5. Avoid continuous operation
independent of demand
• Vary frequency and voltage to minimize electric
load for required pump speed
• Combine with flow meters
• Efficient- just enough energy
• May be used to eliminate throttling valves
• Softer pump start up and shut down
• Reduce water hammer
• Grants, rebates, loans, and tax incentives
• Rebates
 Through local utility
• Grants and Loans
 USDA-rural development
• Tax Incentives
 Part of larger energy efficiency program
• Participation in Energy Demand Markets
 Complicated and costly for small projects
• Resources
 NHSAVES program- www.nhsaves.com
 Database of State Incentives for Renewables and
Energy- www.DSIREusa.org
 Department of Energy www.energy.gov
 Energy Markets- www.iso-ne.com
Contact Agencies even if NO programs are
listed.
• Effective tools for managing energy usage
• Monitor pump efficiencies
• Control the system to optimize efficiency
• Load shift or shed
• Control the speed or pressure on
speed variable pumps
• Alarm when electrical demand in kW
exceeds predetermined targets
• Vibration monitoring
• Heat monitoring
• Collect operating data
• Confirm pump performance
• Frequent equipment inspection
• Correct lubrication
• Electrical condition of motors
• Thermography
• Vibration analysis
• Replace worn equipment
• Pump testing can help identify if a pump is still
operating at expected efficiency and where on
its performance curve it is operating
• By measuring flow and the differential head
across a pump and comparing with the
manufacturer’s pump curve
• Pump efficiency
 flow meters & pressure taps
• Pumping System Assessment
Tool (PSAT) program
(www.eere.energy.gov/Industry)
• VFD minimum set points
• Direct to Sewer
 Distribution pumping and maintenance
 Added load at wastewater plant
 $$$ Disposal costs
• Drying Beds and Infiltration Lagoons
 Typically low comparative capital cost
 Effluent content dependent
 Requires space and maintenance
 Size properly
• Storage and Removal
 Waste tank or lagoon
 Trucking sludge
 Limited space
 Higher capital and disposal costs
• Back to the Environment
 Specific permit requirements
 Dependent on contaminants
 Rarely if ever done
• Opportunity
 Minimize sludge quantity
 Increase backwash flexibility
 Partial recharge of aquifer
• Enhancements
 Two 25’x25’ unlined infiltration lagoons
 Obtained environmental approval for discharge
• Results
 Installation anticipated 2016
• Equalization chambers
• Improved instrumentation
• Efficient motors and pumps
• VFD’s
• Timer functions/ creative programming
• Floating decant intakes
• Decreasing settling times
• Enhanced sludge removal systems
• Opportunity
 Increase ability to recycle
 Reduce quantity wasted
• Enhancements
 New pumps, motors, and VFD’s
 Improved storage capacity/equalization chamber
 Improved controls and instrumentation
 Timer functions and creative programming
 Maximize quantity of available clean recycle
• Results
 Increased recycle quantity and decreased wasting quantity
 Still testing programming
 Further optimization available
• Water tank mixing
• Power management
• HVAC equipment
 heat recovery
• Building envelope
• Lighting systems
• Solar
• Do an energy audit to quantify
energy used by equipment
systems and identify
opportunities to conserve
• Audits can be performed
in-house, contracted, or
sometimes by the power
supplier.
• Billing and rates (demand charges)
• Energy use patterns
• Detailed equipment list
• Run times
• Pressure/flow measurements
• kW, PF, amp draw
• Justify energy bills through equipment inventory and data collection
• Document current usage
• Identify low cost operational adjustments
• Payback analysis on equipment replacement
• Instrumentation for monitoring and control
• Energy and fuel supply modifications
• Extension of the walk
through audit
• comprehensive
identification
• analysis of energy
conservation measures
• Increase pump efficiency
 Process audits, efficient motors,
VFD’s, SCADA
• Minimize/Optimize Filter
Backwashing
• Improve Sludge Collection
• Properly Design Upgrades
 Size, No. of pumps, Settling time
• Promote Conservation
For more information contact:
Dylan B. Thisse, P.E.
dylan.thisse@wright-
pierce.com
603.430.3728

GSWRA_EnergyEfficiency_SEPT2015_DBT

  • 1.
    GWSRA 2015 Presented by: DylanB. Thisse, PE Improving Plant Efficiency Through Recycle Optimization
  • 2.
    • Recycle processand regulations • Why recycle filter backwash water? • Optimization of backwashing • Optimization of recycle and filter waste disposal • Water treatment facilities upgrade considerations
  • 3.
    • Water facilitiesconsume large amounts of electrical energy • Raw and finished water pumping average: 1,500 KW-hour/MG • Many opportunities for conservation • Note: 67% of electrical energy is produced using fossil fuels
  • 4.
  • 6.
    • National PrimaryDrinking Water Regulations • EPA Filter Backwash Recycle Rule- FBRR  Cryptosporidium control • 10 states standards  Max 10% inflow • NHDES Requirements  Env-DW 716- Filtration, Disinfection, and Waste Recycling  Direct reference to NPDWR standards
  • 7.
    • EPA FilterBackwash Recycle Rule- FBRR  Cryptosporidium control • For plants with ALL of the following  Treating with conventional or direct filtration  Surface or groundwater under influence of surface water  Recycling filter backwash • Requires  Notifying state of practices  Recycle to front of plant  Maintain records- flows, frequency, quantity • Great Resource http://water.epa.gov/lawsregs/rulesregs/sdwa/filterbackwash.c fm 7
  • 8.
    • Permit requirements •Reduced waste disposal costs • Water conservation • Energy savings
  • 9.
    • Conventional plant •Assume 1 MGD  Recycle sent to the front of the plant  All chemicals re-applied at raw water doses  95:5 % separation H2O to solids  25,000 gallon BW for analysis  Assume 2 units  1 backwash each, every other day= 365 backwashes per year.
  • 10.
    • Sending allfilter backwash to sewer  =$7.52 / 748 gallons or 1 unit  9,125,000 gallons  12,199 units=$91,738 per year • Pumping to waste  19,597 kWH/yr (3HP, 365 days, 24 hrs/day)  At 12.33 cents/kWH= $2,416 • Total cost  $91,738+$2,416=  $94,154 per year- cost of wasting
  • 11.
    • 9,125,000 gallonsof backwash • 8,668,750 gallons of effective recycle • 456,250 gallons of residuals • Additional chemical costs- $2,000 per yr • Additional power usage-  For recycle pumping  18,780 kWH/ year (3HP, 365 days, 23hrs/day)  At 12.33 cents/kWH= $2,316
  • 12.
    • Disposal ofsludge to sewer  =$7.52 / 748 gallons or 1 unit  610 units=$4,587  Pumping to waste-  817 kWH/yr (3HP, 365 days, 1 hr/day)  At 12.33 cents/kWH= $101 per year • Total operating costs for recycle  $2,000+$2,316+$4,587+$101  =$7,004 per year- cost of recycling
  • 13.
    • $94,154 -$7,004= $87,150 per year • Straight line payback on $1,000,000 capital cost project= 12 years • Capital and maintenance costs • Conservation benefits • Reduced wastewater burden
  • 14.
    • Storage Capacityand Equipment • Operations and Maintenance  Pumps and piping  Instrumentation  Monitoring and recording  Operator effort • Benefit or Burden?  Case by case
  • 15.
    • Opportunity  waterplant had 10% filter waste • Enhancements  employed backwash water recycle system • Results  reduced filter waste to 2%  reduced raw water pumping energy by 8%  reduced sewer bill by 80%
  • 16.
    • Backwashing offilters consumes little energy • Backwash pumps are significant contributors to demand charges • Modify procedures to operate backwash pumps during off-peak hours- load shifting • Variable frequency drives • Optimize chemical addition • Optimize backwash process
  • 17.
    • Increase waterproduction during off-peak hours to reduce water treatment/pumping during on- peak hours • Depends on available water storage and flexibility of staff to operate during off-peak hours
  • 18.
    • Pumps consumethe majority of electrical energy at water facilities • Biggest opportunity for energy savings
  • 19.
    HP=Q(ɤ)H/246,840(e) = Q(H)/3956(e) HP=horsepower input •Q=flow, gpm • ɤ=specific wt of water, 62.4 1bs/cf • H=head, ft • 246,840=conversion factor • e=combined efficiency of pump, drive and motor
  • 20.
    E=(HP)T(.7457) • E=energy consumed,kWH • HP=horsepower input • T=operating time, hrs • .7457=conversion factor, kW/HP E=QH(T)/5305(e)
  • 21.
    • Reduce flow,Q • Reduce head, H • Reduce pumping time, T • Increase pumping efficiency, e E=QH(T)/5305(e)
  • 22.
    1. Reduce backwashquantity 2. Recycle backwash water 3. Promote conservation E=QH(T)/5305(e)
  • 23.
    1. Select mostefficient pumps 2. Proper size and number of Pumps 3. Select most efficient drives and motors 4. Operate in most efficient manner 5. Regular maintenance 6. Rebuild/upgrade worn equipment 7. Automated controls and monitoring E=QH(T)/5305(e) e= (pump eff)x(motor eff)x(drive eff)
  • 24.
    • Pump testingcan identify where a pump operates on its performance curve • Measure flow and TDH to determine pump curve operating point
  • 25.
    What is ona pump curve diagram? • pump I.D. (model #, RPM, etc.) • pumping rate vs. total head (per impeller) • efficiency curves • horse power curves • net positive suction head requirements • operating range
  • 26.
    • Opportunity  Replaceend suction centrifugal pump with vertical turbine pump • Enhancements  Increase pump efficiency from 38% to 84% • Results  Yearly cost savings: >$4,100  Obtained energy efficiency grant for VFDs, motors
  • 27.
    • Common togain 2-3 % pts • Replacing old motors typically has a very short payback (2-3 years) • Payback affected by motor size, energy rates and hour per year of operation
  • 28.
    • Minimize backwashduration • Use air scour • Increase filter run times • Backwash based on head loss or differential pressure • Modify procedures to operate backwash pumps with raw water and finish water pumps off • CAREFULLY monitor changes  Increased turbidity 28
  • 29.
    1. Operate closeto BEP 2. Avoid throttling valves 3. Use VFD’s with variable demand 4. Use instrumentation systems for control 5. Avoid continuous operation independent of demand
  • 30.
    • Vary frequencyand voltage to minimize electric load for required pump speed • Combine with flow meters • Efficient- just enough energy • May be used to eliminate throttling valves • Softer pump start up and shut down • Reduce water hammer • Grants, rebates, loans, and tax incentives
  • 31.
    • Rebates  Throughlocal utility • Grants and Loans  USDA-rural development • Tax Incentives  Part of larger energy efficiency program • Participation in Energy Demand Markets  Complicated and costly for small projects
  • 32.
    • Resources  NHSAVESprogram- www.nhsaves.com  Database of State Incentives for Renewables and Energy- www.DSIREusa.org  Department of Energy www.energy.gov  Energy Markets- www.iso-ne.com Contact Agencies even if NO programs are listed.
  • 33.
    • Effective toolsfor managing energy usage • Monitor pump efficiencies • Control the system to optimize efficiency • Load shift or shed • Control the speed or pressure on speed variable pumps • Alarm when electrical demand in kW exceeds predetermined targets • Vibration monitoring • Heat monitoring
  • 34.
    • Collect operatingdata • Confirm pump performance • Frequent equipment inspection • Correct lubrication • Electrical condition of motors • Thermography • Vibration analysis • Replace worn equipment
  • 35.
    • Pump testingcan help identify if a pump is still operating at expected efficiency and where on its performance curve it is operating • By measuring flow and the differential head across a pump and comparing with the manufacturer’s pump curve
  • 36.
    • Pump efficiency flow meters & pressure taps • Pumping System Assessment Tool (PSAT) program (www.eere.energy.gov/Industry) • VFD minimum set points
  • 37.
    • Direct toSewer  Distribution pumping and maintenance  Added load at wastewater plant  $$$ Disposal costs • Drying Beds and Infiltration Lagoons  Typically low comparative capital cost  Effluent content dependent  Requires space and maintenance  Size properly
  • 38.
    • Storage andRemoval  Waste tank or lagoon  Trucking sludge  Limited space  Higher capital and disposal costs • Back to the Environment  Specific permit requirements  Dependent on contaminants  Rarely if ever done
  • 39.
    • Opportunity  Minimizesludge quantity  Increase backwash flexibility  Partial recharge of aquifer • Enhancements  Two 25’x25’ unlined infiltration lagoons  Obtained environmental approval for discharge • Results  Installation anticipated 2016
  • 40.
    • Equalization chambers •Improved instrumentation • Efficient motors and pumps • VFD’s • Timer functions/ creative programming • Floating decant intakes • Decreasing settling times • Enhanced sludge removal systems
  • 41.
    • Opportunity  Increaseability to recycle  Reduce quantity wasted • Enhancements  New pumps, motors, and VFD’s  Improved storage capacity/equalization chamber  Improved controls and instrumentation  Timer functions and creative programming  Maximize quantity of available clean recycle • Results  Increased recycle quantity and decreased wasting quantity  Still testing programming  Further optimization available
  • 42.
    • Water tankmixing • Power management • HVAC equipment  heat recovery • Building envelope • Lighting systems • Solar
  • 43.
    • Do anenergy audit to quantify energy used by equipment systems and identify opportunities to conserve • Audits can be performed in-house, contracted, or sometimes by the power supplier.
  • 44.
    • Billing andrates (demand charges) • Energy use patterns • Detailed equipment list • Run times • Pressure/flow measurements • kW, PF, amp draw • Justify energy bills through equipment inventory and data collection • Document current usage • Identify low cost operational adjustments • Payback analysis on equipment replacement • Instrumentation for monitoring and control • Energy and fuel supply modifications
  • 45.
    • Extension ofthe walk through audit • comprehensive identification • analysis of energy conservation measures
  • 46.
    • Increase pumpefficiency  Process audits, efficient motors, VFD’s, SCADA • Minimize/Optimize Filter Backwashing • Improve Sludge Collection • Properly Design Upgrades  Size, No. of pumps, Settling time • Promote Conservation
  • 47.
    For more informationcontact: Dylan B. Thisse, P.E. dylan.thisse@wright- pierce.com 603.430.3728

Editor's Notes

  • #4 Electrical energy is consumed by pumps, instrumentation, lights, vents, etc. There are very few operations, if any, at a plant that do not rely on electricity. Largest users are pumps. In particular raw and finished water pumps. Luckily there are many opportunities, in most cases, for conservation of energy. While conservation and environmental efforts should start at the source, according to The U.S. Energy Information Administration, the bulk of our energy is still produced using fossil fuels.
  • #5 Many times efficiency improvements in one section contribute to efficiency in other sections. i.e. decreasing leakage in a system not only decreases distribution pumping, but also lowers the amount of treated water that needs to be produced, thereby decreasing runtimes for raw water pumps and treatment processes.
  • #6 The stream we are talking about today is starred. Many of todays lessons can be applied to other recycle streams as well as other parts of the treatment process.
  • #7 National Primary Drinking Water Regulations (NPDWRs or primary standards) are legally enforceable standards that apply to public water systems. Primary standards protect public health by limiting the levels of contaminants in drinking water. 10 States Standards- Water and Wastewater design standards adopted by various states around the country. Many New England states reference these standards or have a slight variation on them. Covers things such as treatment process regulations all the way to hydrant spacing. The total portion of inflow to a filter can have a maximum of 10% recycle water. So for a filter with an inflow of 1,000 gpm- 900 gpm can be raw water and 100 gpm can be recycle. NHDES Requirements Directly references CFR 40 sec 141.76- EPA National Primary Drinking Water Regulations
  • #8 FBRR Objective Reduce the concentration of Cryptosporidum oocysts in recycle water Recycle streams are a POTENTIAL source of high concentration of microbial pathogens and chemical contaminants- basically all of the things you count on your filter and coagulant removing from the water are pushed back to the head of your plant by recycling filter backwash. Contribute to the contaminant load Coagulant chemistry imbalance Hydraulic surge--overwhelms plant’s unit processes Regulated waste streams Spent Filter Backwash Water - A stream containing particles that are dislodged from filter media when water is forced back through a filter (backwashed) to clean the filter. Thickener Supernatant - A stream containing the decant from a sedimentation basin, clarifier or other unit that is used to treat water, solids, or semi-solids from the primary treatment processes. Liquids From Dewatering Processes - A stream containing liquids generated from a unit used to concentrate solids for disposal. http://water.epa.gov/lawsregs/rulesregs/sdwa/filterbackwash.cfm FBRR Required for plants with ALL of the following 1.) Treating with Conventional or Direct Filtration 2.) Uses surface water or groundwater directly influenced by surface water 3.) Recycles filter backwash, etc. FBRR Requires the following 1.) Notify the state of your recycling practices 2.) Recycle directly to front of the plant 3.) Maintain Records- Records will vary by the design flow size of your plant. Includes recycle flows, and frequency i.e. quantity Filter run length Type of treatment for recycle flows Backwash flow rates and duration Schematic, storage, and chemical treatment
  • #9 Source: U.S. Energy Information Administration eia.gov Permit Requirements Zero or limited groundwater discharge permits essentially require plants to have recycle streams. Reduced Waste Disposal Costs Recycling filter backwash water reduces need for storage and disposal as well as size of those facilities. Water Conservation Simple- Recycling water that would be going to waste conserves a large amount of source water While there is a potential presence of microbial contaminants in filter backwash water, the decant is often cleaner than the raw water entering the filters. Energy Savings A large portion of energy costs are from raw water pumps. Recycle pumps are typically much smaller than raw water pumps. Recycling Reduces the amount of raw water that needs to be pumped and can lead to savings, especially if raw water pumps are set on VFD’s. An overall reduced flow will be reduce required pump speeds and run times, which a VFD can account for while a throttling valve and a motor set to run at full speed will not.
  • #10 Chemical doses were assumed for PACL, HCL, etc. No unique treatment chemicals. Separation of water from solids can be obtained by and equalization and sedimentation chamber, mechanical dewatering, etc.
  • #11 New Hampshire State Energy Profile $12.33/kWH US energy information administration The majority of costs are due to disposal cost.
  • #12 Additional Chemical Costs are to treat 25,000 gallons of water per day- Actually a wash- you would be treating raw water with this either way Only additional pumping cost is for recycle pumping because the same amount of water is processed through the plant as would be if all recycle was sent to waste. Backwash pump is a partial trade off with a wasting pump. HP is typically greater on recycle pumps Backwash pumping reduces raw water pumping. 12.33 cents taken from the US energy information administration- Average industrial power cost for NH
  • #13 Sewer Rate is taken from Dover NH as a residential rate. Rate for municipal plant may be lower, but the cost of treatment is still real.
  • #14 Payback only takes into account select energy savings and reduced disposal costs. Other benefits include water conservation, reduced raw water pumping, etc. It can be seen that while recycle has a potential for large savings, capital costs for storage, pumps, instrumentation, VFD’s, etc. still have a substantial payback period. Increasing efficiency will lower this time period. Does not take into account inflation.
  • #15 The overall result is that backwashing is beneficial from an energy and cost perspective on a case by case basis. On a cost basis it might not always be beneficial to a plant to recycle their filter backwash, but usually it makes sense for other reasons i.e. water conservation and storage or disposal issues.
  • #16 Filter waste went directly to sewer. Started using backwash recycle Generic, will vary by system
  • #17 Backwash pumps usually run for short durations. Emphasis on demand charges- essentially the ability to instantly supply a large amount of energy. Reducing your large occasional energy demands, such as at pump start up, can reduce these charges. Demand charges vary based on peak hours. Talked about later in presentation. Optimizing chemical addition will reduce the quantity of sludge- most filter waste sludge is alum floc Remember that when recycling additional chemical may be needed depending on your waste stream Minimizing backwash duration will reduce the quantity seen. Can be improved through air scour, varying pump rates and durations.
  • #18 SCADA may be able to allow for production during off peak hours.
  • #19 Most facilities consist of pumping and piping systems in one form or another.
  • #23 Less backwash equals less flow More recycle reduces flow through raw water pumps Promoting Conservation Reduces Demand
  • #24 1.) During design or retrofit a pump can be sized so that under normal operating conditions the BEP is achieved. 2.) properly size both the pump and the motor. cycling of motors reduces the wear and maintenance on individual pumps. It also increases redundancy in the system. 3.) high efficiency motors can greatly reduce energy consumption. 4.) If a motor is running under a hard start, for a short duration, at an inefficient point on its curve, and this is not necessary, the pump can be modified using programming and VFD’s 5.) Regular maintenance keeps pumps running smoothly and reduces heat and friction. 6.) Automated controls can be set to limit speed, reduce heat, SCADA
  • #25 TDH- total dynamic head taking into account height pumped and friction losses. If a pump curve can be determined for the existing pump, that curve can then be compared to the manufacturers original to determine if pump is performing efficiently. If not the pump may require maintenance, rebuilding, or replacement.
  • #26 Make sure you are matching up the correct pump with the correct curve Make sure that any impeller trimming is recorded for pump evaluation The greater the efficiency the less energy required Horse power curves NPSH- Minimum amount of pressure on the suction side of the pump to overcome pump entrance losses. Pump will cavitate without proper NPSH. Operating range for all factors combined
  • #29 Minimizing backwash duration minimizes quantity Optimum filter backwash turbidity will vary by system Filter ripening time should be minimized when filter is placed back online filter backwash recycle goes through the entire treatment process again, so raw water can be used. Depends on raw water quality and may require some filter to waste. The use of air scour in the backwash process may allow a reduction in the backwash rate and duration, producing less spent filter backwash. Backwash based on head loss or differential pressure rather than time. Increasing filter run times can decrease the number of backwashes needed. Optimizing chemical addition can also increase filter run times. Mostly alum sludge in waste. Avoid running filter to point of breakthrough
  • #30 BEP= BEST EFFICINCY POINT Throttling valves burns up a portion of the energy expended by the pump. The better alternative is VFD’s- allow for efficient operation of a pump at a range of outputs. Instrumentation and controls allows the user to set parameters from a SCADA control screen. I.E. flow meters, level controls, etc. Allows for greater control and programming. Continuous operation simply uses energy. If pumps must remain running VFD’s can be used to minimize required energy.
  • #31 Frequency and voltage control the speed of a pump. Varying these can speed up or slow down a pump.
  • #32 Rebates through larger utilities like national grid or eversource. Rebates may still be available through a local electric utility though. Some municipalities qualify for grants under rural development. Just as with most rural development funding, specific criteria must be met as to average household income, population size, etc. Tax incentives may be available as part of larger efficiency programs such as LEED certifications or renewable energy projects Participation in energy demand markets requires cooperation between the local utility and the user. It requires a very through evaluation and monitoring program. We have never personally had a project use this incentive, but if a project was large enough, say an entire treatment plant or distribution center. It may be worth evaluating this.
  • #34 Who has SCADA?
  • #35 Preventive and predictive maintenance are central to having energy efficient equipment. Operating equipment should be inspected daily. Touch, listen, look, smell. Lubricate according to manufacturer’s recommendations. Use oil analysis. Check amperage/voltage unbalance and primary insulation. Check pump performance, wear surface clearance, etc. If a pump requires a lot of maintenance or performs poorly another type of pump may be more appropriate. IR Thermometers and thermography shows heat buildup that will eventually result in a breakdown. Vibration analysis can be used to identify worn bearings, misalignment, loose anchor bolts, and other problems. There are other evaluation tasks that could be performed. However, this list will eliminate 98% of the surprises.
  • #36 Recommended Annually
  • #37 From the US Deparment of Energy Lots of great resources for energy assessment The PSAT tool can be used to compare current pump efficiency with that of a replacement pump. Actually believe there is a quantification part of the tool. It can also be used to define minimum VFD set points for efficient operation points.
  • #38 Several different ways to dispose of backwash filter waste. Many can be combined with recycling techniques.
  • #39 Prohibited Discharges The discharge of ANY wastewater containing a regulated contaminant is prohibited as detailed in the Ambient Groundwater Quality Standards under EnvWq 402. These prohibited discharges include: · Facility discharges from open floor drains where regulated contaminants are used or stored. · Backwash from activated carbon treatment systems for the removal of chlorinated compounds, volatile organic compounds, or other petroleum and Solvent related contaminants. · Unfiltered or unsettled backwash from arsenic treatment devices.
  • #40 Greensand filter removing iron and manganese from ground water source. Recharged with potassium permanganate to recharge filter. Backwash water stored in two tanks and allowed to settle. Dolphin pump used to siphon clean decant from top and sent to front of plant. Remaining sludge pumped into secondary tank and stored. Remaining sludge often settles again and is mostly water. No reliable way to siphon this water to recycle safely without compromising filter. Installing two infiltration lagoons will allow for the operators to use an external pump to discharge this remaining water to the infiltration lagoons. Resulting in a concentrated sludge and reduced removal quantities and costs. Backwash flexibility is increased in the ability of the infiltration basins to take a portion of the backwash intended for recycle if necessary. Currently no piping directly into the tanks is intended, but this could be modified in the future for ease of use. The size of the lagoons is limited due to space constraints and cannot accept full backwash quantity. Environmental permitting was required and water quality was tested. Relates to filter backwash rule, if levels of contaminants were too great then water would need to be hauled off or reprocessed.
  • #41 Equalization chambers are essentially storage chambers that can be used to decrease settling times and normalize the flow of recycle into the raw water stream. Minimizing instrumentation dead band by recessing ultrasonic level instrumentation. Choosing the right instrumentation for the application (spacing from walls, age of control system, etc.) Installing updated flow meters for accurate readings at the proper distances up and down stream. Improving as technology improves. Creative programming includes limits on variables such as current, electrical draw, etc. Decreasing settling time using baffle curtains and walls Enchanced sludge removal using track vacs, chain and flight systems, as well as timing backwash pumps to remove waste as flow is introduced into equalization chamber.
  • #42 BEFORE Plant runs off of two different surface water sources seasonally. One close by and the other pumped using raw water pumps with soft starts. Pressure is much greater from the second source. Plant originally had limited backwash filter capacity Waste pumps pumped 24/7 when necessary directly to the sewer in order to create space in the tanks Recycle was limited due to pump size and required pressure to overcome the second raw water source pumps. Essentially no recycle was possible during this time. Waste and Recycle pumps were connected to SCADA and regulated by over the pipe flow meters. AFTER Upgrading recycle pumps allowed for year round recycling Increased storage allows for ability to recycle stored capacity within set limits Decreased settling time using baffle wall. Improved instrumentation and VFD’s allow for the pumps to be efficiently operated and accurately monitored for flow. Timer function programming is yet to be implemented, but should decrease the amount being wasted and increase the amount being recycled. Timer function was to be used to allow for greatest amount of clean recycle to be present in the equalization chamber while still creating room for next wash. Complicated system that uses both level and time controls. Timer functions can be used to separate pumps from the level instrumentation. Requires some calculation and should be combined with a redundant back up to reduce risk of overflow or over pumping.
  • #45 SCADA can provide much of this data if properly recording
  • #47 Pump efficiency is the number one way to improve energy efficiency Reducing quantity needed for filter backwash will improve