Download as PDF, PPTX
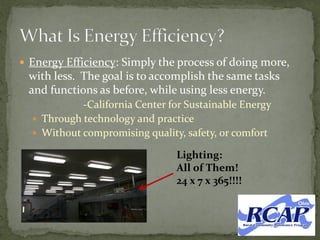
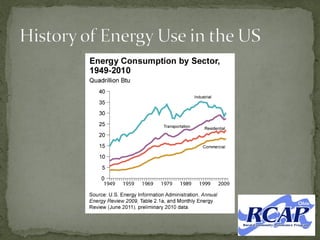

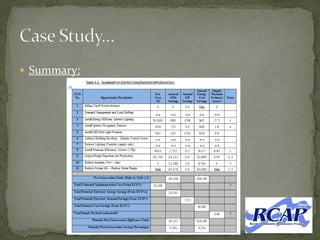

The document discusses energy conservation strategies, emphasizing the importance of efficiency in water and wastewater facilities to save costs and enhance operations. It highlights the inefficiencies in energy use across various sectors and provides tools and assessments to improve this efficiency. Additionally, the document outlines various opportunities for savings and the need for community education on water usage and conservation practices.


