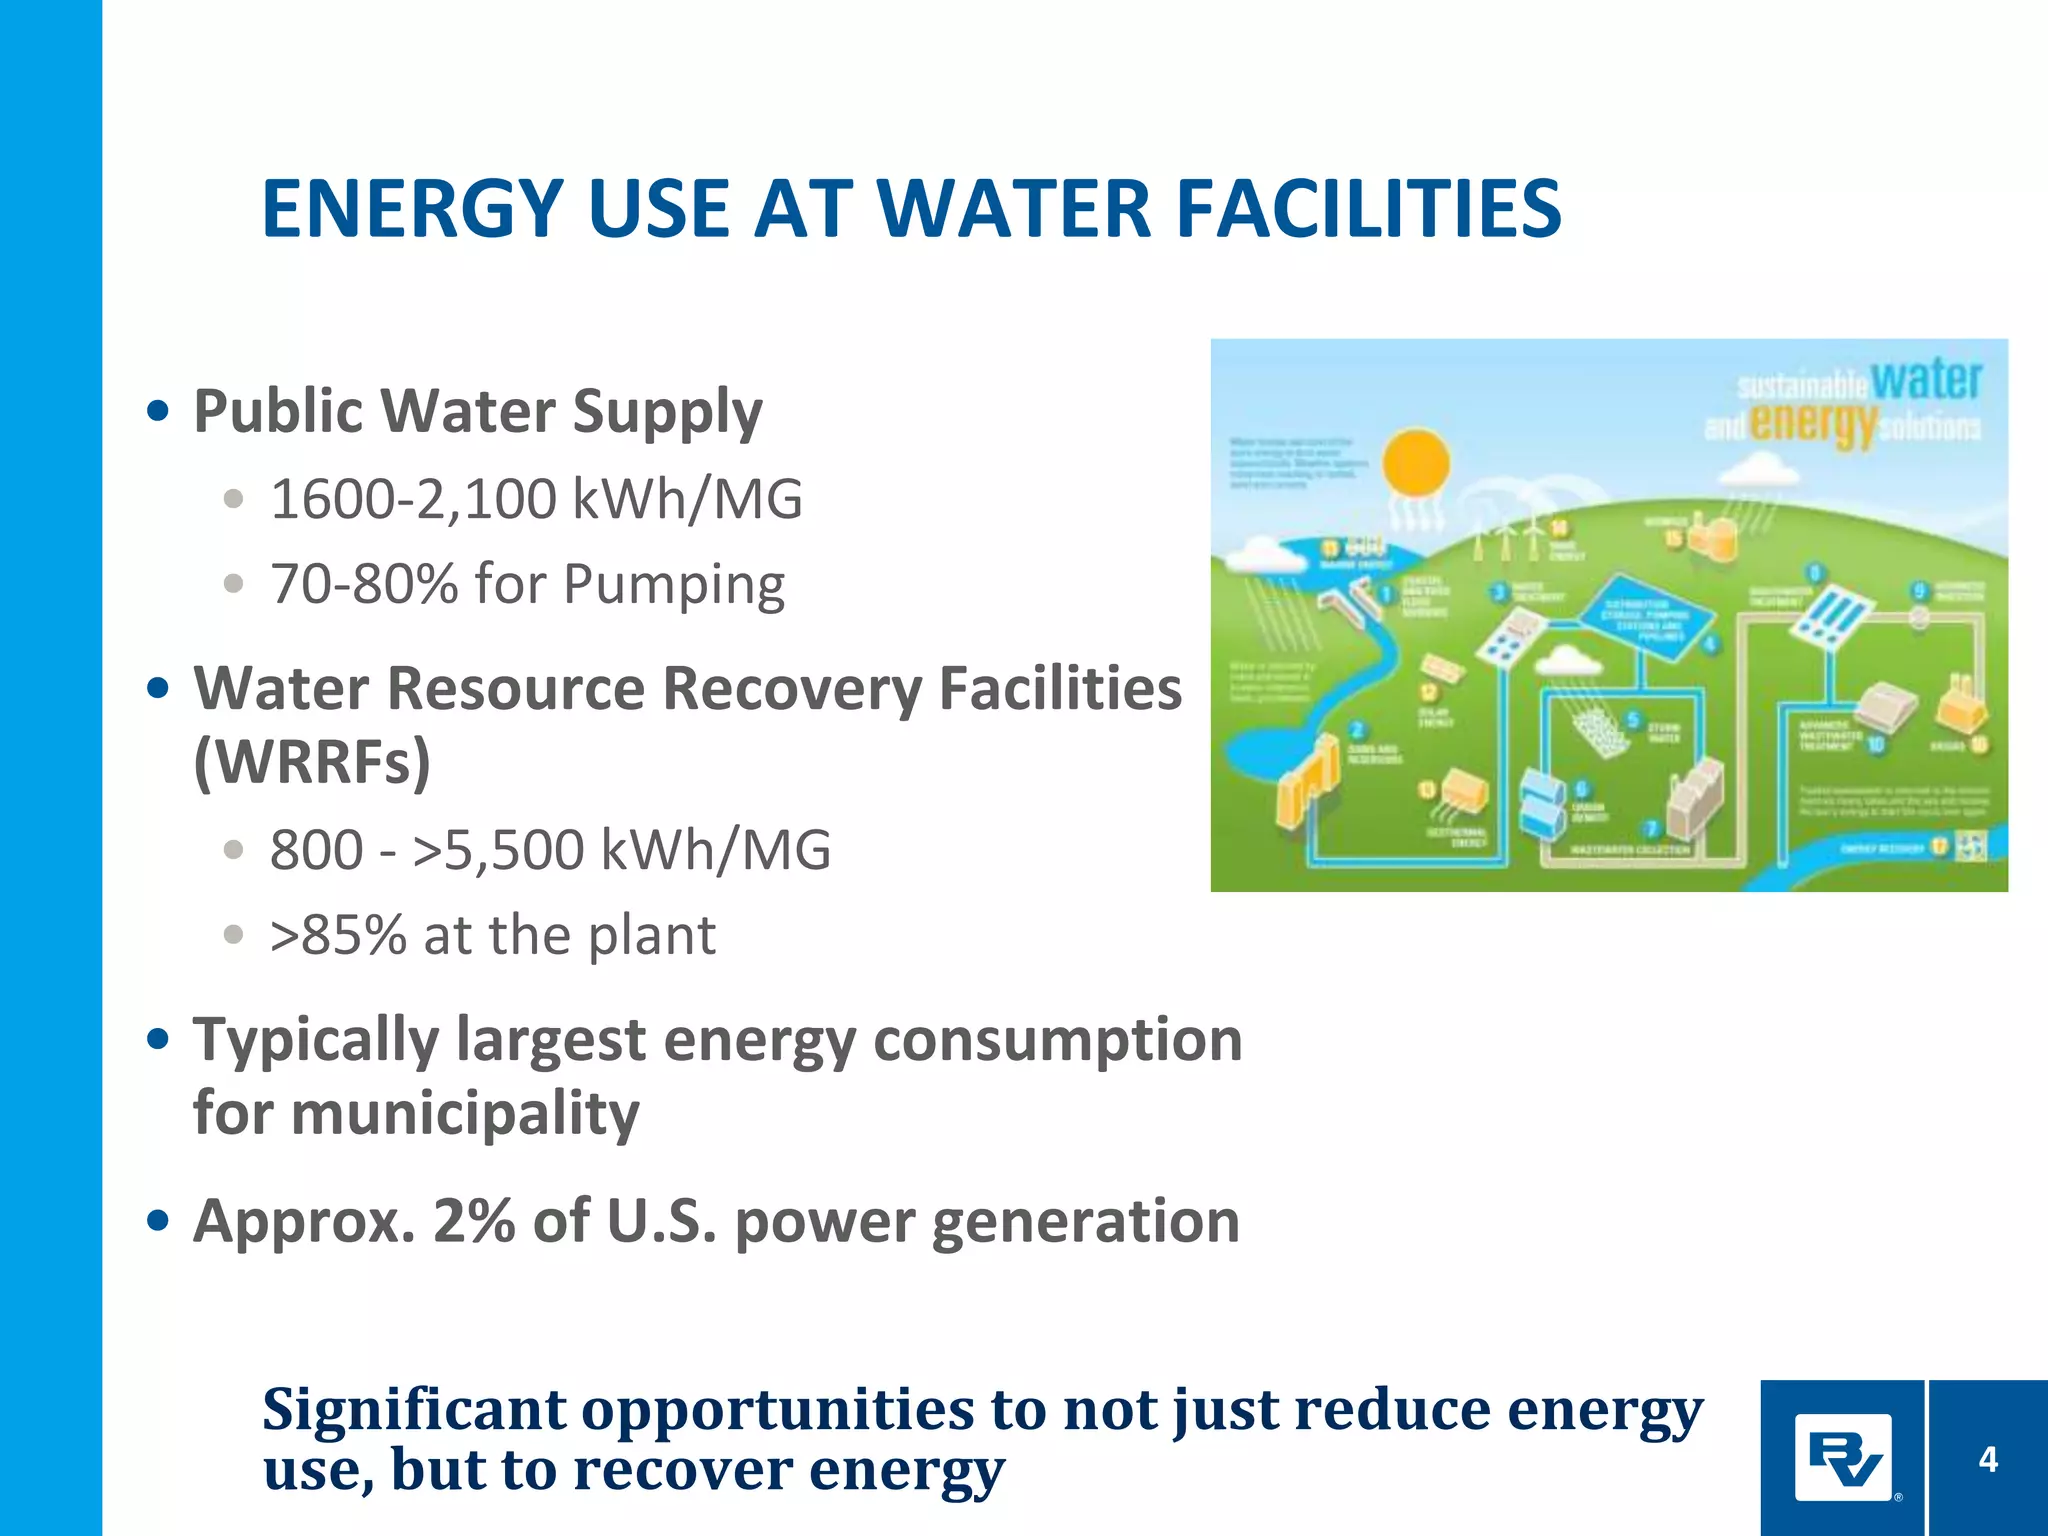
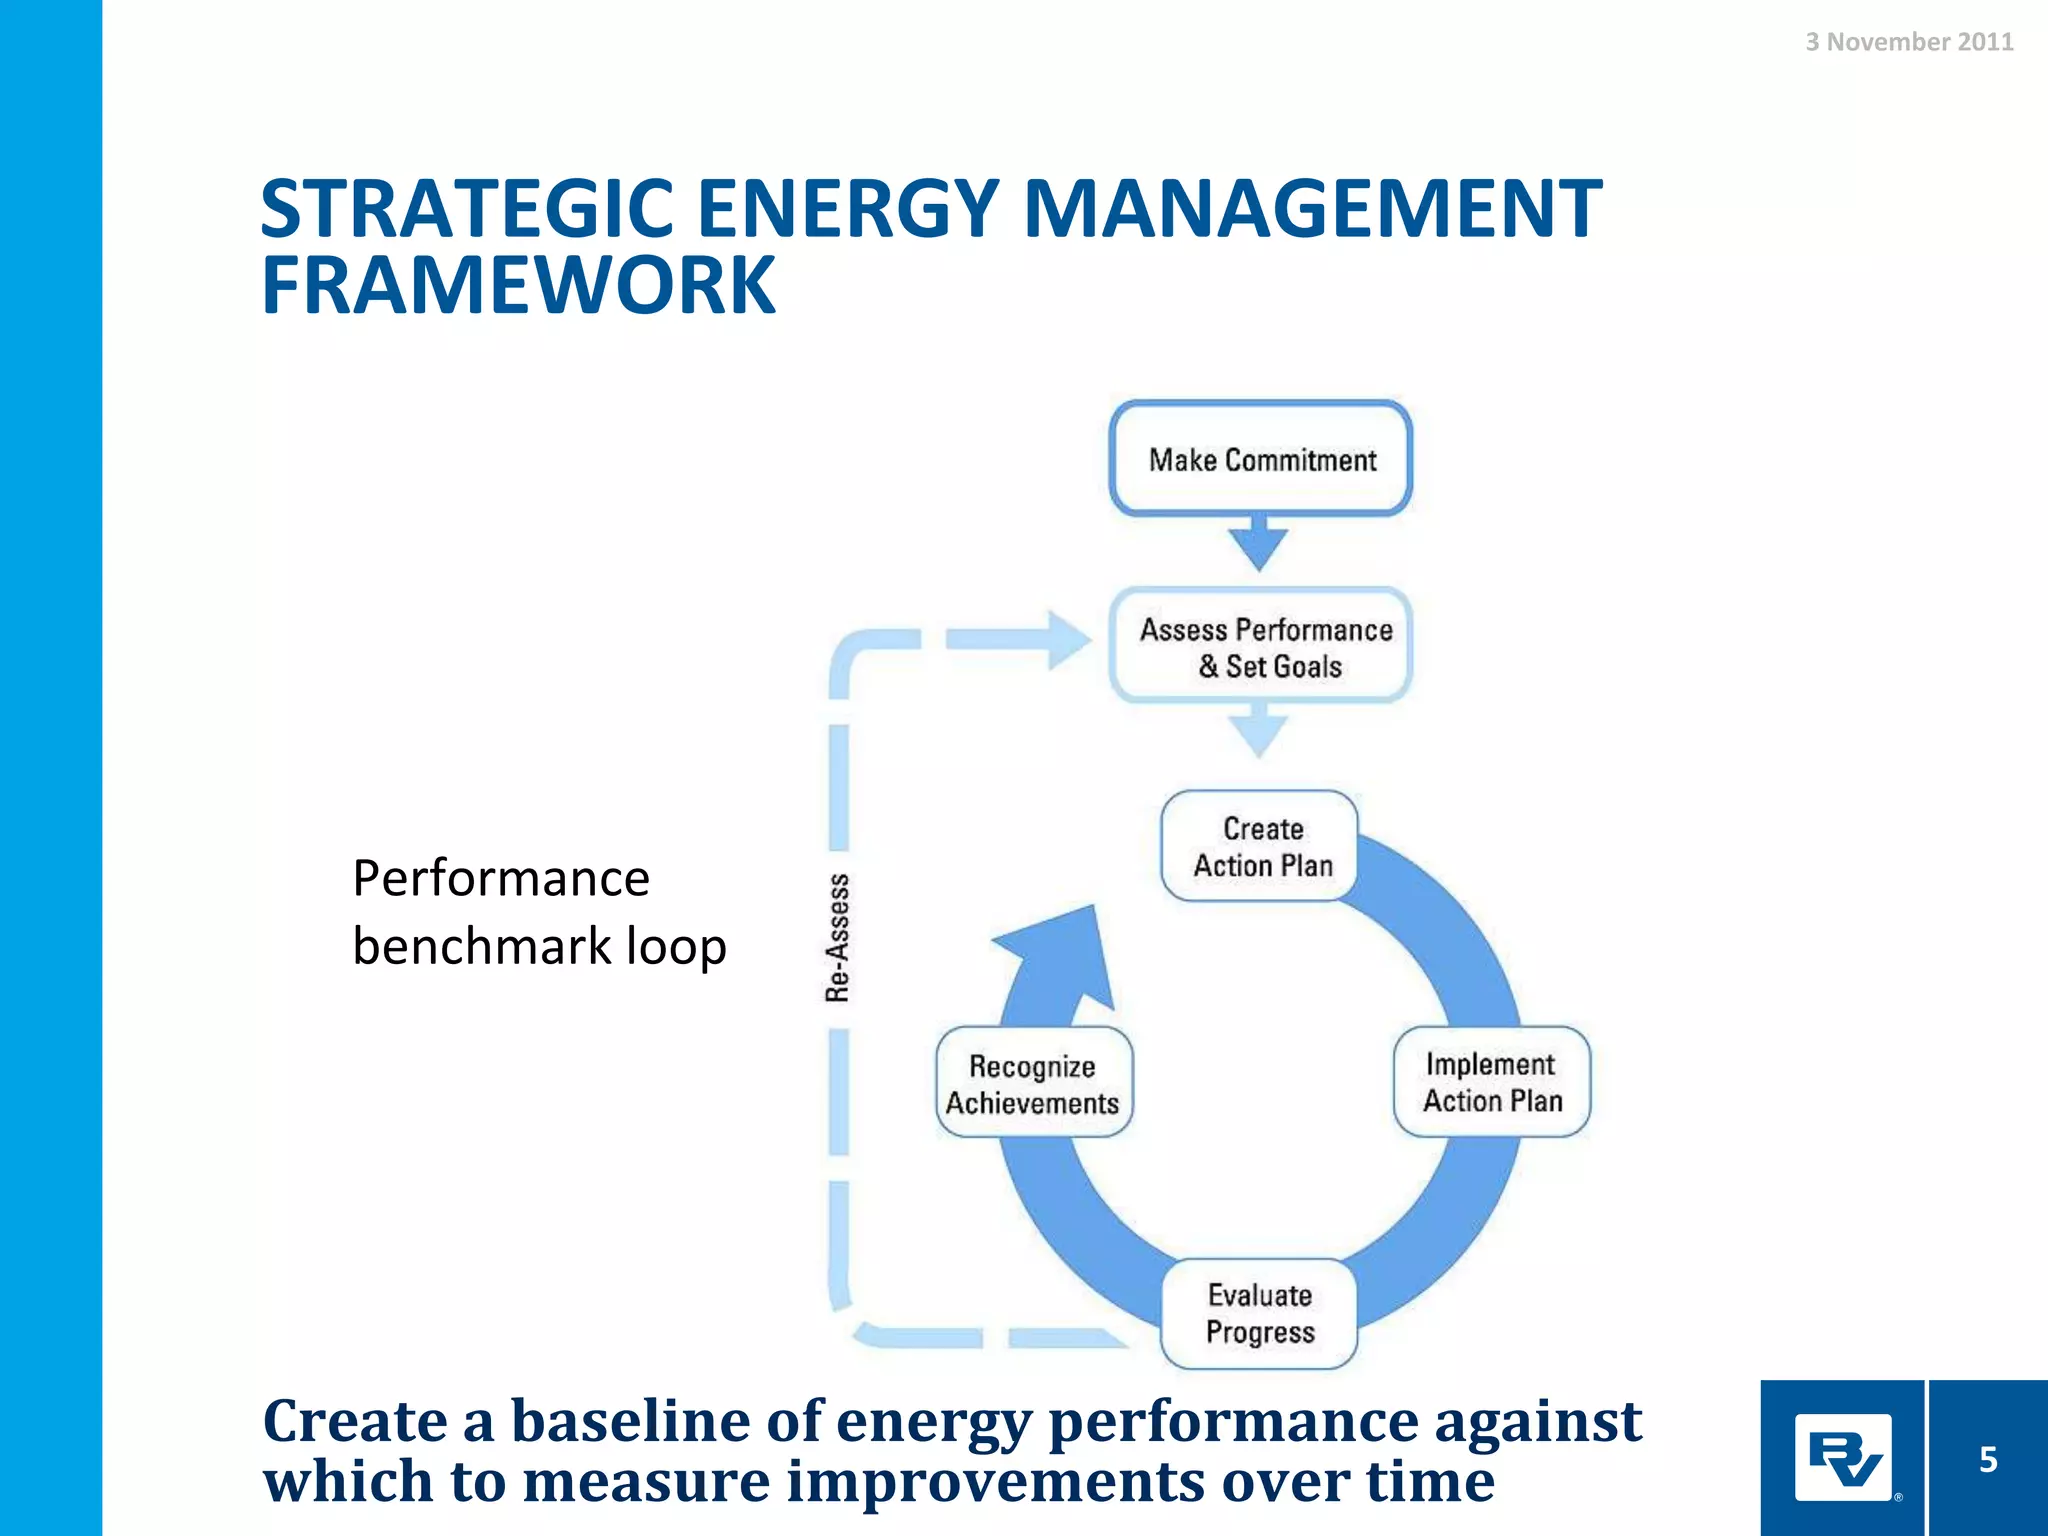
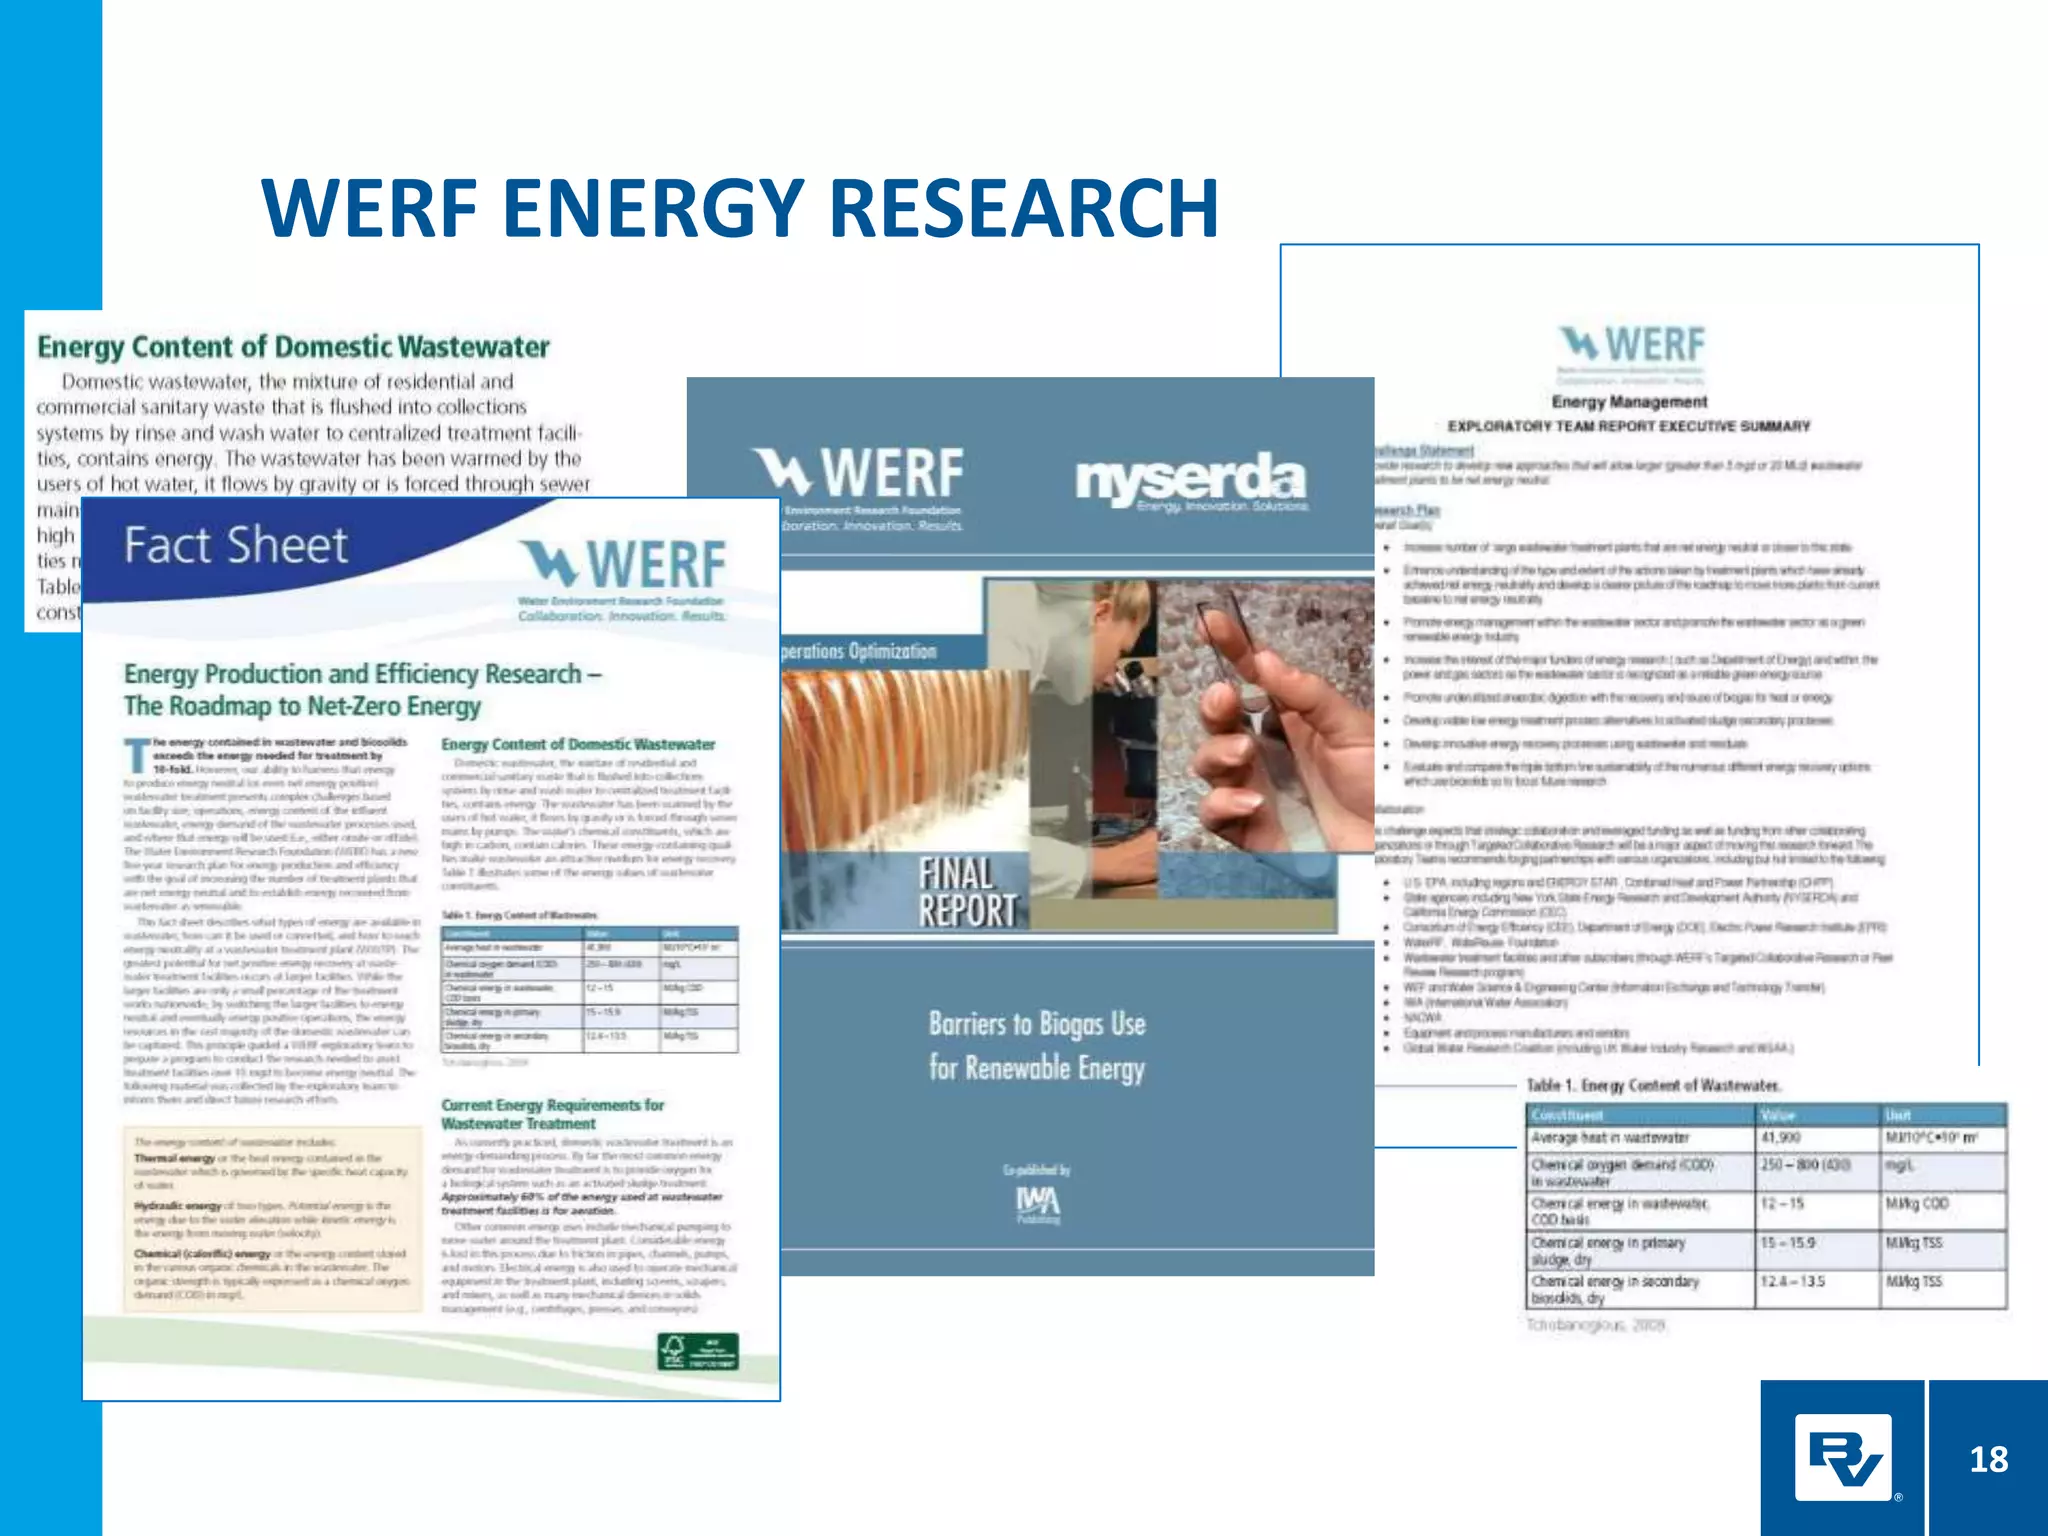
11November2015
NOW IS THE TIME FOR ENERGY
MANAGEMENT
STEVE TARALLO, ENV-SP
• New Paradigms in the Water Industry
• Energy Use at Water Facilities
• Opportunities
• Select Industry Leaders
• Industry Initiatives
• Energy Management Planning Methodology
• Q&A
AGENDA
2
3
NEW PARADIGMS
• Resilience
• Efficiency and Optimization
• Expanded environmental
stewardship
• Resource Recovery
• Net Zero energy use
• Life Cycle Thinking
• Triple Bottom Line
Destination: “Utility of the Future”
Significant opportunities to not just reduce energy
use, but to recover energy
• Public Water Supply
• 1600-2,100 kWh/MG
• 70-80% for Pumping
• Water Resource Recovery Facilities
(WRRFs)
• 800 - >5,500 kWh/MG
• >85% at the plant
• Typically largest energy consumption
for municipality
• Approx. 2% of U.S. power generation
ENERGY USE AT WATER FACILITIES
4
STRATEGIC ENERGY MANAGEMENT
FRAMEWORK
3 November 2011
5
Performance
benchmark loop
Create a baseline of energy performance against
which to measure improvements over time
OPPORTUNITIES
6
• Process Selection
• Biggest opportunity for energy
efficiency and recovery
• Carbon diversion
• Equipment Selection
• Oversized = inefficient
• Peak Flow/Load Management
• Reduce peak demands &
start/stops
DESIGN FOR ENERGY EFFICIENCY AND
RELIABILITY
7
OPERATING FOR ENERGY EFFICIENCY AND
RELIABILITY
8
• Operate Equipment Near
Design Point
• Turn Off Excess Capacity
• Maintain & Clean
Equipment
AERATION SYSTEM ENERGY OPTIMIZATION
3 November 2011
9
• Blowers + Piping/Diffusers + Controls = ONE SYSTEM
• High-efficiency diffusers
• Fine bubble; Ultra-fine bubble
• High-efficiency blowers
• Single-stage, integrally-geared centrifugal
• High-speed turbo gearless centrifugal
• Automatic DO/advanced control systems
• Most Open Valve; SRT/DO; BNR simulation
Need all components to work together for
overall system energy efficiency
FINE BUBBLE DIFFUSER MAINTENANCE
3 November 2011
10
0.2
0.3
0.3
0.6
0.9
1.2
1.5
1.8
2.1SOTE/ZorFSOTE/Z(%/ft)
NEW USED OLD
diffuser age
1
2
3
4
5
6
7
SOTE/ZorFSOTE/Z(%/m)
OR CLEANED (2-24 mo. in
operation)
(>24 mo. in
operation)
CARBON DIVERSION
3 November 2011
11
Improving Primary Tmt.
• 13% less oxygen demand (COD)
to aeration basin
• 13% more COD to anaerobic
digestion to increase gas
production
With CEPT
• 36% less COD to aeration basin
• >50% more COD to anaerobic
digestion to increase gas
production
ELECTRICAL INTENSITY (KWH/MG) FOR
DIFFERENT TREATMENT LEVELS
3 November 2011
12
Typical Best-Practice Improvement
Trickling filter 1058 793 25%
Secondary tmt. 1412 973 31%
Nitrification 1934 1249 35%
BNR 2070 1241 40%
ENR 1955 1202 39%
MBR 5676 2815 50%
Two-Sludge
(A/B)
1981 1277 36%
(from WERF ENER1C12 Net Zero Energy Solutions for WRRFs)
SELECT INDUSTRY
LEADERS
13
PHILADELPHIA WATER DEPT.
3 November 2011
14
• Utility-wide strategic energy plan
commissioned in 2008/2009
• Airport deicing fluid for co-
digestion/improved gas production
• 250kWp solar installation
• 1 million BTU/hr sewage geothermal
installation
• 5.6MW biogas cogeneration facility
• Innovative pilot tests and
demonstrations
DC WATER
3 November 2011
15
• From R&D to Implementation
• Thermal hydrolysis process (CAMBI)
for biogas augmentation
• 14MW CHP facility
• Sidestream short-cut nitrogen
removal
• Cutting-edge research into
mainstream short-cut nitrogen
removal
ITHACA, NY
3 November 2011
16
• High-strength waste processing facility
• Additional revenue streams (FOG,
dairy waste, other sludges and high-
strength wastes
• Generating approx. 100,000
kWh/month from biogas (4x65 MW
microturbines)
INDUSTRY INITIATIVES –
TECHNOLOGY
WERF ENERGY RESEARCH
LIFT PROGRAM
17
18
WERF ENERGY RESEARCH
Tools to help utilities develop their technology
roadmap towards net zero energy use 19
WERF ENER1C12 – NET ZERO ENERGY
SOLUTIONS FOR WATER RESOURCE
RECOVERY FACILITIES
Objective:
Provide research to develop new approaches that
will allow water resource recovery facilities to be
energy neutral, and thus able to operate solely on
the energy embedded in the water and wastes
they treat.
(from WERF Energy Management Challenge
Exploratory Team Report, January 2011)
3 November 2011
20
ENERGY FLOW (SANKEY) DIAGRAMS FOR
>50 WRRF CONFIGURATIONS
3 November 2011
21
WERF PROJECT MODELED INNOVATIVE ENERGY
EFFICIENCY AND RESOURCE RECOVERY TECHNOLOGIES
3 November 2011
22
3 November 2011
23
LIFT is a WERF-WEF program that
accelerates water technology
demand and adoption and engages
the entire water sector in all phases
of the innovation process
Greater collaboration leads to
faster adoption
ENERGY MASTER
PLANNING
METHODOLOGY
24
25
• Demand Management
• Energy efficiency
• Load shifting/shedding
• Improve power factor
• Supply Management
• Imported organic waste
• Renewable energy
• Combined Heat and Power
12 AM 7 AM 6 PM 12 AM
$15.00
$10.00
$5.00
0
DemandCost$perkW
Summer Winter
1 PM 8 PM
ENERGY PLANS OFTEN INCLUDE A PORTFOLIO
OF DEMAND AND SUPPLY SIDE MEASURES
Combination of no CAPEX, low CAPEX, and high
CAPEX measures. Holistic, integrated analysis.
Discretionary energy projects involve a wider set of
stakeholders and less certainty of costs and benefits 26
BUSINESS CASE EVALUATIONS
Decision
Decision
• Internal
• Financial (20-yr NPV)
• Costs and Benefits
easier to measure
Traditional
Compliance; Capacity
• Internal & External
• Triple Bottom Line
• Costs and Benefits more
difficult to measure
Energy
projects
Discretionary
HOLISTIC ENERGY EFFICIENCY RECOVERY
PLAN APPROACH MAXIMIZES VALUE
27
Organizational
Initiatives, KPIs
Energy Rate
Projections
Energy Rate
Analysis
Energy Master
Plan
EnergyDecisionCashFlowModel
Benchmarking &
System Eff. Review
Tech. Evaluations
Process
Mechanical
Electrical/Gas
Renewable Energy
Alternatives
Evaluations
Biogas Utilization
Thermal Energy
Solar and Other
Business Case
Evaluations
Project Screening &
Prioritization
Projected Energy
Demand Profile
Alternative
Demand Profile
Project Initiation /
Visioning and Goals
Workshop
Progress
Workshops
Capital Projects
TECHNOLOGY ROADMAP
Best Practices &
Operations
Energy Management
Dashboard
Performance
Management
Strategy Technical Business
Portfolio of projects to
implement over time
Informed decision-making
that mitigates risk
Alignment with
Utility’s Vision
TBL&BCEProcess
28
Energy Rate
Projections
Cash
Flow
Model
Projected Energy
Demand Profile
Alternative
Demand Profile
• Assess Energy Efficiency and Resource
Recovery projects on a portfolio basis
• Optimized energy project CIP through
risk-based project implementation
schedules
• Planning criteria that is in line with
strategic objectives of the utility
• Facilitates business case development for
discretionary energy projects
ENERGY DECISION CASH FLOW MODEL
ENERGY PROJECT PORTFOLIO MANAGEMENT
3 November 2011
29
CONCLUSION
30
• The value of energy efficiency and resource recovery is becoming
widely recognized
• Energy efficiency and recovery projects can result in significant
cost savings, but can also require significant capital investment
• It is important to make a sound Business Case
• To date, most utilities have taken a fragmentary approach
(isolated projects) to energy management.
• To extract sustained value from energy management, an
integrated project portfolio approach is beneficial
• Numerous tools, manuals, research reports are available to help
guide you towards achieving your energy management objectives
IN CONCLUSION
31
THANK YOU!
QUESTIONS?
32
• Shift to value based management
• Value vs. cost
• Revenue generation vs. regulatory
compliance alone or cost savings alone
• Risk
• Higher risk acceptance
• Stakeholders
• More of them
• More diverse
• Opportunity identification / Innovation
STRATEGIC CHALLENGES
33
• Culture
• Key Performance Indicators / Incentives
• Energy efficiency (e.g. kWh or MMBTU
per MG
• Net Present Value
• Business Partners
• Buyer / Seller
• Alternative delivery (e.g. Energy
Performance Contracting)
• Business Process realignment
• Training of O&M personnel
ORGANIZATIONAL CHALLENGES
34
• Maximize utilization of existing assets
• Process “fit”
• Alignment with Asset Management
• “New” technologies
• Pilot studies
• Demonstrations
• WERF LIFT program
• Technology Roadmap
• Set future course
• Phased implementation towards achieving
a future performance goal (e.g. “net zero
energy use”)
TECHNOLOGICAL CHALLENGES
35
FINANCIAL CHALLENGES
36
• Discretionary spending
• Competition for limited capital funds
• Volatile Energy market conditions
• Will low natural gas prices continue?
• Strong dependence on energy policy /
strategic directions in the energy industry
INDUSTRY INITIATIVES –
PLANNING
WEF ENERGY ROADMAP
37
38
SIX TOPICS
THREE LEVELS OF PROGRESSION
39
PRIORITIZE EFFORTS BASED ON IMPORTANCE
AND CURRENT LEVEL OF ACHIEVEMENT
40
Highest
Priority
MOST SIGNIFICANT SUSTAINABILITY ISSUES
3 November 2011
41
58.7%
34.2%
39.1%
26.4%
30.4%
25.8%
8.2%
12.2%
7.1%
53.2%
31.8%
31.3%
27.1%
21.9%
18.4%
15.7%
11.2%
9.7%
Maintaining or expanding asset life
Customer water rates
Long-term financial viability
Energy efficiency
Maintaining service with declining budgets
Reducing sanitary sewer overflows
Distribution system water loss
Energy recovery/generation
Chemical use
Trends: 2014 and 2015
2014
2015
Source: 2015 Strategic Directions: U.S Water Industry Report (Black & Veatch)

Now Is the Time for Energy Management

  • 1.
    11November2015 NOW IS THETIME FOR ENERGY MANAGEMENT STEVE TARALLO, ENV-SP
  • 2.
    • New Paradigmsin the Water Industry • Energy Use at Water Facilities • Opportunities • Select Industry Leaders • Industry Initiatives • Energy Management Planning Methodology • Q&A AGENDA 2
  • 3.
    3 NEW PARADIGMS • Resilience •Efficiency and Optimization • Expanded environmental stewardship • Resource Recovery • Net Zero energy use • Life Cycle Thinking • Triple Bottom Line Destination: “Utility of the Future”
  • 4.
    Significant opportunities tonot just reduce energy use, but to recover energy • Public Water Supply • 1600-2,100 kWh/MG • 70-80% for Pumping • Water Resource Recovery Facilities (WRRFs) • 800 - >5,500 kWh/MG • >85% at the plant • Typically largest energy consumption for municipality • Approx. 2% of U.S. power generation ENERGY USE AT WATER FACILITIES 4
  • 5.
    STRATEGIC ENERGY MANAGEMENT FRAMEWORK 3November 2011 5 Performance benchmark loop Create a baseline of energy performance against which to measure improvements over time
  • 6.
  • 7.
    • Process Selection •Biggest opportunity for energy efficiency and recovery • Carbon diversion • Equipment Selection • Oversized = inefficient • Peak Flow/Load Management • Reduce peak demands & start/stops DESIGN FOR ENERGY EFFICIENCY AND RELIABILITY 7
  • 8.
    OPERATING FOR ENERGYEFFICIENCY AND RELIABILITY 8 • Operate Equipment Near Design Point • Turn Off Excess Capacity • Maintain & Clean Equipment
  • 9.
    AERATION SYSTEM ENERGYOPTIMIZATION 3 November 2011 9 • Blowers + Piping/Diffusers + Controls = ONE SYSTEM • High-efficiency diffusers • Fine bubble; Ultra-fine bubble • High-efficiency blowers • Single-stage, integrally-geared centrifugal • High-speed turbo gearless centrifugal • Automatic DO/advanced control systems • Most Open Valve; SRT/DO; BNR simulation Need all components to work together for overall system energy efficiency
  • 10.
    FINE BUBBLE DIFFUSERMAINTENANCE 3 November 2011 10 0.2 0.3 0.3 0.6 0.9 1.2 1.5 1.8 2.1SOTE/ZorFSOTE/Z(%/ft) NEW USED OLD diffuser age 1 2 3 4 5 6 7 SOTE/ZorFSOTE/Z(%/m) OR CLEANED (2-24 mo. in operation) (>24 mo. in operation)
  • 11.
    CARBON DIVERSION 3 November2011 11 Improving Primary Tmt. • 13% less oxygen demand (COD) to aeration basin • 13% more COD to anaerobic digestion to increase gas production With CEPT • 36% less COD to aeration basin • >50% more COD to anaerobic digestion to increase gas production
  • 12.
    ELECTRICAL INTENSITY (KWH/MG)FOR DIFFERENT TREATMENT LEVELS 3 November 2011 12 Typical Best-Practice Improvement Trickling filter 1058 793 25% Secondary tmt. 1412 973 31% Nitrification 1934 1249 35% BNR 2070 1241 40% ENR 1955 1202 39% MBR 5676 2815 50% Two-Sludge (A/B) 1981 1277 36% (from WERF ENER1C12 Net Zero Energy Solutions for WRRFs)
  • 13.
  • 14.
    PHILADELPHIA WATER DEPT. 3November 2011 14 • Utility-wide strategic energy plan commissioned in 2008/2009 • Airport deicing fluid for co- digestion/improved gas production • 250kWp solar installation • 1 million BTU/hr sewage geothermal installation • 5.6MW biogas cogeneration facility • Innovative pilot tests and demonstrations
  • 15.
    DC WATER 3 November2011 15 • From R&D to Implementation • Thermal hydrolysis process (CAMBI) for biogas augmentation • 14MW CHP facility • Sidestream short-cut nitrogen removal • Cutting-edge research into mainstream short-cut nitrogen removal
  • 16.
    ITHACA, NY 3 November2011 16 • High-strength waste processing facility • Additional revenue streams (FOG, dairy waste, other sludges and high- strength wastes • Generating approx. 100,000 kWh/month from biogas (4x65 MW microturbines)
  • 17.
    INDUSTRY INITIATIVES – TECHNOLOGY WERFENERGY RESEARCH LIFT PROGRAM 17
  • 18.
  • 19.
    Tools to helputilities develop their technology roadmap towards net zero energy use 19 WERF ENER1C12 – NET ZERO ENERGY SOLUTIONS FOR WATER RESOURCE RECOVERY FACILITIES Objective: Provide research to develop new approaches that will allow water resource recovery facilities to be energy neutral, and thus able to operate solely on the energy embedded in the water and wastes they treat. (from WERF Energy Management Challenge Exploratory Team Report, January 2011)
  • 20.
  • 21.
    ENERGY FLOW (SANKEY)DIAGRAMS FOR >50 WRRF CONFIGURATIONS 3 November 2011 21
  • 22.
    WERF PROJECT MODELEDINNOVATIVE ENERGY EFFICIENCY AND RESOURCE RECOVERY TECHNOLOGIES 3 November 2011 22
  • 23.
    3 November 2011 23 LIFTis a WERF-WEF program that accelerates water technology demand and adoption and engages the entire water sector in all phases of the innovation process Greater collaboration leads to faster adoption
  • 24.
  • 25.
    25 • Demand Management •Energy efficiency • Load shifting/shedding • Improve power factor • Supply Management • Imported organic waste • Renewable energy • Combined Heat and Power 12 AM 7 AM 6 PM 12 AM $15.00 $10.00 $5.00 0 DemandCost$perkW Summer Winter 1 PM 8 PM ENERGY PLANS OFTEN INCLUDE A PORTFOLIO OF DEMAND AND SUPPLY SIDE MEASURES Combination of no CAPEX, low CAPEX, and high CAPEX measures. Holistic, integrated analysis.
  • 26.
    Discretionary energy projectsinvolve a wider set of stakeholders and less certainty of costs and benefits 26 BUSINESS CASE EVALUATIONS Decision Decision • Internal • Financial (20-yr NPV) • Costs and Benefits easier to measure Traditional Compliance; Capacity • Internal & External • Triple Bottom Line • Costs and Benefits more difficult to measure Energy projects Discretionary
  • 27.
    HOLISTIC ENERGY EFFICIENCYRECOVERY PLAN APPROACH MAXIMIZES VALUE 27 Organizational Initiatives, KPIs Energy Rate Projections Energy Rate Analysis Energy Master Plan EnergyDecisionCashFlowModel Benchmarking & System Eff. Review Tech. Evaluations Process Mechanical Electrical/Gas Renewable Energy Alternatives Evaluations Biogas Utilization Thermal Energy Solar and Other Business Case Evaluations Project Screening & Prioritization Projected Energy Demand Profile Alternative Demand Profile Project Initiation / Visioning and Goals Workshop Progress Workshops Capital Projects TECHNOLOGY ROADMAP Best Practices & Operations Energy Management Dashboard Performance Management Strategy Technical Business Portfolio of projects to implement over time Informed decision-making that mitigates risk Alignment with Utility’s Vision TBL&BCEProcess
  • 28.
    28 Energy Rate Projections Cash Flow Model Projected Energy DemandProfile Alternative Demand Profile • Assess Energy Efficiency and Resource Recovery projects on a portfolio basis • Optimized energy project CIP through risk-based project implementation schedules • Planning criteria that is in line with strategic objectives of the utility • Facilitates business case development for discretionary energy projects ENERGY DECISION CASH FLOW MODEL
  • 29.
    ENERGY PROJECT PORTFOLIOMANAGEMENT 3 November 2011 29
  • 30.
  • 31.
    • The valueof energy efficiency and resource recovery is becoming widely recognized • Energy efficiency and recovery projects can result in significant cost savings, but can also require significant capital investment • It is important to make a sound Business Case • To date, most utilities have taken a fragmentary approach (isolated projects) to energy management. • To extract sustained value from energy management, an integrated project portfolio approach is beneficial • Numerous tools, manuals, research reports are available to help guide you towards achieving your energy management objectives IN CONCLUSION 31
  • 32.
  • 33.
    • Shift tovalue based management • Value vs. cost • Revenue generation vs. regulatory compliance alone or cost savings alone • Risk • Higher risk acceptance • Stakeholders • More of them • More diverse • Opportunity identification / Innovation STRATEGIC CHALLENGES 33
  • 34.
    • Culture • KeyPerformance Indicators / Incentives • Energy efficiency (e.g. kWh or MMBTU per MG • Net Present Value • Business Partners • Buyer / Seller • Alternative delivery (e.g. Energy Performance Contracting) • Business Process realignment • Training of O&M personnel ORGANIZATIONAL CHALLENGES 34
  • 35.
    • Maximize utilizationof existing assets • Process “fit” • Alignment with Asset Management • “New” technologies • Pilot studies • Demonstrations • WERF LIFT program • Technology Roadmap • Set future course • Phased implementation towards achieving a future performance goal (e.g. “net zero energy use”) TECHNOLOGICAL CHALLENGES 35
  • 36.
    FINANCIAL CHALLENGES 36 • Discretionaryspending • Competition for limited capital funds • Volatile Energy market conditions • Will low natural gas prices continue? • Strong dependence on energy policy / strategic directions in the energy industry
  • 37.
  • 38.
  • 39.
    SIX TOPICS THREE LEVELSOF PROGRESSION 39
  • 40.
    PRIORITIZE EFFORTS BASEDON IMPORTANCE AND CURRENT LEVEL OF ACHIEVEMENT 40 Highest Priority
  • 41.
    MOST SIGNIFICANT SUSTAINABILITYISSUES 3 November 2011 41 58.7% 34.2% 39.1% 26.4% 30.4% 25.8% 8.2% 12.2% 7.1% 53.2% 31.8% 31.3% 27.1% 21.9% 18.4% 15.7% 11.2% 9.7% Maintaining or expanding asset life Customer water rates Long-term financial viability Energy efficiency Maintaining service with declining budgets Reducing sanitary sewer overflows Distribution system water loss Energy recovery/generation Chemical use Trends: 2014 and 2015 2014 2015 Source: 2015 Strategic Directions: U.S Water Industry Report (Black & Veatch)