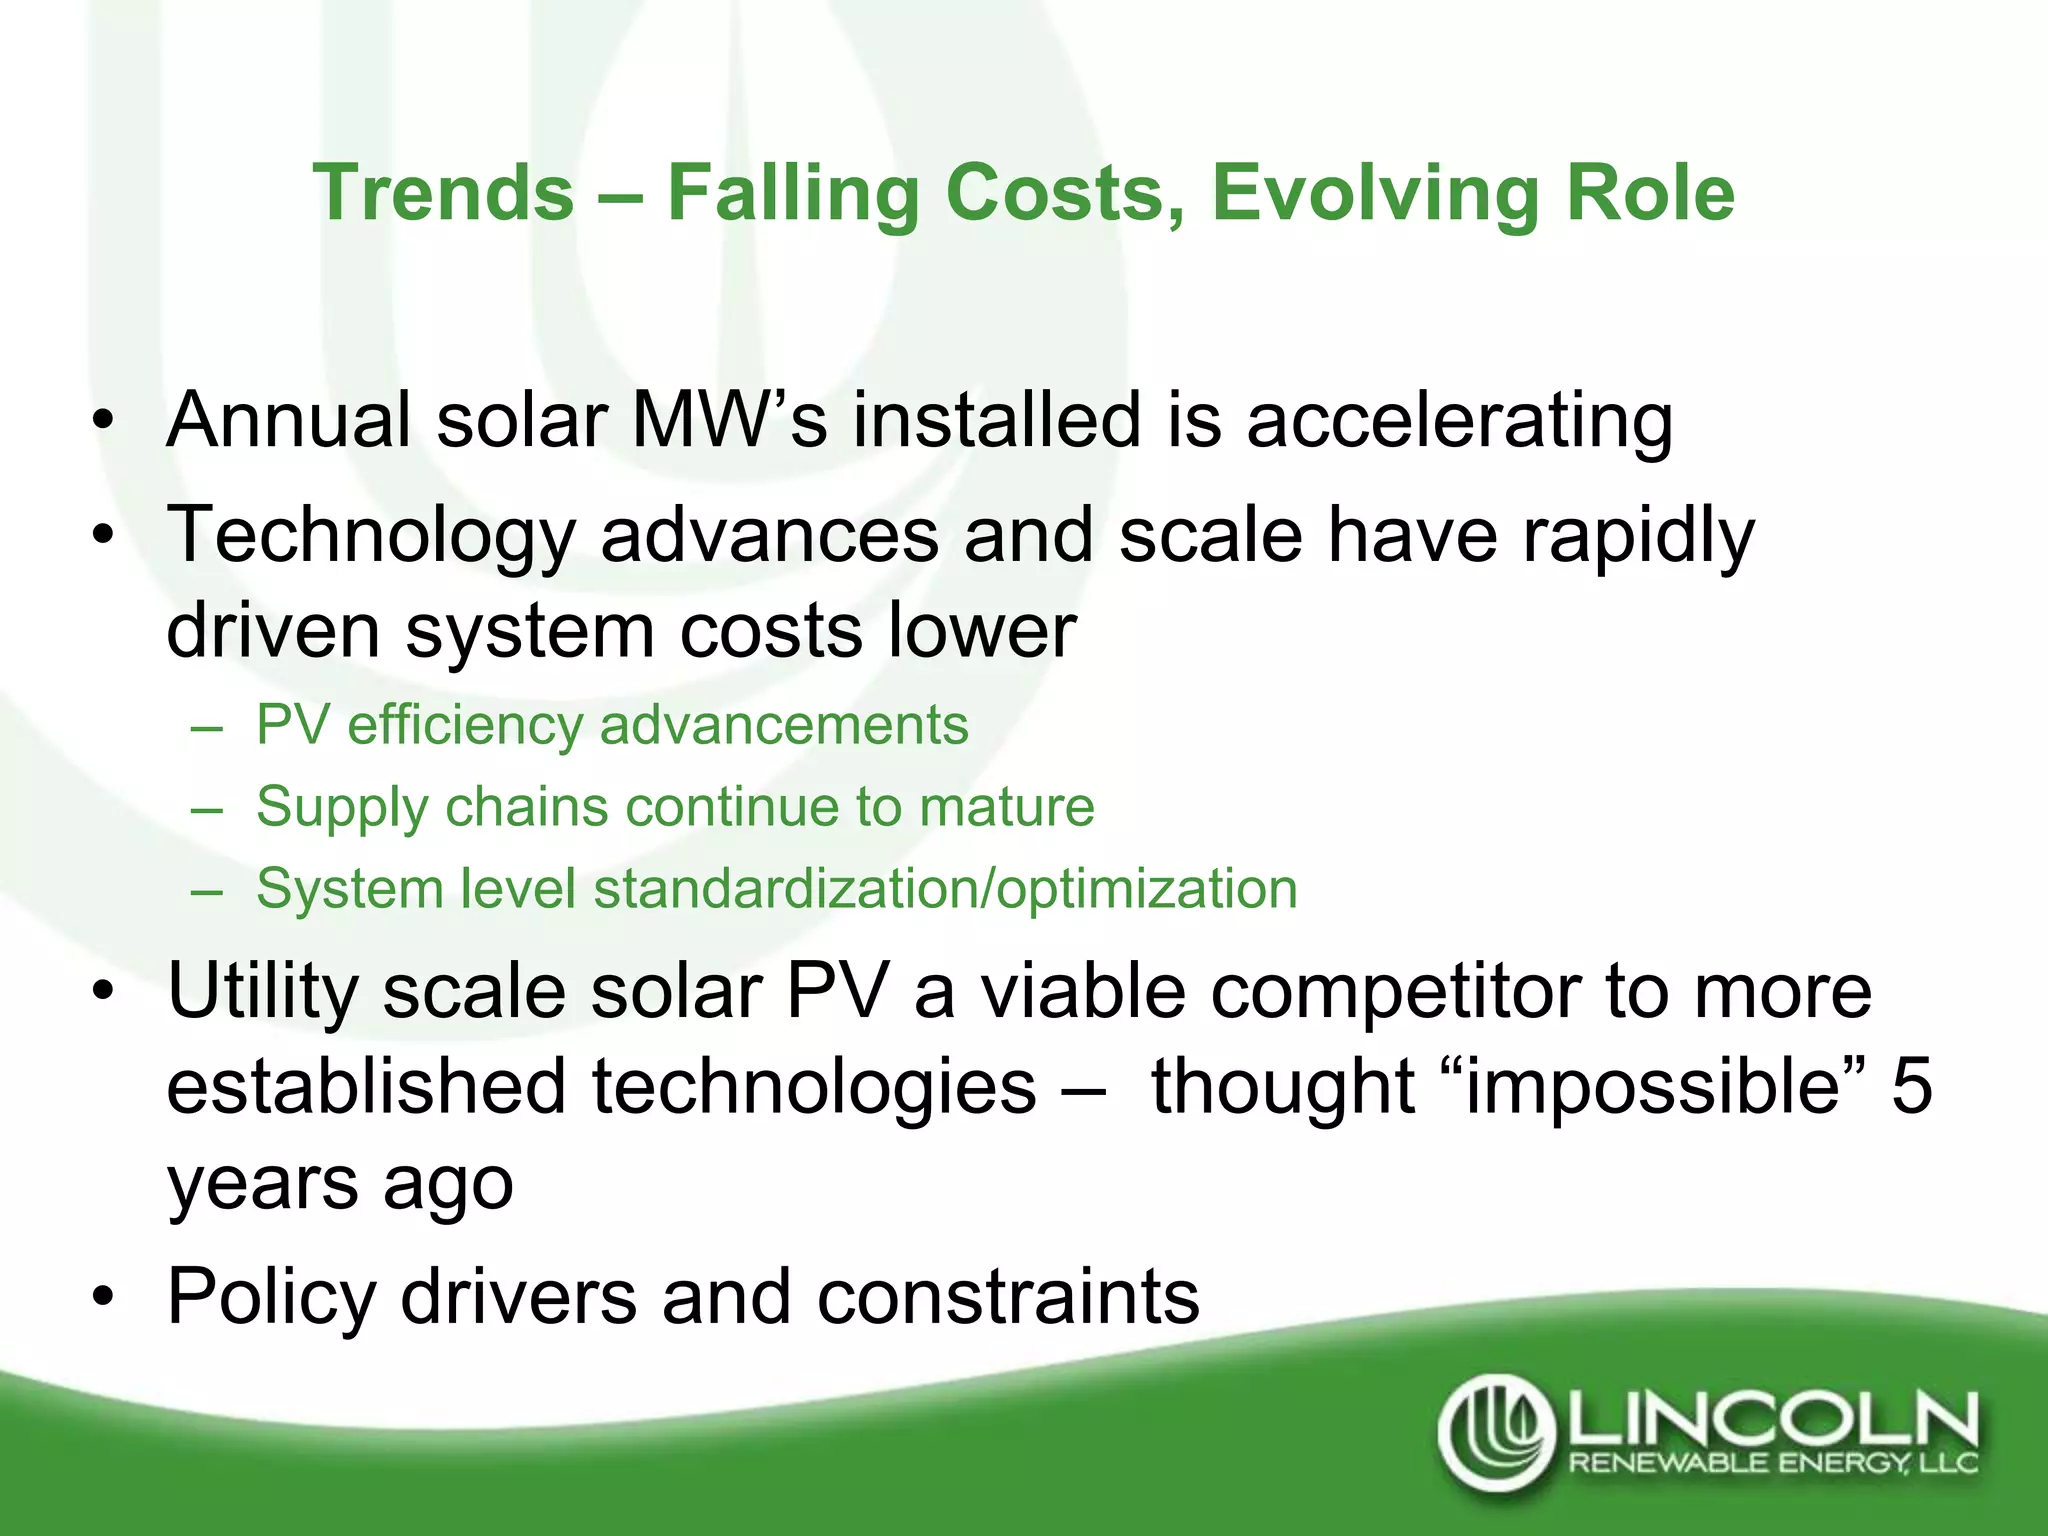
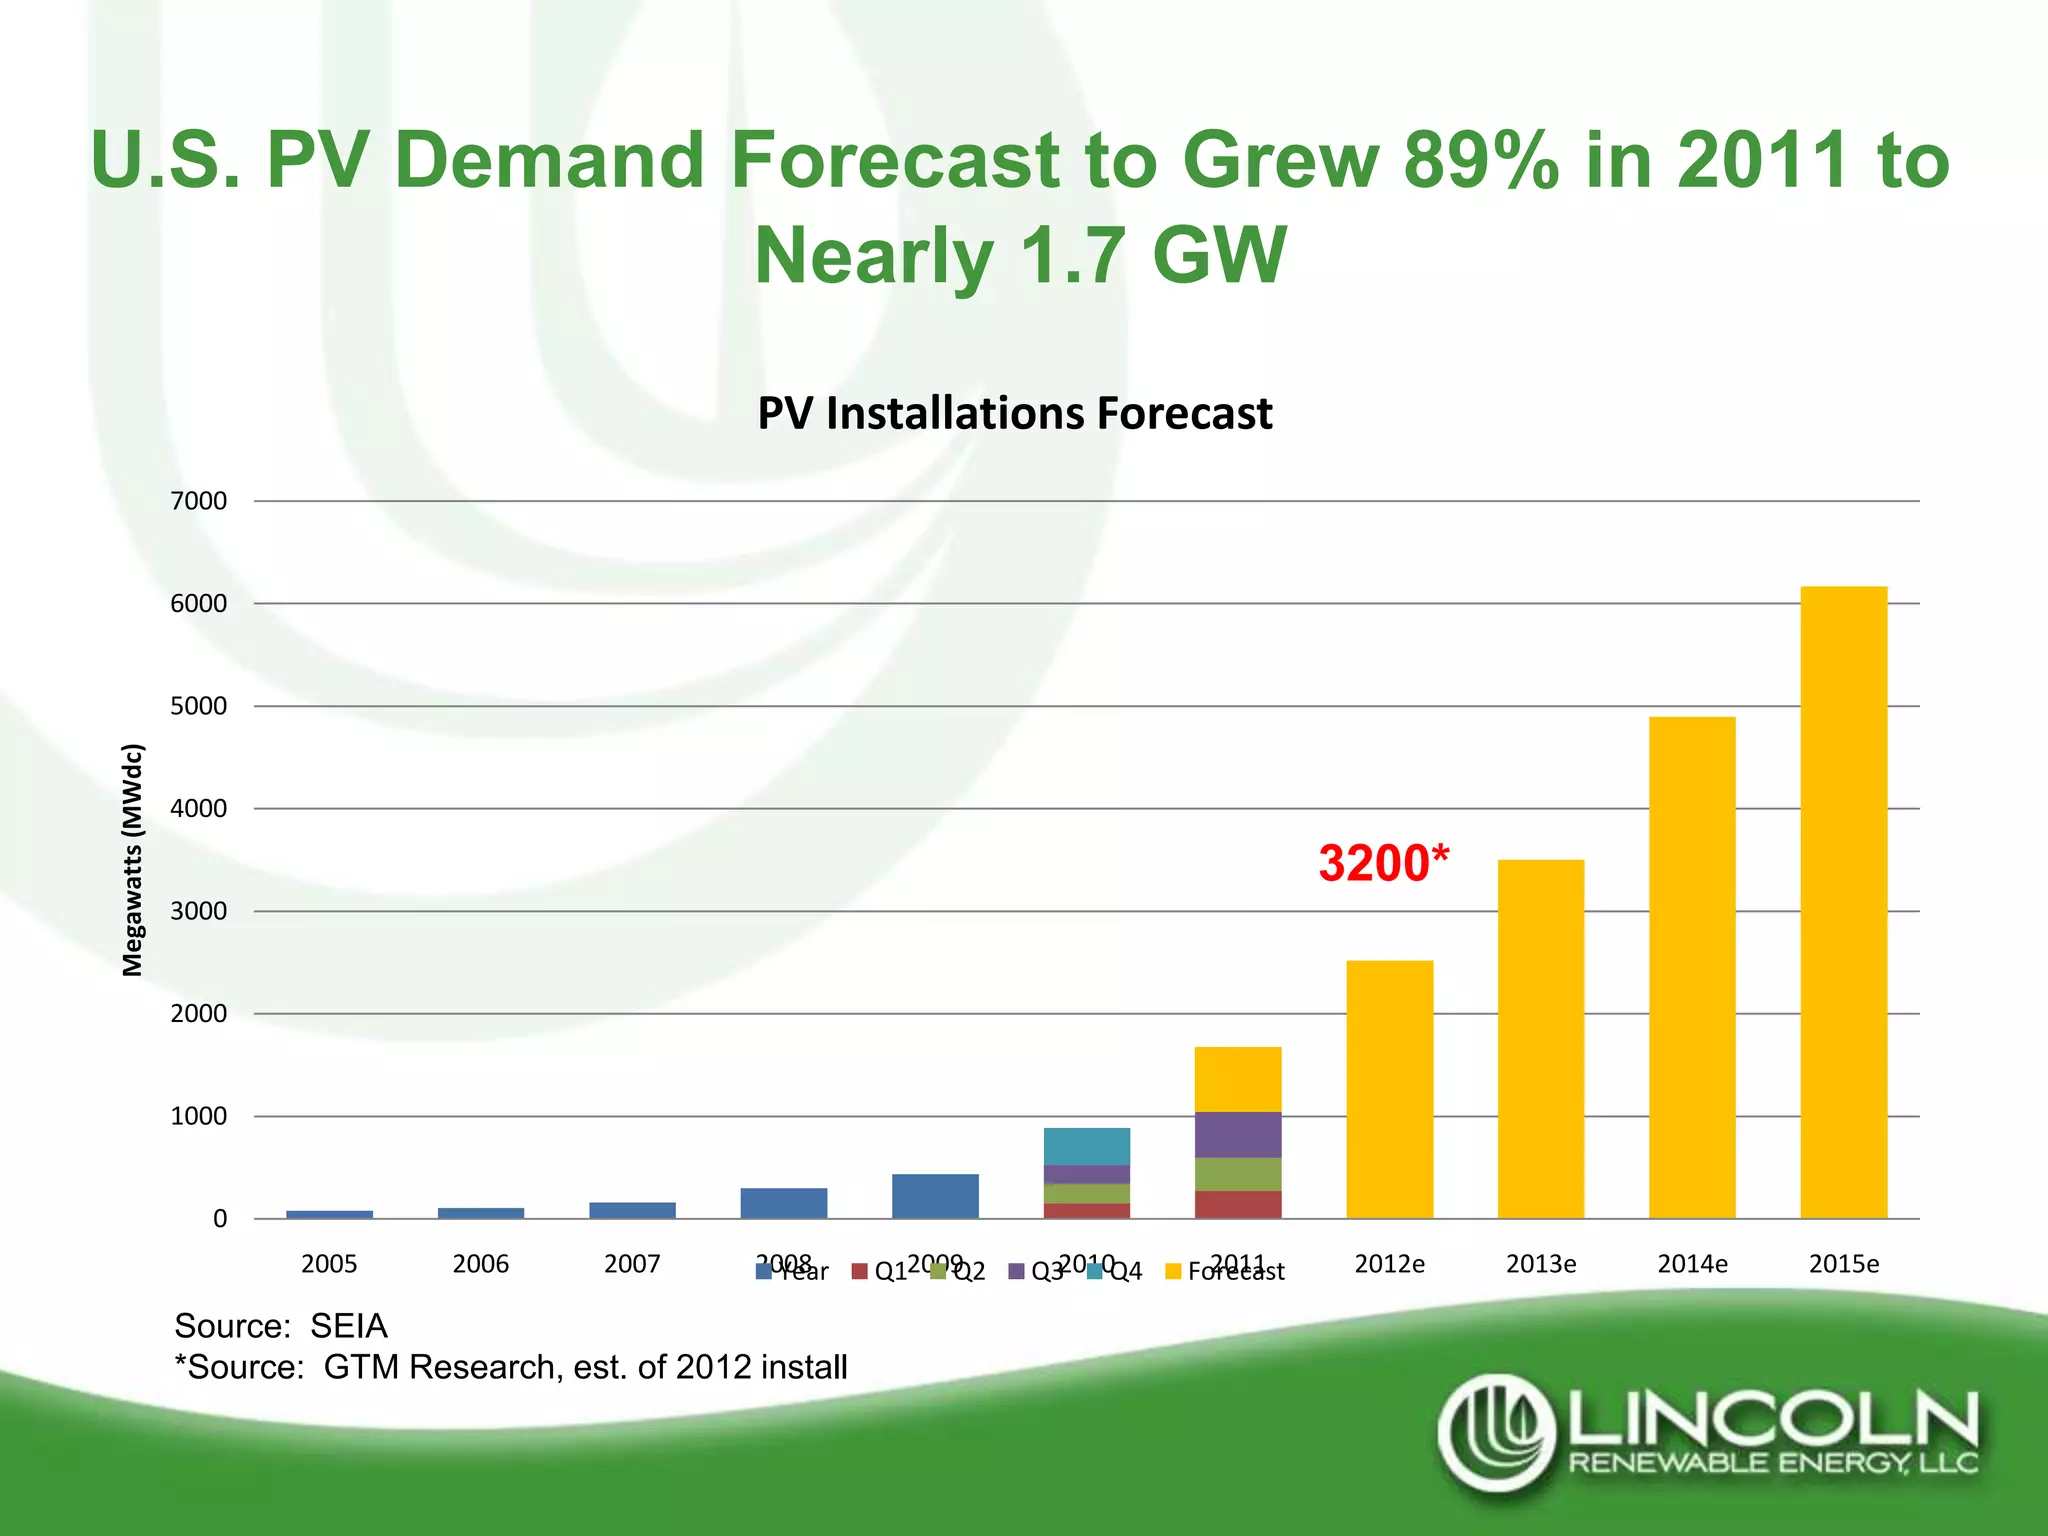
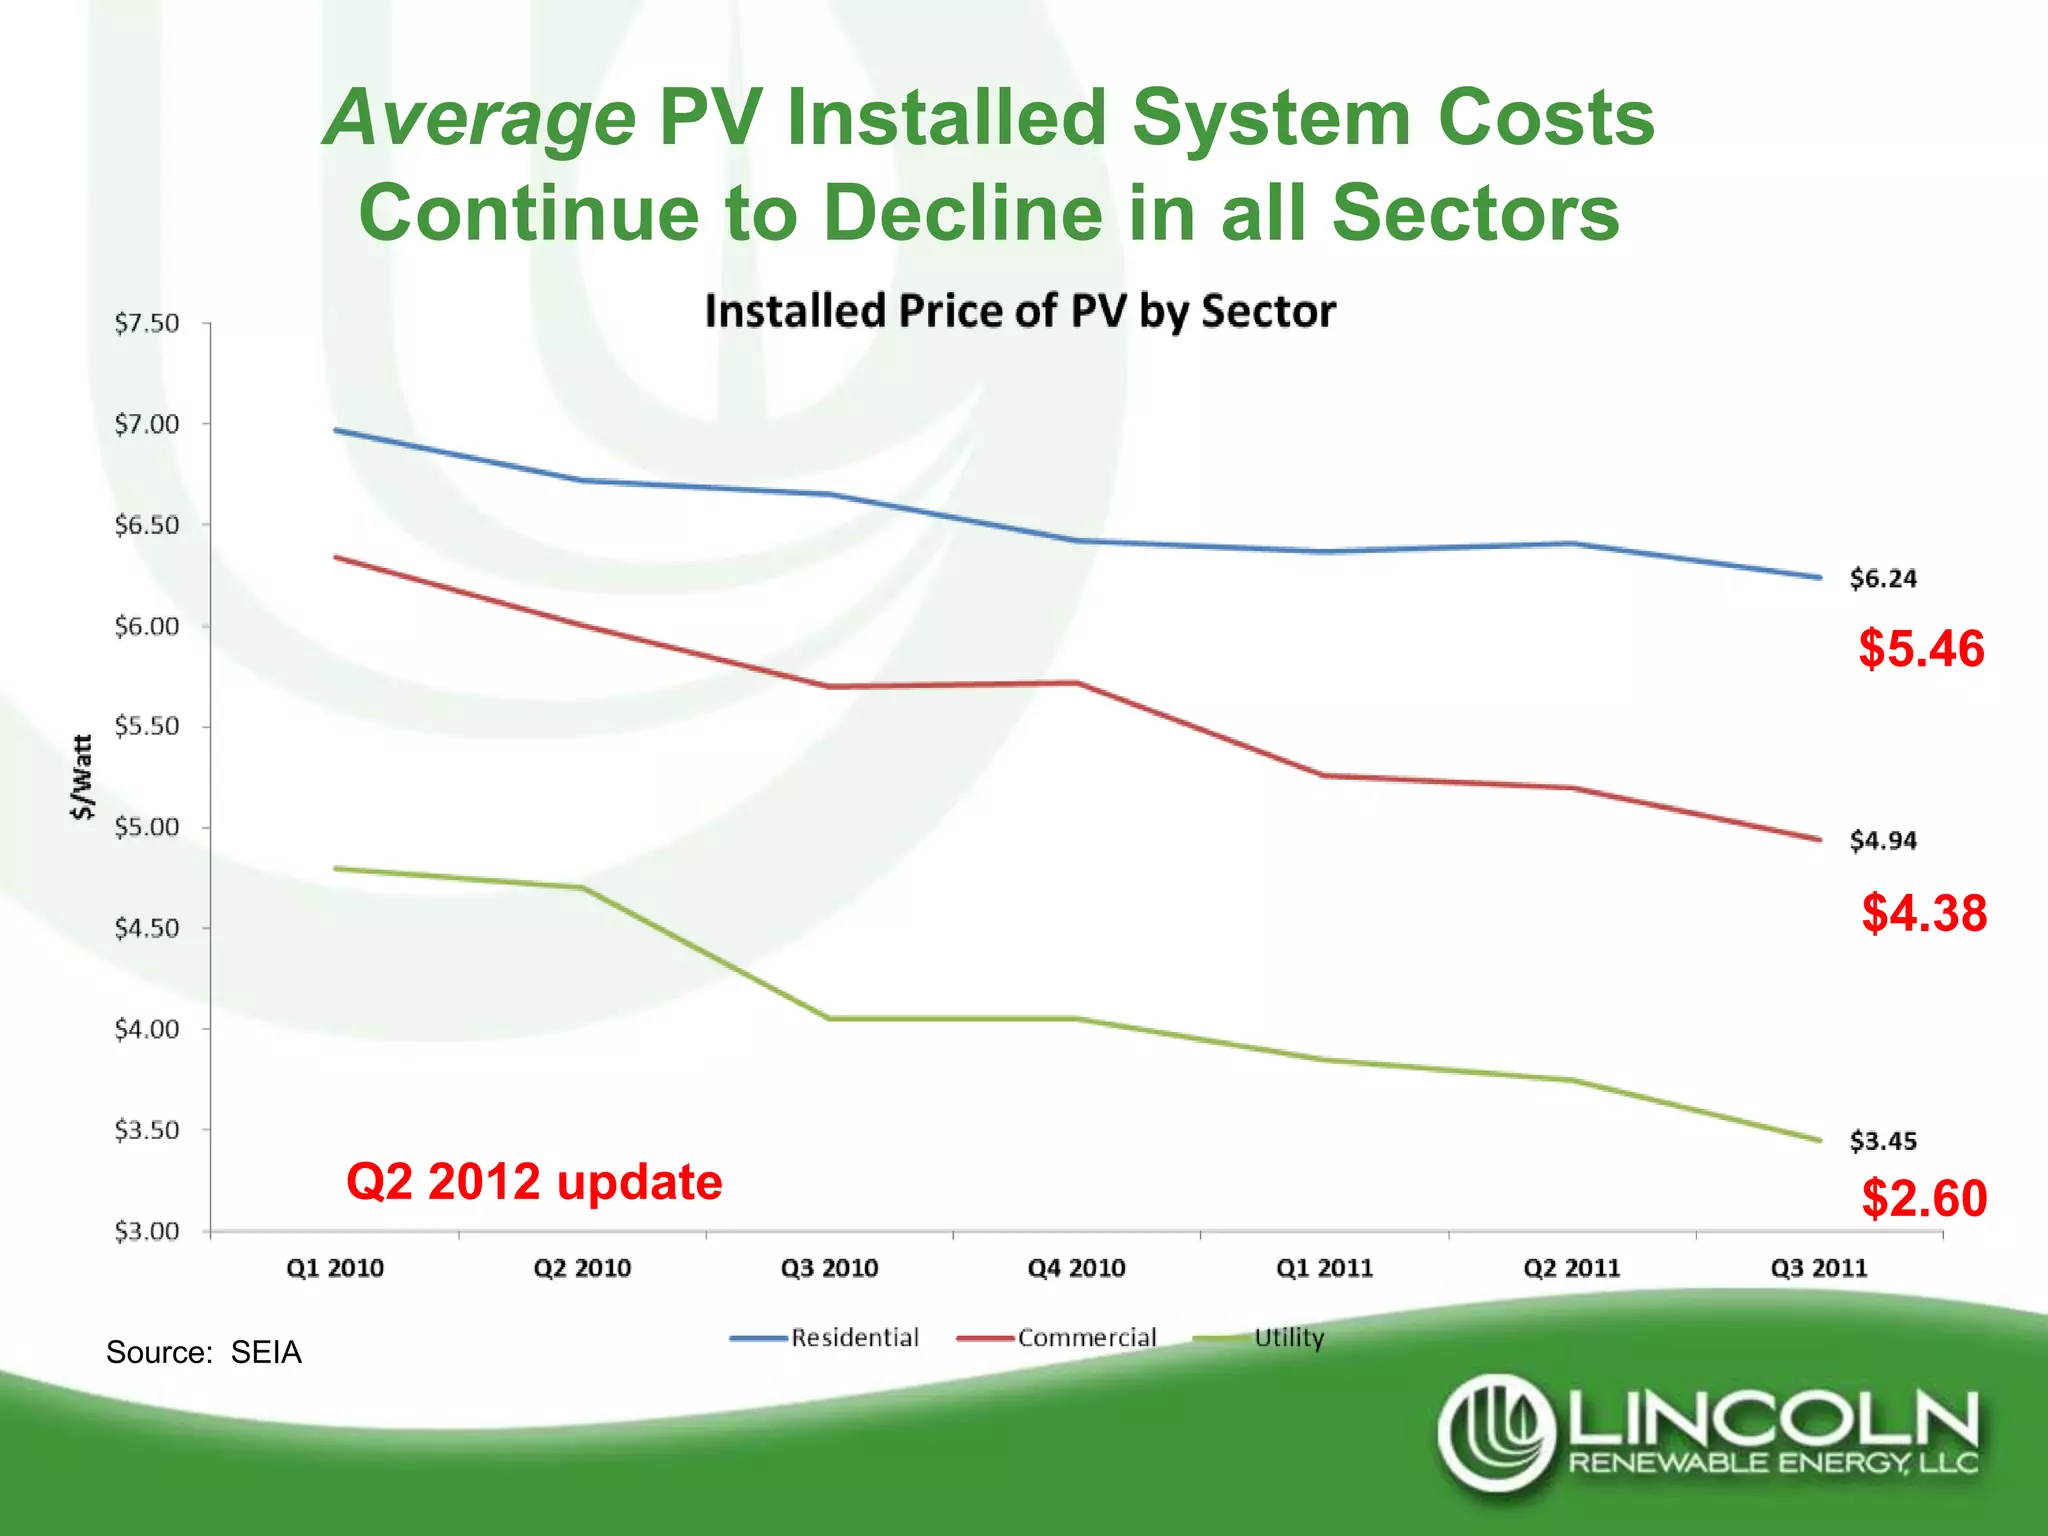
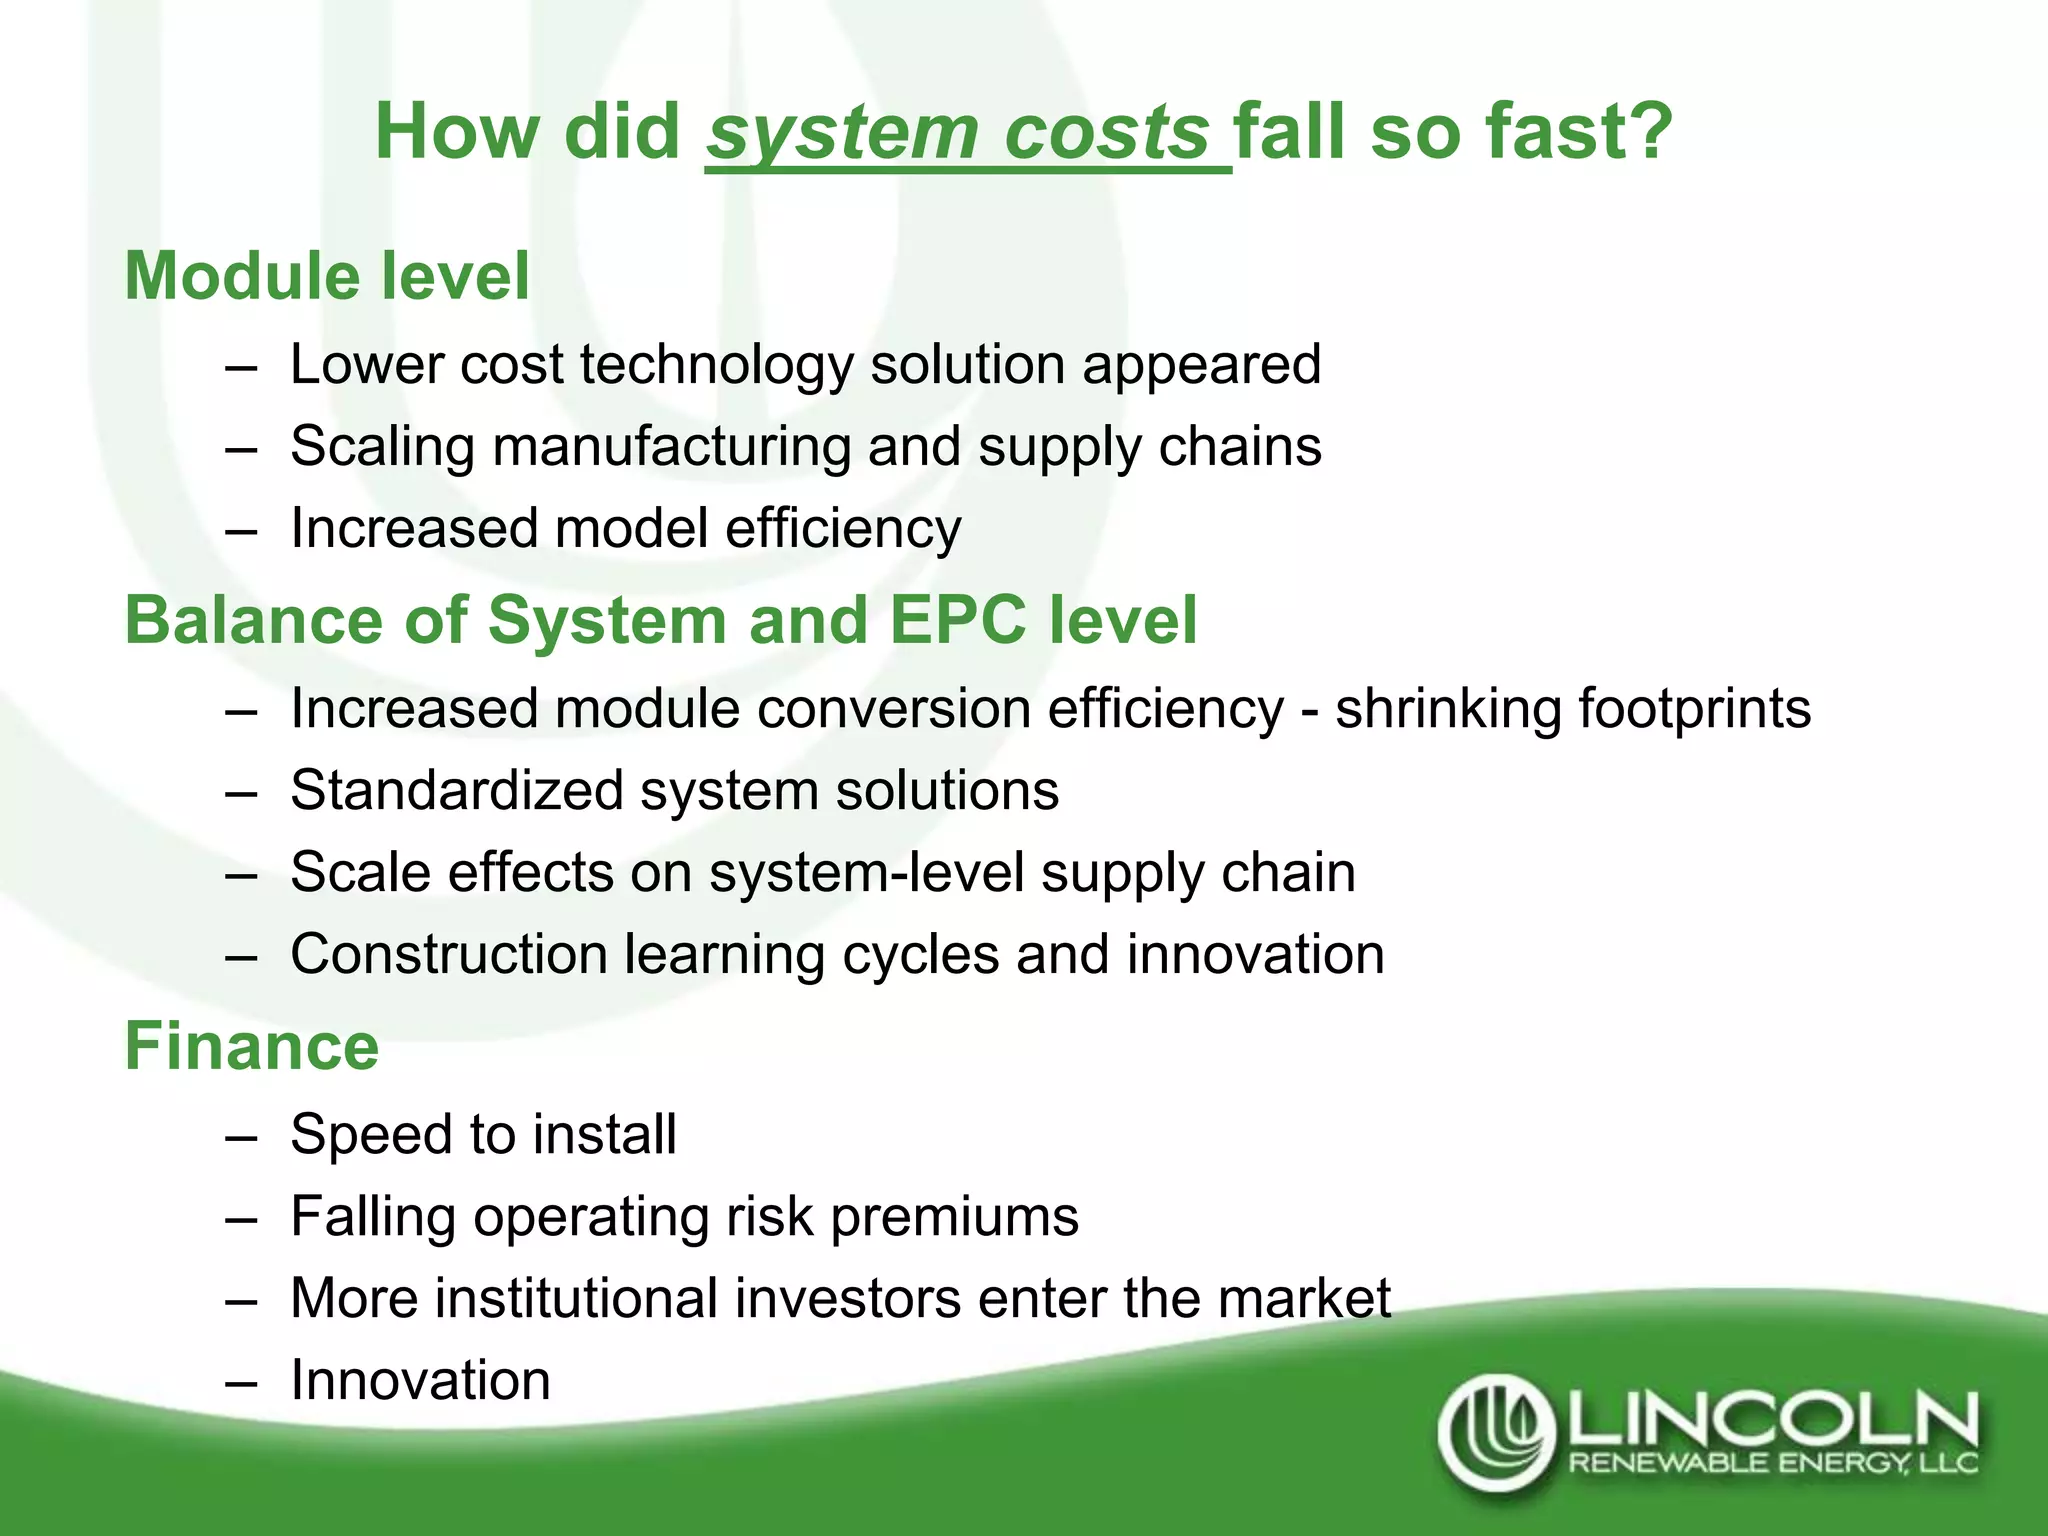
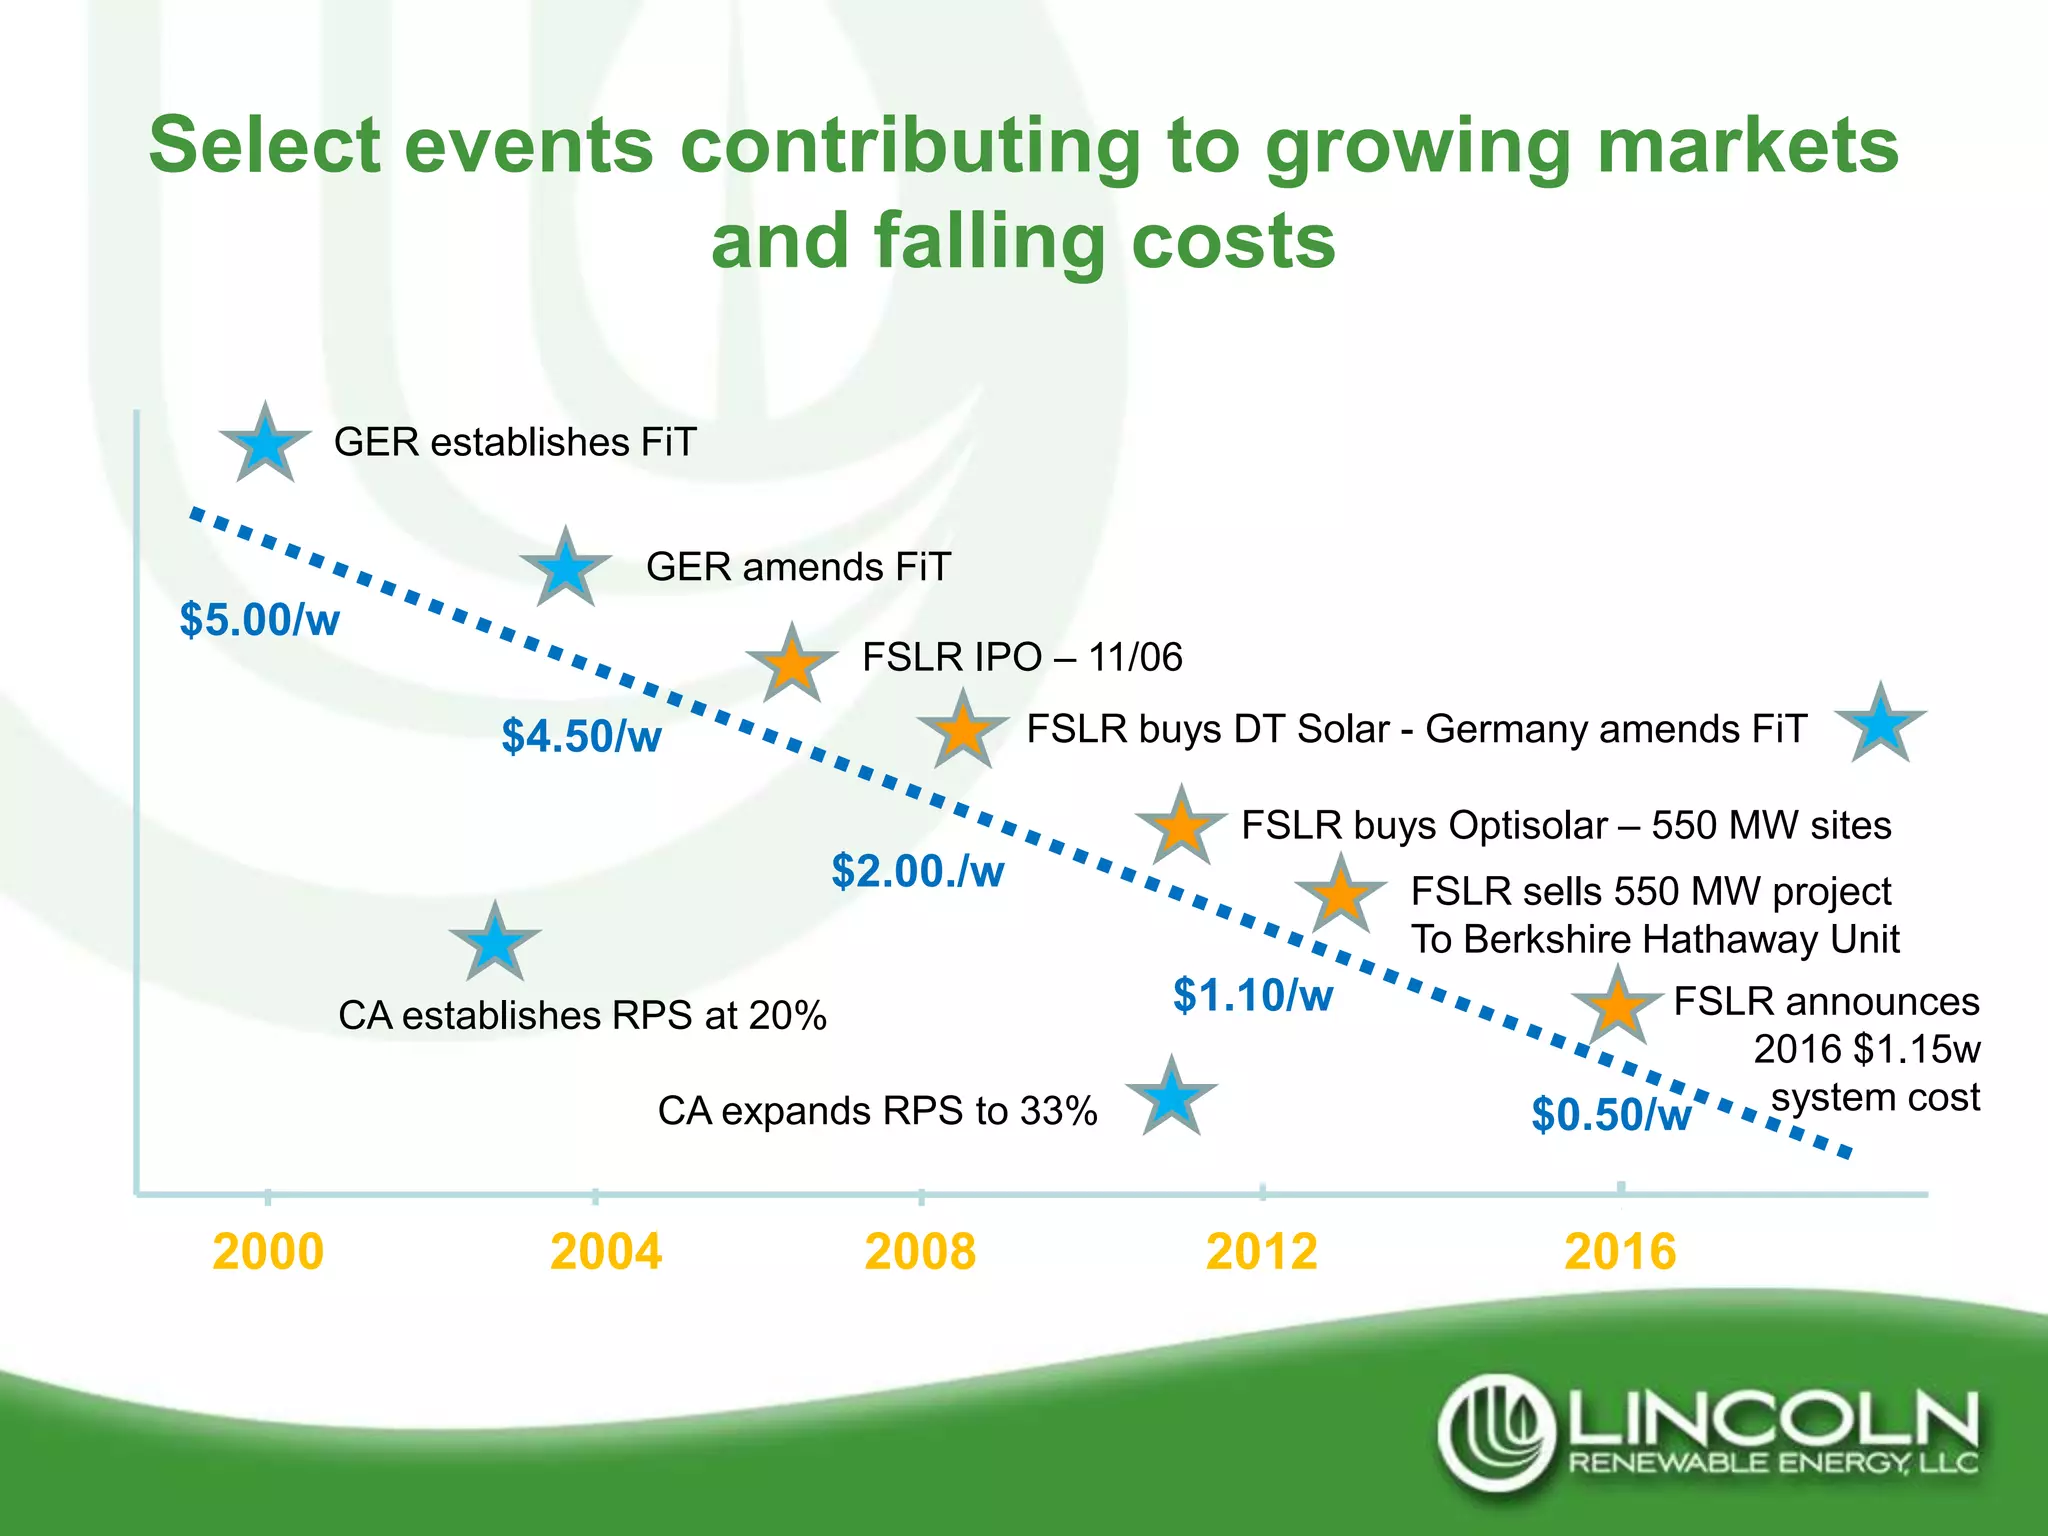
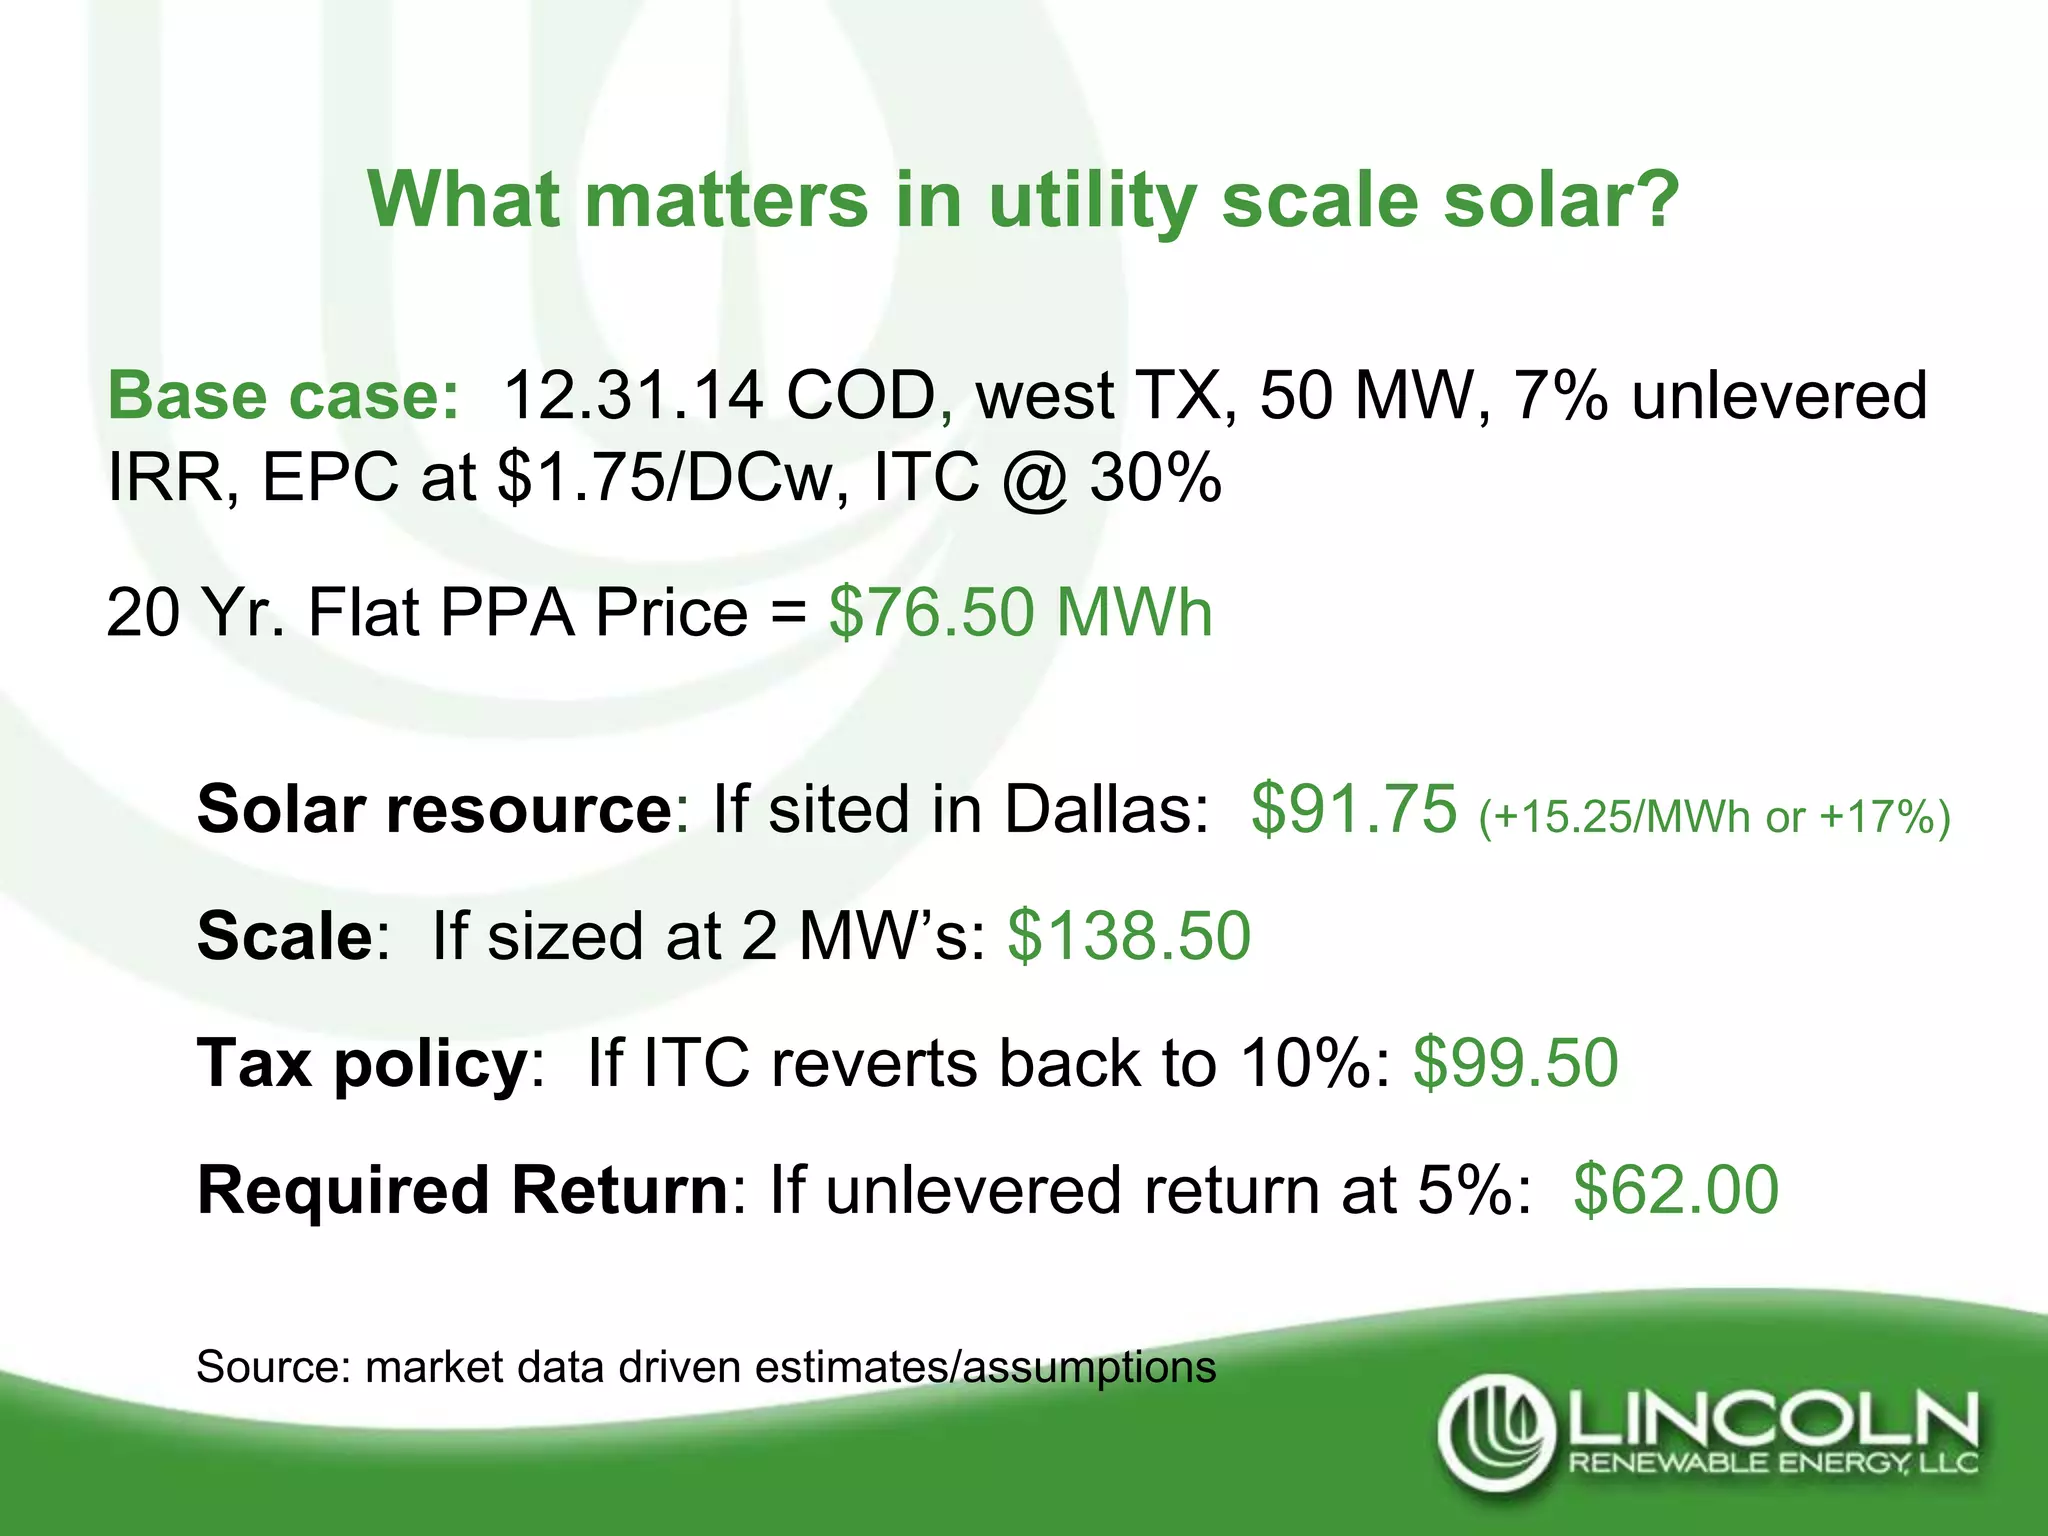
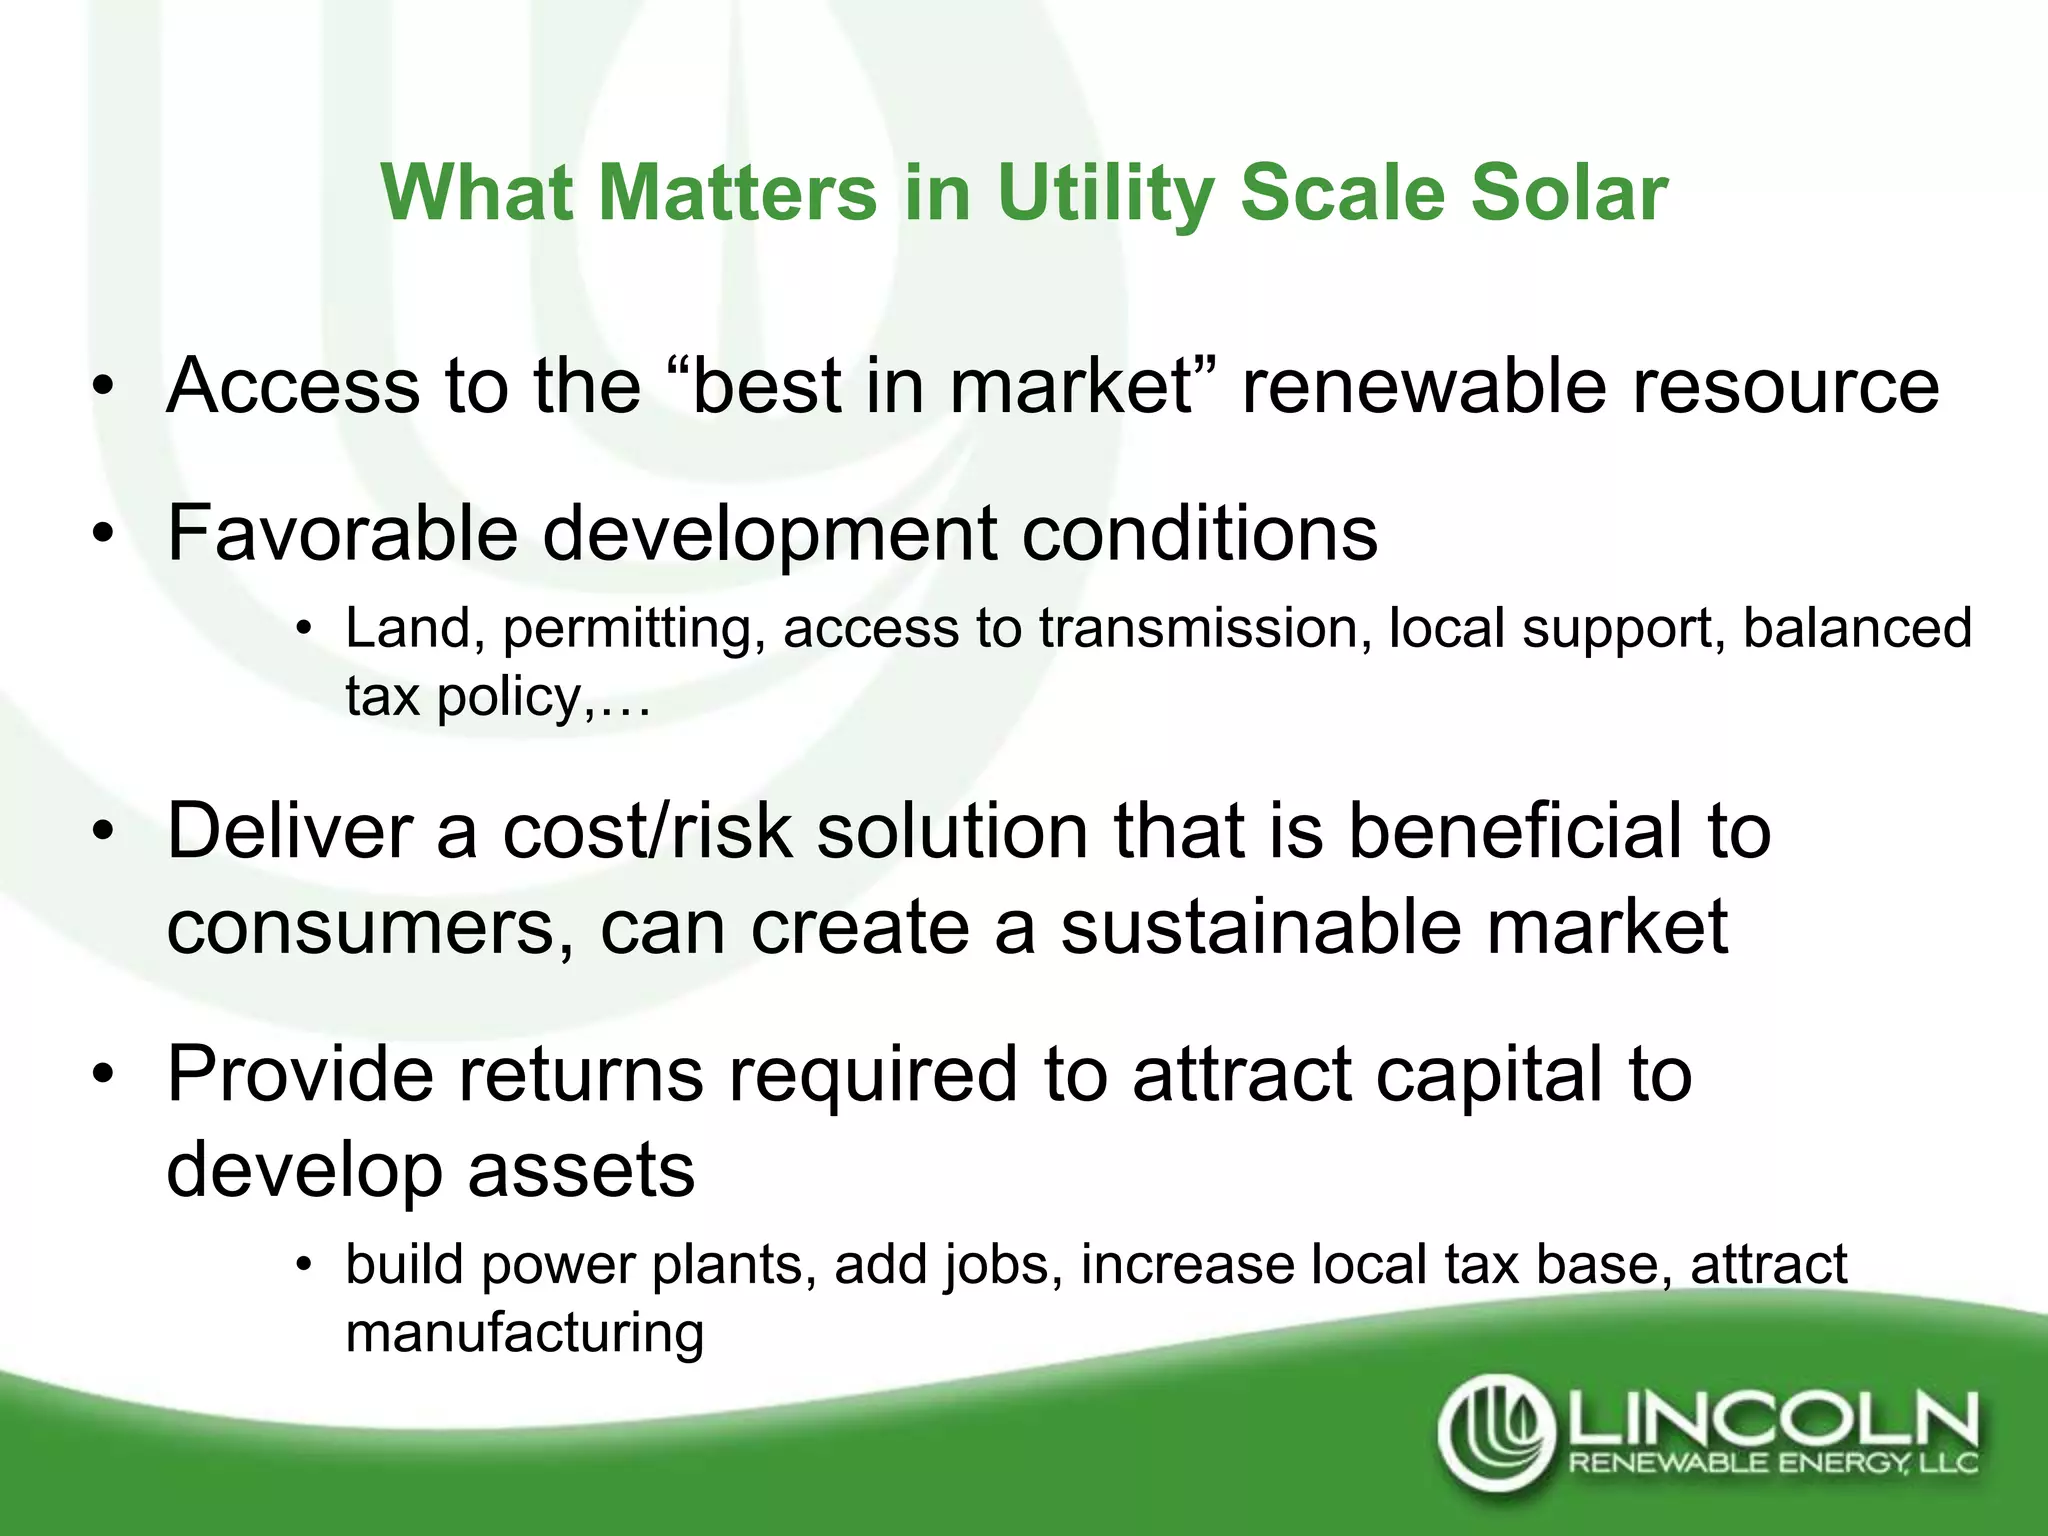
Bringing Low Cost/High Value Solar
    Energy to All Texas Consumers
Richard Gruber, Senior Vice President
Lincoln Renewable Energy
October, 17, 2012
Lincoln Renewable Energy
• U.S. based developer of utility scale solar PV and wind projects across
  the United States. Offices in Austin, Chicago, and Denver.

• Highly experienced management team with deep experience (3000 +
  MW’s) in renewable energy development: Greenfield development to
  project acquisition, project finance, power sales, construction and
  operation.

• Recently completed development and construction of NJ Oak Solar, a 10
  megawatt solar project in Southern New Jersey.

• Monument Power, LLC - 50/50 joint venture between Samsung C&T and
  LRE, entered into March 2012.
Trends – Falling Costs, Evolving Role

• Annual solar MW’s installed is accelerating
• Technology advances and scale have rapidly
  driven system costs lower
  – PV efficiency advancements
  – Supply chains continue to mature
  – System level standardization/optimization
• Utility scale solar PV a viable competitor to more
  established technologies – thought “impossible” 5
  years ago
• Policy drivers and constraints
U.S. PV Demand Forecast to Grew 89% in 2011 to
               Nearly 1.7 GW
                                                        PV Installations Forecast
                   7000


                   6000


                   5000
Megawatts (MWdc)


                   4000

                                                                                                 3200*
                   3000


                   2000


                   1000


                      0
                           2005     2006      2007      2008
                                                          Year   Q12009
                                                                      Q2   Q32010Q4     2011
                                                                                      Forecast    2012e   2013e   2014e   2015e

                   Source: SEIA
                   *Source: GTM Research, est. of 2012 install
Average PV Installed System Costs
                Continue to Decline in all Sectors


                                                     $5.46


                                                     $4.38


               Q2 2012 update                        $2.60

Source: SEIA
How did system costs fall so fast?
Module level
   – Lower cost technology solution appeared
   – Scaling manufacturing and supply chains
   – Increased model efficiency
Balance of System and EPC level
   –   Increased module conversion efficiency - shrinking footprints
   –   Standardized system solutions
   –   Scale effects on system-level supply chain
   –   Construction learning cycles and innovation
Finance
   –   Speed to install
   –   Falling operating risk premiums
   –   More institutional investors enter the market
   –   Innovation
Select events contributing to growing markets
               and falling costs

        GER establishes FiT


                        GER amends FiT
$5.00/w
                                     FSLR IPO – 11/06

                $4.50/w                        FSLR buys DT Solar - Germany amends FiT

                                                         FSLR buys Optisolar – 550 MW sites
                                    $2.00./w                      FSLR sells 550 MW project
                                                                  To Berkshire Hathaway Unit
        CA establishes RPS at 20%                     $1.10/w                 FSLR announces
                                                                                 2016 $1.15w
                        CA expands RPS to 33%                           $0.50/w   system cost


 2000              2004              2008               2012              2016
What matters in utility scale solar?

Base case: 12.31.14 COD, west TX, 50 MW, 7% unlevered
IRR, EPC at $1.75/DCw, ITC @ 30%
20 Yr. Flat PPA Price = $76.50 MWh

  Solar resource: If sited in Dallas: $91.75 (+15.25/MWh or +17%)
  Scale: If sized at 2 MW’s: $138.50
  Tax policy: If ITC reverts back to 10%: $99.50
  Required Return: If unlevered return at 5%: $62.00

  Source: market data driven estimates/assumptions
What Matters in Utility Scale Solar

• Access to the “best in market” renewable resource
• Favorable development conditions
      • Land, permitting, access to transmission, local support, balanced
        tax policy,…

• Deliver a cost/risk solution that is beneficial to
  consumers, can create a sustainable market
• Provide returns required to attract capital to
  develop assets
      • build power plants, add jobs, increase local tax base, attract
        manufacturing
Property Value Analysis


         Thank you

          Questions


10

2012 Reenergize the Americas 1A: Richard Gruber

  • 1.
    Bringing Low Cost/HighValue Solar Energy to All Texas Consumers Richard Gruber, Senior Vice President Lincoln Renewable Energy October, 17, 2012
  • 2.
    Lincoln Renewable Energy •U.S. based developer of utility scale solar PV and wind projects across the United States. Offices in Austin, Chicago, and Denver. • Highly experienced management team with deep experience (3000 + MW’s) in renewable energy development: Greenfield development to project acquisition, project finance, power sales, construction and operation. • Recently completed development and construction of NJ Oak Solar, a 10 megawatt solar project in Southern New Jersey. • Monument Power, LLC - 50/50 joint venture between Samsung C&T and LRE, entered into March 2012.
  • 3.
    Trends – FallingCosts, Evolving Role • Annual solar MW’s installed is accelerating • Technology advances and scale have rapidly driven system costs lower – PV efficiency advancements – Supply chains continue to mature – System level standardization/optimization • Utility scale solar PV a viable competitor to more established technologies – thought “impossible” 5 years ago • Policy drivers and constraints
  • 4.
    U.S. PV DemandForecast to Grew 89% in 2011 to Nearly 1.7 GW PV Installations Forecast 7000 6000 5000 Megawatts (MWdc) 4000 3200* 3000 2000 1000 0 2005 2006 2007 2008 Year Q12009 Q2 Q32010Q4 2011 Forecast 2012e 2013e 2014e 2015e Source: SEIA *Source: GTM Research, est. of 2012 install
  • 5.
    Average PV InstalledSystem Costs Continue to Decline in all Sectors $5.46 $4.38 Q2 2012 update $2.60 Source: SEIA
  • 6.
    How did systemcosts fall so fast? Module level – Lower cost technology solution appeared – Scaling manufacturing and supply chains – Increased model efficiency Balance of System and EPC level – Increased module conversion efficiency - shrinking footprints – Standardized system solutions – Scale effects on system-level supply chain – Construction learning cycles and innovation Finance – Speed to install – Falling operating risk premiums – More institutional investors enter the market – Innovation
  • 7.
    Select events contributingto growing markets and falling costs GER establishes FiT GER amends FiT $5.00/w FSLR IPO – 11/06 $4.50/w FSLR buys DT Solar - Germany amends FiT FSLR buys Optisolar – 550 MW sites $2.00./w FSLR sells 550 MW project To Berkshire Hathaway Unit CA establishes RPS at 20% $1.10/w FSLR announces 2016 $1.15w CA expands RPS to 33% $0.50/w system cost 2000 2004 2008 2012 2016
  • 8.
    What matters inutility scale solar? Base case: 12.31.14 COD, west TX, 50 MW, 7% unlevered IRR, EPC at $1.75/DCw, ITC @ 30% 20 Yr. Flat PPA Price = $76.50 MWh Solar resource: If sited in Dallas: $91.75 (+15.25/MWh or +17%) Scale: If sized at 2 MW’s: $138.50 Tax policy: If ITC reverts back to 10%: $99.50 Required Return: If unlevered return at 5%: $62.00 Source: market data driven estimates/assumptions
  • 9.
    What Matters inUtility Scale Solar • Access to the “best in market” renewable resource • Favorable development conditions • Land, permitting, access to transmission, local support, balanced tax policy,… • Deliver a cost/risk solution that is beneficial to consumers, can create a sustainable market • Provide returns required to attract capital to develop assets • build power plants, add jobs, increase local tax base, attract manufacturing
  • 10.
    Property Value Analysis Thank you Questions 10