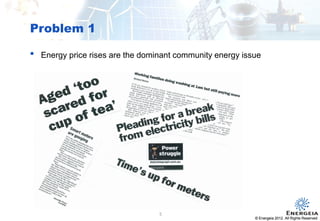
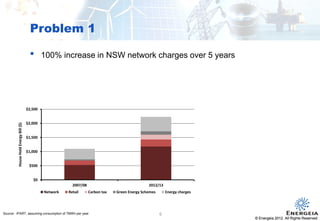
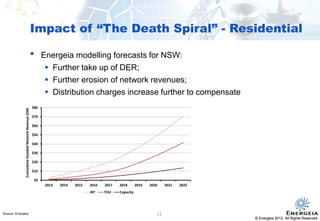
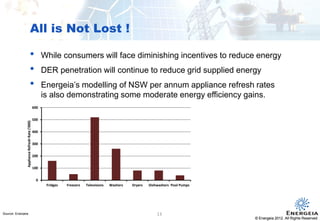
© Energeia 2012. All Rights ReservedConfidentialConfidential
Could a Greater Emphasis on Demand
Management Hinder Future Energy Efficiency
Initiatives?
Terry Daly – Practice Leader, Energeia
February 2013
© Energeia 2012. All Rights Reserved
1
© Energeia 2012. All Rights ReservedConfidential
• Focused on supporting clients tackling the industry’s greatest challenges
and opportunities:
 Australia’s only real-time demand response system (King Island)
 15-20 year Customer, Network and Organisation of the Future visions
 Market outlooks emerging energy technology, e.g. solar PV, microgrids
 Energy services growth and margin strategies
 High margin smart meter enabled products and services
• Proprietary research enabled insights and advisory services
 Electric vehicles, storage, renewables, energy efficiency, demand
response, smart grids, cogeneration (CHP)
Who Are These Guys?
© Energeia 2012. All Rights Reserved
2
© Energeia 2012. All Rights ReservedConfidential
Overview
© Energeia 2012. All Rights Reserved
• Australian policy development
• Four key problems facing the electricity market
• Solution being considered
• Impact on energy efficiency
• All is not lost!
3
© Energeia 2012. All Rights ReservedConfidential
• The key Australian developments over the past 18 months
include:
 The National Energy Savings Initiative (NESI) maps out
2020 energy efficiency target
 Victorian VEEC
 Freedom of Choice Review (DSP3) kicks off AEMC’s
third demand side participation review
 Government investigation of mandating the DRED
standard
 AEMC Power of Choice
 Productivity Commission report
 Senate Committee on Electricity Pricing
Australian Policy Developments
© Energeia 2012. All Rights Reserved
Energy
Efficiency
Pricing
Demand
Management
4
© Energeia 2012. All Rights ReservedConfidential
Problem 1
© Energeia 2012. All Rights Reserved
• Energy price rises are the dominant community energy issue
5
© Energeia 2012. All Rights ReservedConfidential
Problem 1
© Energeia 2012. All Rights Reserved
Source: IPART, assuming consumption of 7MWh per year
• 100% increase in NSW network charges over 5 years
6
$0
$500
$1,000
$1,500
$2,000
$2,500
2007/08 2012/13
HouseHoldEnergyBill($)
Network Retail Carbon tax Green Energy Schemes Energy charges
© Energeia 2012. All Rights ReservedConfidential
Problem 2
Confidential © Energeia 2012. All Rights Reserved
Source: Ausgrid
• The divergence between demand and energy growth is
expected to continue
7
0%
2%
4%
6%
8%
10%
12%
14%
16%
2004 2005 2006 2007 2008 2009 2010 2011
CumulativeIncreaseince2004
Underlying Energy Weather Corrected Peak Demand
© Energeia 2012. All Rights ReservedConfidential
Problem 3
Confidential © Energeia 2012. All Rights Reserved
Source: Energeia
• Forecast take-up of distributed energy resources (DER) will exacerbate
problem 2
• Depending on pricing, small scale PV and CHP costs are becoming
attractive on an LCOE basis
8
0.0
0.1
0.2
0.3
0.4
0.5
0.6
0.7
0.8
2013 2014 2015 2016 2017 2018 2019 2020 2021 2022
$/kWh
PV CHP Mains ToU Peak Mains ToU Off Peak
0.0
0.1
0.2
0.3
0.4
0.5
0.6
0.7
0.8
2013 2014 2015 2016 2017 2018 2019 2020 2021 2022
$/kWh
PV CHP Mains ToU Peak Mains ToU Off Peak
© Energeia 2012. All Rights ReservedConfidential
Problem 3
Confidential © Energeia 2012. All Rights Reserved
Source: UBS 2013
• Not unique to Australia
• UBS forecast for the price of retail prices versus DER for residential
customers in Germany
9
© Energeia 2012. All Rights ReservedConfidential
Problem 4
Confidential © Energeia 2012. All Rights Reserved
Source: Simshauser and Nelson 2012
• DNSP’s load factors continue to decline. For example in SA load
factor declined by 33% from the early 2000’s to 2011.
• As revenues for DNSP’s decline, network charges must rise further
to compensate
• This has been termed “The Energy Market Death Spiral”
10
© Energeia 2012. All Rights ReservedConfidential
Impact of “The Death Spiral” - Residential
Confidential © Energeia 2012. All Rights Reserved
Source: Energeia 11
• Energeia modelling forecasts for NSW:
 Further take up of DER;
 Further erosion of network revenues;
 Distribution charges increase further to compensate
$0
$10
$20
$30
$40
$50
$60
$70
$80
2013 2014 2015 2016 2017 2018 2019 2020 2021 2022
CumulativeAvoidedNetworkRevenue($M)
IBT TOU Capacity
© Energeia 2012. All Rights ReservedConfidential
The Proposed Industry Solution
© Energeia 2012. All Rights Reserved
• Customers have much less incentive to reduce energy
consumption – only demand !
The impact being
12
• Time based pricing is being discussed; but
• Capacity based pricing is rapidly being recognised as the only
sustainable solution to maintain network revenues and stop cross-
subsidies
12
© Energeia 2012. All Rights ReservedConfidential
All is Not Lost !
© Energeia 2012. All Rights Reserved
Source: Energeia
• While consumers will face diminishing incentives to reduce energy
• DER penetration will continue to reduce grid supplied energy
• Energeia’s modelling of NSW per annum appliance refresh rates
is also demonstrating some moderate energy efficiency gains.
13
0
100
200
300
400
500
600
Fridges Freezers Televisions Washers Dryers Dishwashers Pool Pumps
ApplianceRefreshRate('000)
© Energeia 2012. All Rights ReservedConfidentialConfidential
Thank You
Energeia
L20 Tower 2, 201 Sussex Street, Sydney NSW 2000, Australia
P +612 9006 1550 F +612 9006 1010 E tdaly@energeia.com.au
W www.energeia.com.au
© Energeia 2012. All Rights Reserved
14

Summer Study EE 120318

  • 1.
    © Energeia 2012.All Rights ReservedConfidentialConfidential Could a Greater Emphasis on Demand Management Hinder Future Energy Efficiency Initiatives? Terry Daly – Practice Leader, Energeia February 2013 © Energeia 2012. All Rights Reserved 1
  • 2.
    © Energeia 2012.All Rights ReservedConfidential • Focused on supporting clients tackling the industry’s greatest challenges and opportunities:  Australia’s only real-time demand response system (King Island)  15-20 year Customer, Network and Organisation of the Future visions  Market outlooks emerging energy technology, e.g. solar PV, microgrids  Energy services growth and margin strategies  High margin smart meter enabled products and services • Proprietary research enabled insights and advisory services  Electric vehicles, storage, renewables, energy efficiency, demand response, smart grids, cogeneration (CHP) Who Are These Guys? © Energeia 2012. All Rights Reserved 2
  • 3.
    © Energeia 2012.All Rights ReservedConfidential Overview © Energeia 2012. All Rights Reserved • Australian policy development • Four key problems facing the electricity market • Solution being considered • Impact on energy efficiency • All is not lost! 3
  • 4.
    © Energeia 2012.All Rights ReservedConfidential • The key Australian developments over the past 18 months include:  The National Energy Savings Initiative (NESI) maps out 2020 energy efficiency target  Victorian VEEC  Freedom of Choice Review (DSP3) kicks off AEMC’s third demand side participation review  Government investigation of mandating the DRED standard  AEMC Power of Choice  Productivity Commission report  Senate Committee on Electricity Pricing Australian Policy Developments © Energeia 2012. All Rights Reserved Energy Efficiency Pricing Demand Management 4
  • 5.
    © Energeia 2012.All Rights ReservedConfidential Problem 1 © Energeia 2012. All Rights Reserved • Energy price rises are the dominant community energy issue 5
  • 6.
    © Energeia 2012.All Rights ReservedConfidential Problem 1 © Energeia 2012. All Rights Reserved Source: IPART, assuming consumption of 7MWh per year • 100% increase in NSW network charges over 5 years 6 $0 $500 $1,000 $1,500 $2,000 $2,500 2007/08 2012/13 HouseHoldEnergyBill($) Network Retail Carbon tax Green Energy Schemes Energy charges
  • 7.
    © Energeia 2012.All Rights ReservedConfidential Problem 2 Confidential © Energeia 2012. All Rights Reserved Source: Ausgrid • The divergence between demand and energy growth is expected to continue 7 0% 2% 4% 6% 8% 10% 12% 14% 16% 2004 2005 2006 2007 2008 2009 2010 2011 CumulativeIncreaseince2004 Underlying Energy Weather Corrected Peak Demand
  • 8.
    © Energeia 2012.All Rights ReservedConfidential Problem 3 Confidential © Energeia 2012. All Rights Reserved Source: Energeia • Forecast take-up of distributed energy resources (DER) will exacerbate problem 2 • Depending on pricing, small scale PV and CHP costs are becoming attractive on an LCOE basis 8 0.0 0.1 0.2 0.3 0.4 0.5 0.6 0.7 0.8 2013 2014 2015 2016 2017 2018 2019 2020 2021 2022 $/kWh PV CHP Mains ToU Peak Mains ToU Off Peak 0.0 0.1 0.2 0.3 0.4 0.5 0.6 0.7 0.8 2013 2014 2015 2016 2017 2018 2019 2020 2021 2022 $/kWh PV CHP Mains ToU Peak Mains ToU Off Peak
  • 9.
    © Energeia 2012.All Rights ReservedConfidential Problem 3 Confidential © Energeia 2012. All Rights Reserved Source: UBS 2013 • Not unique to Australia • UBS forecast for the price of retail prices versus DER for residential customers in Germany 9
  • 10.
    © Energeia 2012.All Rights ReservedConfidential Problem 4 Confidential © Energeia 2012. All Rights Reserved Source: Simshauser and Nelson 2012 • DNSP’s load factors continue to decline. For example in SA load factor declined by 33% from the early 2000’s to 2011. • As revenues for DNSP’s decline, network charges must rise further to compensate • This has been termed “The Energy Market Death Spiral” 10
  • 11.
    © Energeia 2012.All Rights ReservedConfidential Impact of “The Death Spiral” - Residential Confidential © Energeia 2012. All Rights Reserved Source: Energeia 11 • Energeia modelling forecasts for NSW:  Further take up of DER;  Further erosion of network revenues;  Distribution charges increase further to compensate $0 $10 $20 $30 $40 $50 $60 $70 $80 2013 2014 2015 2016 2017 2018 2019 2020 2021 2022 CumulativeAvoidedNetworkRevenue($M) IBT TOU Capacity
  • 12.
    © Energeia 2012.All Rights ReservedConfidential The Proposed Industry Solution © Energeia 2012. All Rights Reserved • Customers have much less incentive to reduce energy consumption – only demand ! The impact being 12 • Time based pricing is being discussed; but • Capacity based pricing is rapidly being recognised as the only sustainable solution to maintain network revenues and stop cross- subsidies 12
  • 13.
    © Energeia 2012.All Rights ReservedConfidential All is Not Lost ! © Energeia 2012. All Rights Reserved Source: Energeia • While consumers will face diminishing incentives to reduce energy • DER penetration will continue to reduce grid supplied energy • Energeia’s modelling of NSW per annum appliance refresh rates is also demonstrating some moderate energy efficiency gains. 13 0 100 200 300 400 500 600 Fridges Freezers Televisions Washers Dryers Dishwashers Pool Pumps ApplianceRefreshRate('000)
  • 14.
    © Energeia 2012.All Rights ReservedConfidentialConfidential Thank You Energeia L20 Tower 2, 201 Sussex Street, Sydney NSW 2000, Australia P +612 9006 1550 F +612 9006 1010 E tdaly@energeia.com.au W www.energeia.com.au © Energeia 2012. All Rights Reserved 14