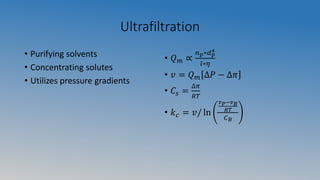
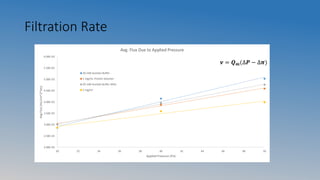
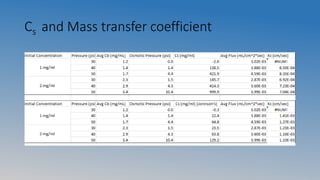
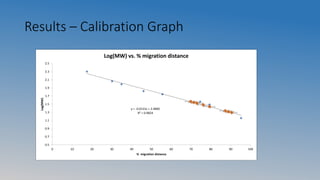
Ultrafiltration and Gel
Electrophoresis
Rashid Alsuwaidi
Ahmed Alhazeem
Matt Liu
Wanying Chia
Ultrafiltration
Goals
• Understanding the principles and parameters involved in membrane
separations
• Asses the roles of osmotic pressure and membrane fouling on
membrane flux decline
• Determine relevant solute mass transfer coefficients in membrane
filtration process
Ultrafiltration
• Purifying solvents
• Concentrating solutes
• Utilizes pressure gradients
• 𝑄 𝑚 ∝
𝑛 𝑝∗𝑑 𝑝
4
𝑙∗𝜂
• 𝑣 = 𝑄 𝑚 ∆𝑃 − ∆𝜋
• 𝐶𝑠 =
∆𝜋
𝑅𝑇
• 𝑘 𝑐 = 𝑣/ ln
𝑣 𝑃−𝑣 𝐵
𝑅𝑇
𝐶 𝐵
Experiment
• 20 mM Acetate Buffer
• 1 mg/mL porcine pepsin
• 2 mg/mL porcine pepsin
Filtration Rate
2.00E-03
2.50E-03
3.00E-03
3.50E-03
4.00E-03
4.50E-03
5.00E-03
5.50E-03
6.00E-03
30 32 34 36 38 40 42 44 46 48 50
AvgFlux(mL/cm^2*sec)
Applied Pressure (Psi)
Avg. Flux Due to Applied Pressure
20 mM Acetate Buffer
1 mg/mL Protein Solution
20 mM Acetate Buffer After
2 mg/ml
𝝂 = 𝑸 𝒎(∆𝑷 − ∆𝝅)
Osmotic Pressure
𝝅 = 𝒄 𝒔 𝑹𝑻
-2.0
0.0
2.0
4.0
6.0
8.0
10.0
12.0
30 32 34 36 38 40 42 44 46 48 50
OsmoticPressureΔπ(psi)
Pressure ΔP (psi)
Osmotic Pressure Over Pressure
1 mg/mL
2 mg/mL
Membrane Clogging?
• Qm (before) = 1.01 x 10⁻⁴ mL/cm2*sec*Psi
• Qm (after) =9.74 x 10⁻⁵ mL/cm2*sec*Psi
• t-test results in p= 0.54
• Therefore Osmotic Pressure is greater
at affecting mass transfer
y = 1.08E-04x - 3.21E-04
R² = 9.88E-01
y = 8.78E-05x + 3.98E-04
R² = 9.98E-01
2.00E-03
2.50E-03
3.00E-03
3.50E-03
4.00E-03
4.50E-03
5.00E-03
5.50E-03
30 35 40 45 50
AvgFlux(mL/cm^2*sec
Pressure (Psi)
Comparison of Permeability Coefficient
Flux Before
Flux After
4.00E-04
6.00E-04
8.00E-04
1.00E-03
1.20E-03
1.40E-03
1.60E-03
30 32 34 36 38 40 42 44 46 48 50
Kc(cm/s)
Pressure (Psi)
Comparison of Kc Values
Ideal 1 mg/mL
Ideal 2 mg/mL Solution
Jonnson 1 mg/ml Solution
Jonnson 2 mg/mL
0.0
100.0
200.0
300.0
400.0
500.0
600.0
700.0
800.0
900.0
1000.0
30 32 34 36 38 40 42 44 46 48 50
Cs(mg/mL)
Pressure (Psi)
Comparison of Solute at Membrane Surface
Ideal 1 mg/mL
Ideal 2 mg/ml
Jonnson 1 mg/ml
Jonnson 2 mg/ml
Cs and Mass transfer coefficient
Conclusions
• Osmotic Pressure has a greater effect on mass transfer coefficient
• Pressure increases mass transfer coefficients as well asProtein
Concentration on the membrane surface
Gel Electrophoresis
Experiment Objectives
• To learn how to assemble and perform gel electrophoresis.
• How to use gel electrophoresis to measure the molecular weight of
pepsin and mucor rennet and to compare them to the literature
values.
Gel Electrophoresis• Used for separating and detecting molecules based on size.
• By applying an electric field to the gel matrix the particles
migrate and separate based on size towards the positive
pole.
http://creationwiki.org/Gel_electrophoresis
SDS-PAGE
SDS
(sodium dodecyl sulfate)
• Detergent
• Denatures protein to their
primary structure
• Covers molecules with a
negative charge to be able to
migrate to the positive pole
PAGE
(polyacrylamide gel electrophoresis)
• A polymer of acrylamide
monomers
• Separates based on size of
molecules.
• Allows different sized proteins to
move at different rates.
http://www.bio.davidson.edu/genomics/method/SDSPAGE/SDSPAGE.html#SDS
Experiment Procedure
• 5 mg/ml crude porcine pepsin
• 5 mg/ml mucor rennet
• 5 mg/ml mix of crude pepsin and rennet
• 5 mg/ml of pure porcine pepsin
http://en.wikipedia.org/wiki/Polyacrylamide_gel_electrophoresis
Results - Gel
Total migration distance:
6.3 cm
Lanes 2,3,6,9: Protein
standard marker
Lane 4: Crude pepsin
Lane 9: Pure pepsin
Lane 5: Mucor Rennet
Lane 8: Crude
pepsin/rennet mixture
Results – Calibration Graph
y = -0.0131x + 2.4800
R² = 0.9824
0.5
0.7
0.9
1.1
1.3
1.5
1.7
1.9
2.1
2.3
2.5
0 10 20 30 40 50 60 70 80 90 100
Log(MW)
% migration distance
Log(MW) vs. % migration distance
Results – Values
Sample Band migration distance (cm) % migration distance MW (kDa) min MW (kDA) max MW (kDa) Literature Value
Crude Pepsin 1 4.6 73.0 33.4 18.9 59.0 34.6
Mucor Rennet 1 4.5 71.4 35.0 19.8 61.9 38
2 5 79.4 27.6 15.6 48.7 38
3 5.5 87.3 21.7 12.3 38.4 38
4 5.7 90.5 19.7 11.2 34.8 38
Mixture 1 4.4 69.8 36.7 20.8 64.9 38
2 4.6 73.0 33.4 18.9 59.0 34.6
Pure Pespsin 1 4.8 76.2 30.3 17.2 53.6 34.6
2 5.6 88.9 20.7 11.7 36.6 34.6
Possible Causes of Error
Cross-contamination between the sample mixtures:
• From sample preparation (e.g. contacted other solutions).
• During loading onto gel.
Break-down of mucor rennet
Conclusion
• Overall, three out of the four protein samples had results that clearly
showed the MW of each sample as being close to the literature value.
• Main error in the experiment was with the mucor rennet lane as
more unexpected bands showed up from unknown sources.
Reference
• Ming Cai, Wei Li, Hanhua Liang, Effects of ultrasound parameters on ultrasound-assisted ultrafiltration using
cross-flow hollow fiber membrane for Radix astragalus extracts, Chemical Engineering and Processing:
Process Intensification, Volume 86, December 2014, Pages 30-35, ISSN 0255-2701,
http://dx.doi.org/10.1016/j.cep.2014.10.008.
Q & A

Group_W_HF_and_Gel_Presentation

  • 1.
    Ultrafiltration and Gel Electrophoresis RashidAlsuwaidi Ahmed Alhazeem Matt Liu Wanying Chia
  • 2.
  • 3.
    Goals • Understanding theprinciples and parameters involved in membrane separations • Asses the roles of osmotic pressure and membrane fouling on membrane flux decline • Determine relevant solute mass transfer coefficients in membrane filtration process
  • 4.
    Ultrafiltration • Purifying solvents •Concentrating solutes • Utilizes pressure gradients • 𝑄 𝑚 ∝ 𝑛 𝑝∗𝑑 𝑝 4 𝑙∗𝜂 • 𝑣 = 𝑄 𝑚 ∆𝑃 − ∆𝜋 • 𝐶𝑠 = ∆𝜋 𝑅𝑇 • 𝑘 𝑐 = 𝑣/ ln 𝑣 𝑃−𝑣 𝐵 𝑅𝑇 𝐶 𝐵
  • 5.
    Experiment • 20 mMAcetate Buffer • 1 mg/mL porcine pepsin • 2 mg/mL porcine pepsin
  • 6.
    Filtration Rate 2.00E-03 2.50E-03 3.00E-03 3.50E-03 4.00E-03 4.50E-03 5.00E-03 5.50E-03 6.00E-03 30 3234 36 38 40 42 44 46 48 50 AvgFlux(mL/cm^2*sec) Applied Pressure (Psi) Avg. Flux Due to Applied Pressure 20 mM Acetate Buffer 1 mg/mL Protein Solution 20 mM Acetate Buffer After 2 mg/ml 𝝂 = 𝑸 𝒎(∆𝑷 − ∆𝝅)
  • 7.
    Osmotic Pressure 𝝅 =𝒄 𝒔 𝑹𝑻 -2.0 0.0 2.0 4.0 6.0 8.0 10.0 12.0 30 32 34 36 38 40 42 44 46 48 50 OsmoticPressureΔπ(psi) Pressure ΔP (psi) Osmotic Pressure Over Pressure 1 mg/mL 2 mg/mL
  • 8.
    Membrane Clogging? • Qm(before) = 1.01 x 10⁻⁴ mL/cm2*sec*Psi • Qm (after) =9.74 x 10⁻⁵ mL/cm2*sec*Psi • t-test results in p= 0.54 • Therefore Osmotic Pressure is greater at affecting mass transfer y = 1.08E-04x - 3.21E-04 R² = 9.88E-01 y = 8.78E-05x + 3.98E-04 R² = 9.98E-01 2.00E-03 2.50E-03 3.00E-03 3.50E-03 4.00E-03 4.50E-03 5.00E-03 5.50E-03 30 35 40 45 50 AvgFlux(mL/cm^2*sec Pressure (Psi) Comparison of Permeability Coefficient Flux Before Flux After
  • 9.
    4.00E-04 6.00E-04 8.00E-04 1.00E-03 1.20E-03 1.40E-03 1.60E-03 30 32 3436 38 40 42 44 46 48 50 Kc(cm/s) Pressure (Psi) Comparison of Kc Values Ideal 1 mg/mL Ideal 2 mg/mL Solution Jonnson 1 mg/ml Solution Jonnson 2 mg/mL 0.0 100.0 200.0 300.0 400.0 500.0 600.0 700.0 800.0 900.0 1000.0 30 32 34 36 38 40 42 44 46 48 50 Cs(mg/mL) Pressure (Psi) Comparison of Solute at Membrane Surface Ideal 1 mg/mL Ideal 2 mg/ml Jonnson 1 mg/ml Jonnson 2 mg/ml
  • 10.
    Cs and Masstransfer coefficient
  • 11.
    Conclusions • Osmotic Pressurehas a greater effect on mass transfer coefficient • Pressure increases mass transfer coefficients as well asProtein Concentration on the membrane surface
  • 12.
  • 13.
    Experiment Objectives • Tolearn how to assemble and perform gel electrophoresis. • How to use gel electrophoresis to measure the molecular weight of pepsin and mucor rennet and to compare them to the literature values.
  • 14.
    Gel Electrophoresis• Usedfor separating and detecting molecules based on size. • By applying an electric field to the gel matrix the particles migrate and separate based on size towards the positive pole. http://creationwiki.org/Gel_electrophoresis
  • 15.
    SDS-PAGE SDS (sodium dodecyl sulfate) •Detergent • Denatures protein to their primary structure • Covers molecules with a negative charge to be able to migrate to the positive pole PAGE (polyacrylamide gel electrophoresis) • A polymer of acrylamide monomers • Separates based on size of molecules. • Allows different sized proteins to move at different rates. http://www.bio.davidson.edu/genomics/method/SDSPAGE/SDSPAGE.html#SDS
  • 16.
    Experiment Procedure • 5mg/ml crude porcine pepsin • 5 mg/ml mucor rennet • 5 mg/ml mix of crude pepsin and rennet • 5 mg/ml of pure porcine pepsin http://en.wikipedia.org/wiki/Polyacrylamide_gel_electrophoresis
  • 17.
    Results - Gel Totalmigration distance: 6.3 cm Lanes 2,3,6,9: Protein standard marker Lane 4: Crude pepsin Lane 9: Pure pepsin Lane 5: Mucor Rennet Lane 8: Crude pepsin/rennet mixture
  • 18.
    Results – CalibrationGraph y = -0.0131x + 2.4800 R² = 0.9824 0.5 0.7 0.9 1.1 1.3 1.5 1.7 1.9 2.1 2.3 2.5 0 10 20 30 40 50 60 70 80 90 100 Log(MW) % migration distance Log(MW) vs. % migration distance
  • 19.
    Results – Values SampleBand migration distance (cm) % migration distance MW (kDa) min MW (kDA) max MW (kDa) Literature Value Crude Pepsin 1 4.6 73.0 33.4 18.9 59.0 34.6 Mucor Rennet 1 4.5 71.4 35.0 19.8 61.9 38 2 5 79.4 27.6 15.6 48.7 38 3 5.5 87.3 21.7 12.3 38.4 38 4 5.7 90.5 19.7 11.2 34.8 38 Mixture 1 4.4 69.8 36.7 20.8 64.9 38 2 4.6 73.0 33.4 18.9 59.0 34.6 Pure Pespsin 1 4.8 76.2 30.3 17.2 53.6 34.6 2 5.6 88.9 20.7 11.7 36.6 34.6
  • 20.
    Possible Causes ofError Cross-contamination between the sample mixtures: • From sample preparation (e.g. contacted other solutions). • During loading onto gel. Break-down of mucor rennet
  • 21.
    Conclusion • Overall, threeout of the four protein samples had results that clearly showed the MW of each sample as being close to the literature value. • Main error in the experiment was with the mucor rennet lane as more unexpected bands showed up from unknown sources.
  • 22.
    Reference • Ming Cai,Wei Li, Hanhua Liang, Effects of ultrasound parameters on ultrasound-assisted ultrafiltration using cross-flow hollow fiber membrane for Radix astragalus extracts, Chemical Engineering and Processing: Process Intensification, Volume 86, December 2014, Pages 30-35, ISSN 0255-2701, http://dx.doi.org/10.1016/j.cep.2014.10.008.
  • 23.

Editor's Notes

  • #18 After tracing over the bands of the protein samples. The bands of crude pepsin, mixture and pure pepsin look reasonable. Can see that mixture lane includes a band from crude pepsin lane and mucor rennet lane. More bands than expected in mucor rennet lane indicating that an error occurred during the experiment. In the pure pepsin lane, the wide band shows the concentrated pure pepsin in the sample whereas the other band shows the breakdown of the pepsin fragments (peptides). There is only one clear band for crude pepsin showing that it is more stable than pure pepsin and does not break down. Also, you can see that only 10 bands appear for the standard marker since the first few bands migrate faster through the gel.
  • #19 As you can see, the data from the protein standard marker was used to determine the tread line on the graph. The sample points are shown at their relative migration distances with the first point corresponding to the first band in mucor rennet and the mixture. Then comes the crude pepsin bands in the sample and the mixture. Later the pure pepsin points and the error points from the mucor rennet lane.
  • #20 For sample, the MW calculated is close to the literature value which is between the minimum and maximum MW. Two bands from rennet sample should not have been there and this can be seen by that the maximum MW values of both band are either at or below the literature value.
  • #21 - Checked if the mucor rennet has broken down but when adding the lower MWs, it does not result in the MW of other protein samples in the exp.