Download as PDF, PPTX
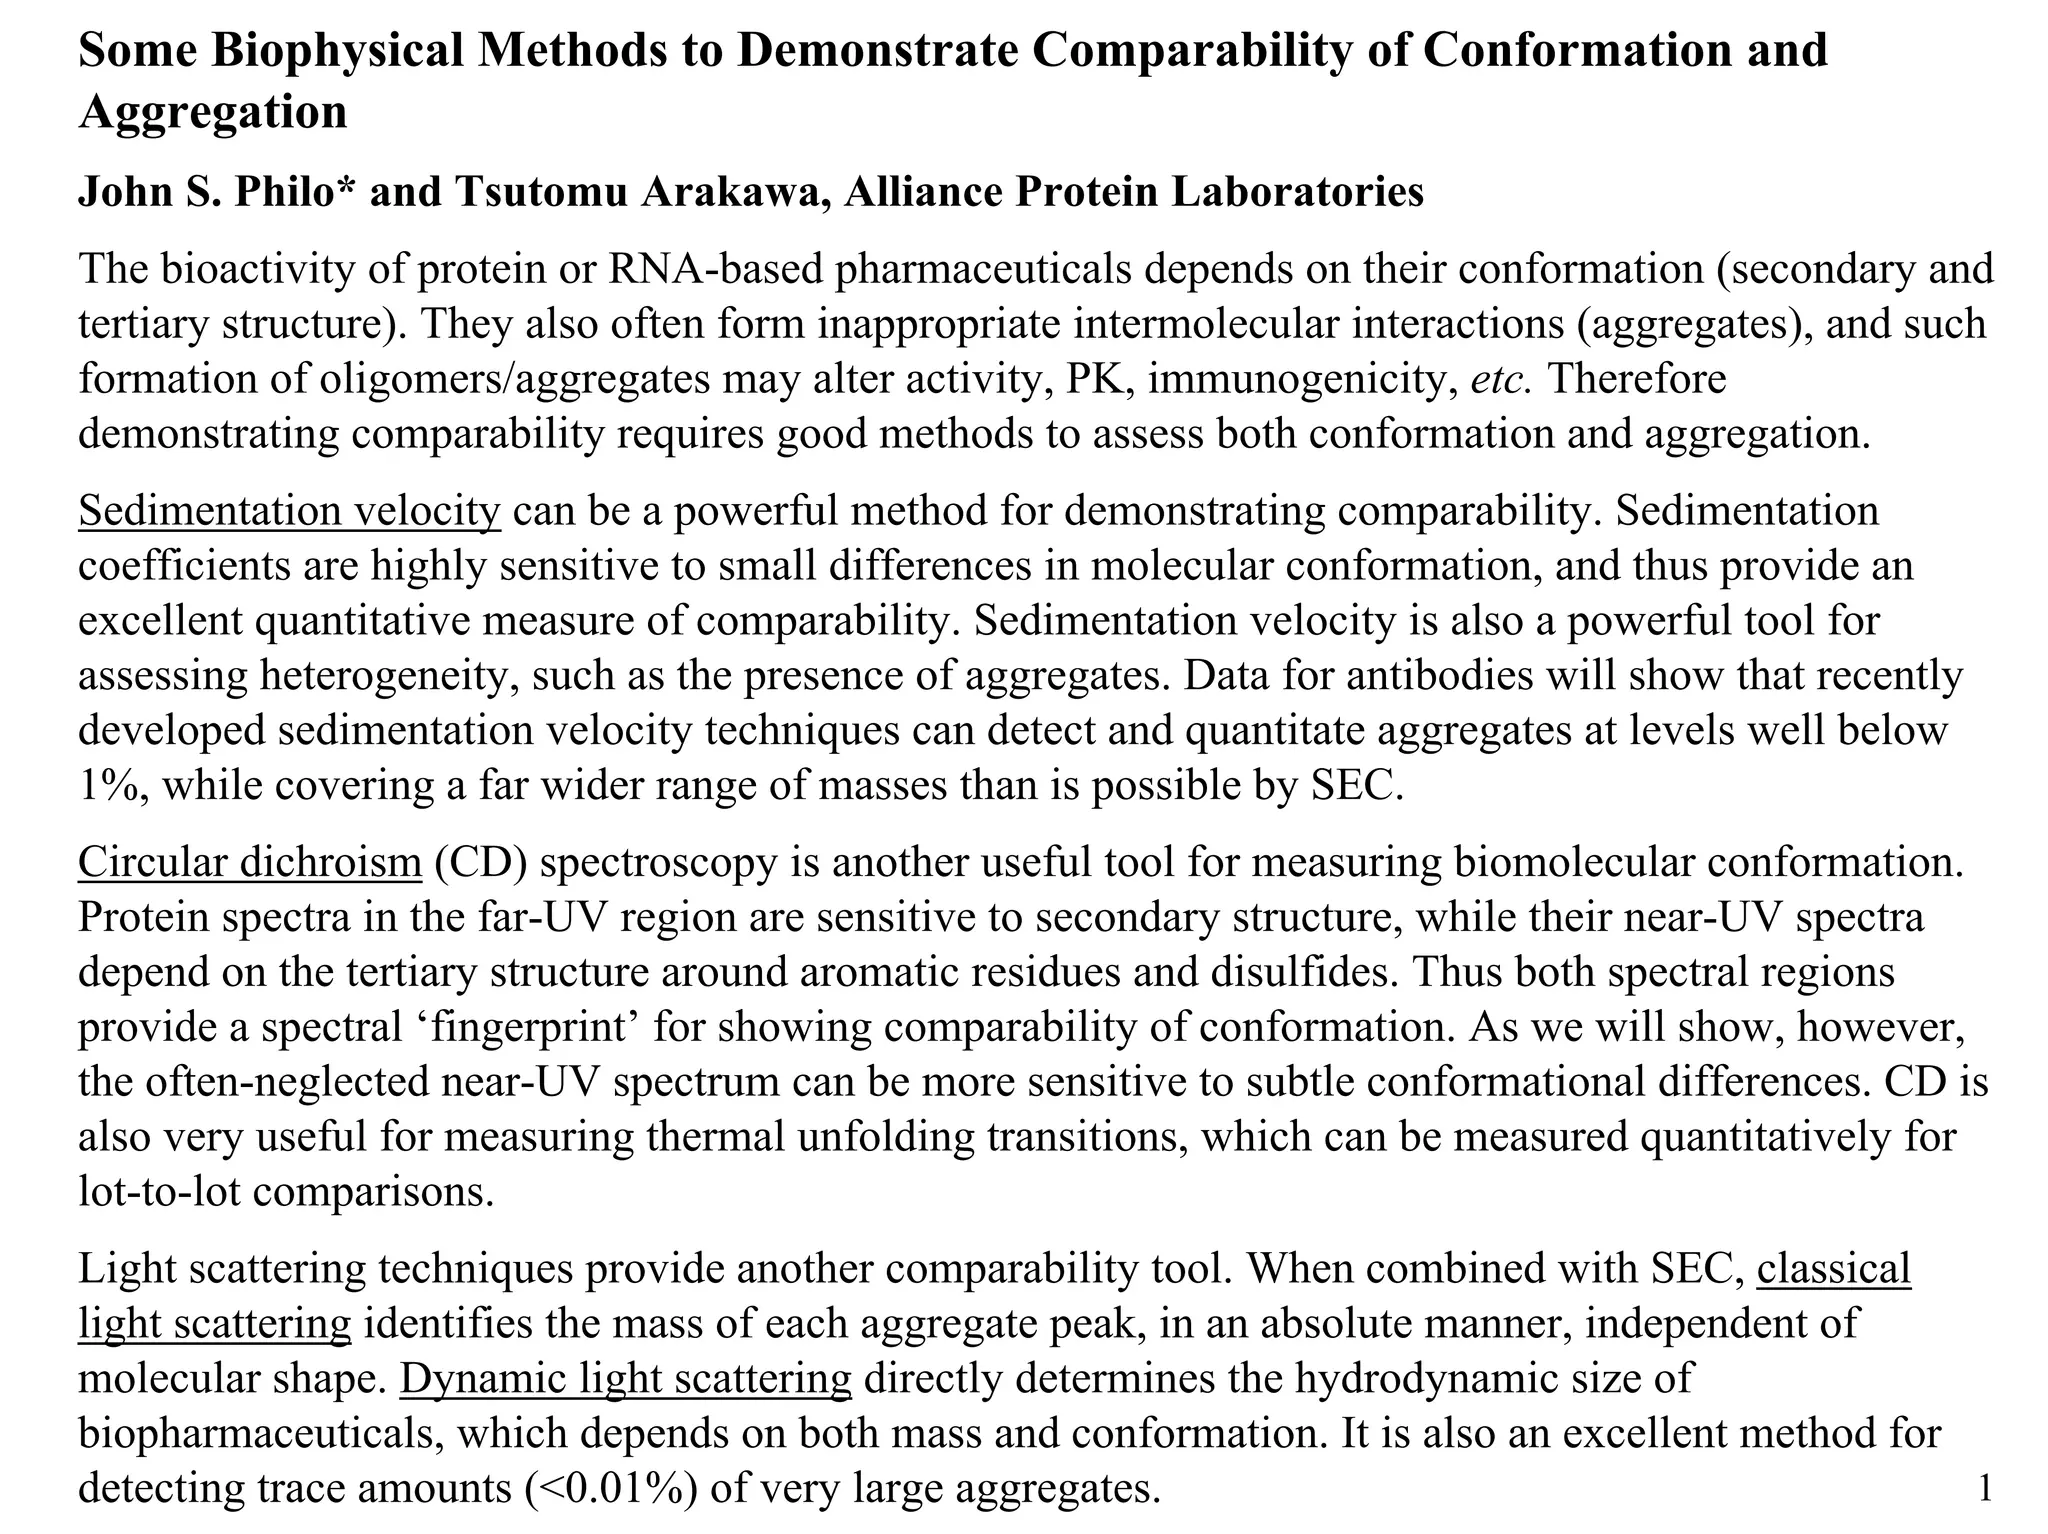
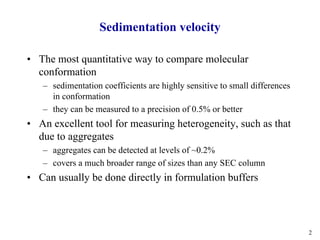
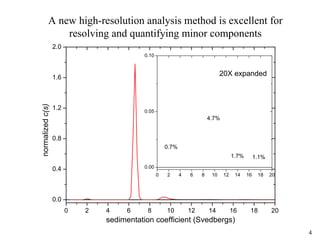
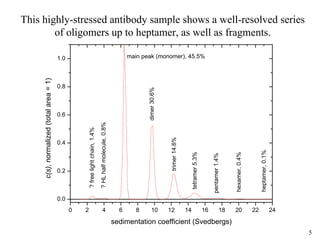
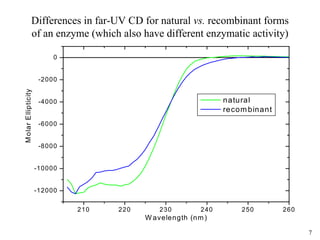
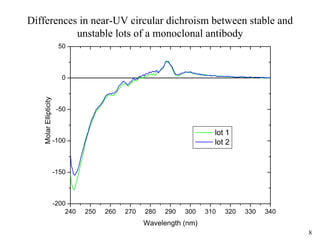
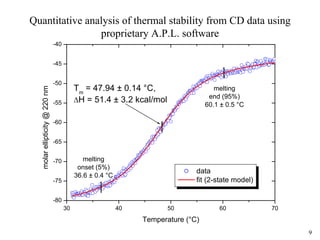
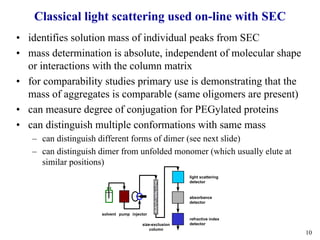
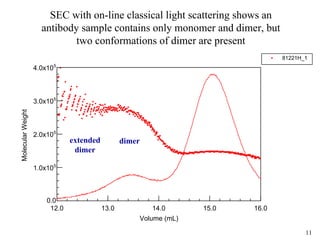
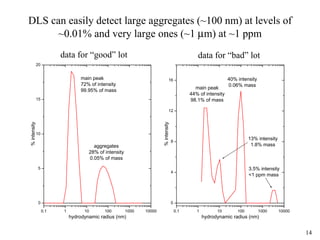
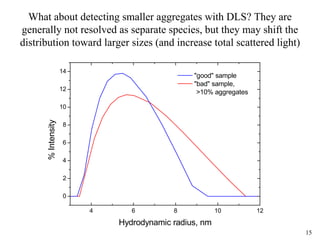

Sedimentation velocity, circular dichroism spectroscopy, light scattering, and dynamic light scattering are effective methods for demonstrating the comparability of protein conformation and aggregation between product lots: 1) Sedimentation velocity precisely measures sedimentation coefficients, which are highly sensitive to small conformational differences, and can detect aggregates as low as 0.2%; 2) Circular dichroism spectroscopy provides spectral fingerprints of secondary and tertiary structure that are sensitive to conformational changes, and can quantify thermal stability; 3) Light scattering coupled with size-exclusion chromatography identifies aggregate masses and distinguishes conformational variants; 4) Dynamic light scattering readily detects large aggregates above 0.01% or very large


