1. Ashikur Rahman Tushar (1220665)
Ratio Analyzed on the basis of Annual Report 2012 & 2013.
Ratio Analysis and Overview of the Financial Performance of
BEXIMCO Pharmaceuticals Ltd.
Based on the Annual Auditor’s Report 2012 and 2013.
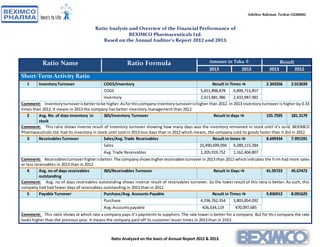
Ratio Name Ratio Formula Amount in Taka Result
2013 2012 2013 2012
Short-Term Activity Ratio
1 InventoryTurnover COGS/Inventory Result in Times 2.343356 2.013039
COGS 5,651,898,878 4,899,713,857
Inventory 2,411,881,986 2,433,987,981
Comment: Inventoryturnoverisbettertobe higher.Asforthiscompanyinventoryturnoverishigher than 2012. In 2013 inventory turnover is higher by 0.33
times than 2012. It means in 2013 the company has better inventory management than 2012.
2 Avg. No. of days Inventory in
stock
365/Inventory Turnover Result in days 155.7595 181.3179
Comment: This ratio shows inverse result of Inventory turnover showing how many days was the inventory remained in stock until it’s sold. BEXIMCO
Pharmaceuticals Ltd. had its inventory in stock until sold in 2013 less days than in 2012 which means, the company sold its goods faster than it did in 2012.
3 ReceivablesTurnover Sales/Avg.Trade Receivables Result in times 8.699334 7.991291
Sales 10,490,699,094 9,289,115,284
Avg.Trade Receivables 1,205,919,752 1,162,404,807
Comment: Receivablesturnoverhigherisbetter.The companyshowshigherreceivablesturnover in 2013 than 2012 whichindicates the firm had more sales
or less receivables in 2013 than in 2012.
4 Avg. no of days receivables
outstanding
365/Receivables Turnover Result in Days 41.95723 45.67472
Comment: Avg. no of days receivables outstanding shows inverse result of receivables turnover. So the lower result of this ratio is better. As such, this
company had had fewer days of receivables outstanding in 2013 than in 2012.
5 Payable Turnover Purchase/Avg. Accounts Payable Result in Times 9.836912 8.091625
Purchase 4,196,762,354 3,803,854,092
Avg.Accountspayable 426,634,119 470,097,685
Comment: This ratio shows at which rate a company pays it’s payments to suppliers. The rate lower is better for a company. But for this company the rate
looks higher than the previous year. It means the company paid off its customer lesser times in 2013 than in 2012.
2. Ashikur Rahman Tushar (1220665)
Ratio Analyzed on the basis of Annual Report 2012 & 2013.
6 Avg. no of days Payables
outstanding
365/Payables turnover Result in Days 37.10514 45.10837
Comment: Avg.no of days payables outstanding of lower indicates better payables performance the company possess. It means the company had been in
debt fewer days to its suppliers or more capable of paying its suppliers in time. This company indicates it has lower no. of days of payables outstanding.
7 WorkingCapital Turnover Sales/Avg.Working Capital Resultin Times 1.480257 1.80987
Sales 10,490,699,094 9,289,115,284
Avg.WorkingCapital 7,087,079,642 5,132,477,184
Comment: This turnover ratio measures how much operating capital needed to maintain a given level of sales. For this company working capital turnover
declinedthatmeansoperatingcapital forthiscompanydeclinedforthe salesitincurred.Soitmeansthe firmdidn’thave bettersaleshigher working capital in
2013 than the year 2012.
Long-Term Activity Ratio
8 FixedAssetTurnover Sales/Avg.FixedAsset Result in Times 0.600159 0.566672
Sales
10,490,699,094 9,289,115,284
Avg.fixedasset
17,479,859,057 16,392,388,639
Comment: Fixed asset turnover measures the amount of sales generated by the investment in or by acquiring the fixed asset. For this company sales
generated 0.04 times higher than the previous year which is good by the way.
9 Total Asset turnover Sales/Avg.Total Asset Result in Times 0.403019 0.377763
Sales 10,490,699,094 9,289,115,284
Avg.Total Asset 26,030,281,197 24,589,810,592
Comment:This turnoverratiorepresentsthe amountsalesgenerate bythe total assetorhowmuch of the total asset contributed to sales. The higher it is the
betteritis forthe company. In case of this company the turnover ratio rose by 0.03 times than the previous year which is good but the turnover result is not
sufficient enough for the company.
Working Capital Ratios and Defensive Interval
10 Current Ratio Current Asset/CurrentLiabilities Result in Ratio 2.031548:1 2.674574:1
CurrentAsset 8,903,422,328 8,197,421,953
CurrentLiabilities 4,382,581,278 3,064,944,769
Comment: This ratio measure how much current asset a company holds against the current liabilities or cash resources in current assets . The
higher the result the better it is for the company. The industry standard for this ratio is 2:1. For this company, the ratio fell down in 2013 by 0.64
times which is not good and it has result above the industry standard which also means that it had underutilized current assets.
3. Ashikur Rahman Tushar (1220665)
Ratio Analyzed on the basis of Annual Report 2012 & 2013.
11 Quick Ratio (Cash + Marketable Securities+ Acc.
Receivables)/CurrentLiabilities
Result in Ratio 0.421023:1 0.559678:1
Cash 595,732,966 552,978,676
Marketable Securities 0 0
AccountsReceivables 1,249,434,697 1,162,404,807
CurrentLiabilities 4,382,581,278 3,064,944,769
Comment: Quick ratio defines the liquid assets that can be quickly converted to cash. It reflects the amount of liquid asset it holds for every Tk. 1
worth of current liabilities. The industry standard is 1:1 for this ratio. According to the result this means the company had not enough liquid assets
against the current liabilities and the ratio also declined which also shows lack of better liquidity.
12 Cash Ratio (Cash + Marketable Securities)/CurrentLiabilities Result in Percentage 13.59% 18.04%
Cash 595,732,966 552,978,676
Marketable Securities 0 0
CurrentLiabilities 4,382,581,278 3,064,944,769
Comment: Thisratio isthe most conservative measure of cashresources.Thisratiodeclinedinrespectof the previousyearforthiscompany whichmeansthe
company had less cash resources than the previous year.
13 Cash Flow from Operations
Ratio
Cash Flow from Operations/CurrentLiabilities Result in Percentage 48.61% 60.60%
Cash FlowfromOperations 2,130,330,758 1,857,380,070
CurrentLiabilities 4,382,581,278 3,064,944,769
Comment: Cash flow from operations declined by 11.99% in a year which shows BEXIMCO Pharmaceuticals company had less cash flow from operations in
2013 than in 2012.
14 Defensive Interval 365 × {(Cash + Marketable Securities+ Acc.
Receivables) ÷ProjectedExpenditure}
Result in Days 82.47012 88.41889
Cash 595,732,966 552,978,676
Marketable Securities 0 0
AccountsReceivables 1,249,434,697 1,162,404,807
ProjectedExpenditure 8,166,426,324 7,081,235,724
Comment: This ratio measures how much time a firm needs to generate liquid assets to support projected expenditure. The lower result is better for this
ratio. The time to generate liquid assets is less in 2013 with respect o 2012 which is better for the company.
Capitalization Table and Debt Ratio
15 Debt to Capital Total Debt/Total Capital Result in Percentage 21.47% 19.03%
4. Ashikur Rahman Tushar (1220665)
Ratio Analyzed on the basis of Annual Report 2012 & 2013.
Total Debt 5,407,473,943 4,325,496,985
Total Capital (Total Debt+ Total Equity) 24,458,122,850 22,068,946,116
Comment: This ratio measures how much amount of the total capital a company has in its capital structure as debt. The lower percentage is better for this
ratio.Because the lowerthe debtthe lessriskyacompany is. But for the companythe percentage of its debt in the capital increased by the year which is not
good for a company.
16 Debt to Equity Total Debt/Total Equity Result in Percentage 27.34% 23.50%
Total Debt 5,407,473,943 4,325,496,985
Total Equity 19,775,552,465 18,408,161,859
Comment: Thisratio reflectshowmuchdebta companyhasagainstits equity.Itmeansfor Tk. 1 worth of equity how much debt a firm has. The lower result
of this ratio is better. But for this company this ratio increased by almost b4% by one year.
Interest Coverage Ratio
17 TimesInterestEarned Ratio EBIT/Interest Expense Result in Percentage 3.65% 3.42%
EBIT 2,324,272,770 2,207,879,560
InterestExpense 636,587,090 645,406,575
Comment: Thisratio measures the interestcoverage ratioorearningsavailable tocoverinterestexpense.The lower ratio is better. But for this company the
ratio shows an increment which is not good.
18 Cash Flow from Operationsto
Debt
Cash Flow from Operations/Debt
Result in Percentage 0.3940 0.4294
Cash FlowfromOperations 2,130,330,758 1,857,380,070
Total Debt 5,407,473,943 4,325,496,985
Comment: It measuresthe coverage of principal requirementbythe currentcash flow.The resultgreaterthan 1 is better for a company. Though the result is
greater than standard in 2013 but ratio declined which is not good.
Profitability Ratio
19 GrossMargin GrossProfit/Sales Result in Percentage 46.12% 47.25%
Gross Profit 4,838,800,216 4,389,401,427
Sales 10,490,699,094 9,289,115,284
Comment: This ratio shows how much percentage of gross profit generated from sales after incurring the cost of goods that had been sold. The higher the
result of this ratio is better. But the percentage declined for the company in 2013.
20 OperatingMargin/Margin
Before Interestand Tax/Return
on Sales
EBIT/Sales Result in Percentage 22.16% 23.77%
5. Ashikur Rahman Tushar (1220665)
Ratio Analyzed on the basis of Annual Report 2012 & 2013.
EBIT 2,324,272,770 2,207,879,560
Sales 10,490,699,094 9,289,115,284
Comment: It showsthe percentage of profit generated from sales after performing operating expenses. The higher the percentage the better it is. But the
percentage of operating profit also declined for the company in 2013 which is not good.
21 Pretax Margin Earnings Before Tax/Sales Result in Percentage 19.96% 20.56%
EarningsBefore Tax 2,093,594,171 1,909,829,236
Sales 10,490,699,094 9,289,115,284
Comment: It reflectsthe percentage of incomefromsalesbeforetaxes.The higherpercentageis betterforthe company. But pretax margin also declined for
the company.
22 Profit Margin NetIncome/Sales Result in Percentage 13.40% 14.20%
NetIncome 1,406,104,399 1,319,389,328
Sales 10,490,699,094 9,289,115,284
Comment: This ratio shows the percentage of net income on sales after incurring all the expenses. The higher percentage is better for the company. But
profit margin also declined for the company.
Return on Investment
23.1 Return on Asset(ROA) EBIT/Avg. Total Asset Result in Percentage 8.93% 8.98%
EBIT 2,324,272,770 2,207,879,560
Avg.Total Asset 26,030,281,197 24,589,810,592
Comment: It showsthe percentage of income generatedbyutilizingtotal assets. The higherpercentageisbetterforthe company.Butthe percentage is very
low and it also decline in 2013.
23.2 DU Pont ROA Total Asset Turnover × Return on Sales Result in Percentage 8.93% 8.98%
Comment: It is anothermeasure of calculatingROA whichiscalled‘Disaggregationof ROA’.Ithassame attributesasROA and for this ratio the result is same
as ROA.
24 Return on Total Capital (ROTC) EBIT/Avg. Total Capital Result in Percentage 9.70% 9.71%
EBIT 2,324,272,770 2,207,879,560
Avg.Total Capital 23,958,342,626 22,733,658,844
Comment: Itshowsthe percentage of income generatedbyfinancing.The higherpercentage isbetter for the company. But the percentage is very low and it
decreased in 2013 by 01%. Though the decrement is not so much but 01% decrement holds much enough of the amount in tk. which really matters.
6. Ashikur Rahman Tushar (1220665)
Ratio Analyzed on the basis of Annual Report 2012 & 2013.
25 Return On Equity (ROE) NetIncome/Avg. Stockholders’Equity Result in Percentage 7.36% 7.17%
NetIncome 1,406,104,399 1,319,389,328
Avg.Stockholders’Equity 19,091,857,162 18,408,161,859
Comment: Thisratio measuresthe percentage of income generatedbyequityfinancing. Higherpercentageof this ratio is better for this company. The radio
for this company increased in 2013 which is good.
26.1 DU Pont ROE ROA × (Asset÷ Equity) Result in Percentage 12.40% 12.00%
ROA 0.0893 0.0898
Asset 27,470,751,802 24,589,810,592
Equity 19,775,552,465 18,408,161,859
Comment: It is another measure of calculating ROE which is called ‘Disaggregation of ROE’. It has same meaning as ROE and this ROE measures shows the
percentage increased which is better. Different ROE measures can show different results.
26.2 DU Pont ROE ROA + [(ROA - Costof Debt) × (Debt/Equity) Result in Percentage 11.17% 10.96%
Total Debt 5,407,473,943 4,325,496,985
Equity 19,775,552,465 18,408,161,859
Cost of Debt 0.73 0.30
Equity 19,775,552,465 18,408,161,859
Comment: It is another measure of calculating DU Pont ROE. This ratio increased in 2013 than it was in 2012 which shows better performance of the
company.
26.3 DU Pont ROE [ ROA - (InterestCost ÷ Asset)]× (Asset÷ Equity) Result in Percentage 9.19% 8.49%
Interestcost 636,587,090 645,406,575
Asset 27,470,751,802 24,589,810,592
Equity 19,775,552,465 18,408,161,859
Comment: It is another measure of calculating DU Pont ROE. This ratio increased in 2013 than it was in 2012 which shows better performance of the
company.
27 Return on Common Equity
(ROCE)
(NetIncome-PreferredDividends)/Avg.Common
Equity
Result in Percentage 42.94% 43.31%
NetIncome 1,406,104,399 1,319,389,328
PreferredDividend 0 0
Avg.CommonEquity 3,274,869,785 3,046,390,500
Comment: Thisratio reflectsthe percentageof netincome generatedbyequityfinancingaftergivingpreferreddividends,A firm with preferred stockholders
takesthisratio incounterto measure ROE. Higherresultof this ratio is better for the company. But for this company the ratio declined which is not showing
7. Ashikur Rahman Tushar (1220665)
Ratio Analyzed on the basis of Annual Report 2012 & 2013.
better performance. The firm must have given more preferred dividends or had less income for the year 2013.
28 Financial Leverage Effect (FLE) OperatingIncome/NetIncome Result in Percentage 1.65299 1.67341
OperatingIncome 2,324,272,770 2,207,879,560
NetIncome 1,406,104,399 1,319,389,328
Comment: This ratio measures the sensitivity of a company’s earnings per share (EPS) to fluctuations in its operating income, as a result of changes in its
capital structure. The ratio shows that the higher the degree of financial leverage, the more volatile is EPS. So the lesser it is the better it is for a firm. The
leverage effect declined in 2013 from 2012 by 0.02 times.
29 Basic EPS (NetIncome - PreferredDividend) ÷ Weighted
avg. Common shares outstanding
Result in Taka 4.01 3.77
NetIncome 1,406,104,399 1,319,389,328
PreferredDividend 0 0
Weightedavg.no.of commonshares 350,334,907 350,334,907
Comment: It showthe amount of earning a common shareholder is going to get for a share after distributing preferred dividends. It is good to have higher
EPS. The EPS for this company rose in 2013 by Tk. 0.24 than the previous year.
30 DividendPayout Ratio Dividend/NetIncome Result Ratio 0.00003:1 0.00026:1
Dividend 47,581 340,504
NetIncome 1,406,104,399 1,319,389,328
Comment: Dividend is not mandatory for accompany to declare. But it is good for the common shareholders to have dividends. To increase the amount of
investment in the company stocks by the common shareholders a company must have better dividend payout ratio. The di vidend payout ratio for this
company is very low which is not at all a very considerable.
8. Ashikur Rahman Tushar (1220665)
Ratio Analyzed on the basis of Annual Report 2012 & 2013.
Overview of the Financial Performance of BEXIMCO Pharmaceuticals Ltd
BEXIMCO Pharmaceuticals Ltd. is a renowned pharmaceutical company in Bangladesh. It is a very large pharmaceuticals company with a millions
of revenues and shareholders. It is has been established decades ago. From the beginning until now it has been very active with their
performance and it had high-low performance like every company has for a period of days, months or years. For past few years it has been in top
three in the ranking of pharmaceuticals industries.
But if we look at the past two years (2012 and 2013) performance of this company may be we would have a recent idea about this company’s
financial performance. I have calculated all the ratios for the BEXIMCO Pharmaceuticals Ltd and now let’s have an overview of its financial
performance according to ratio category.
Short Term Activity Ratio: After calculating all the short term activity ratios we can see the company had a positive performance in 2013
than 2012 with its short term activity ratio. All the ratios within it had positive trend.
Long Term Activity Ratio: BEXIMCO Pharma also shows a better performance and a positive trend with its long term activity ratios.
Working Capital Ratios and Defensive Interval: BEXIMCO Pharma didn’t have better performance with its working capital according to
this ratio. Because the ratios within it shows negative trend except defensive interval ratio.
Capitalization Table and Debt Ratio: This ratio reflects a negative trend of the company’s capitalization ratio. The company had more debt
to its equity and capital in 2013 than in 2012.
Interest Coverage Ratio: In this ratio category the company had negative performance or trend.
Profitability Ratio: The profitability ratios of this company is good enough by figure but not with the trend. The profitability also shows
decrease in percentage of profits in 2013 than in 2012.
Return on Investment: Return on investment of the company indicates that it didn’t have better ROA, ROTC but had better ROE, ROCE. It
reflects the company had average performance with its return on investment.
So after analyzing all the ratios we can comment that BEXIMCO Pharmaceuticals Ltd. didn’t have better performance in 2013 comparing the year
2012.