Download to read offline


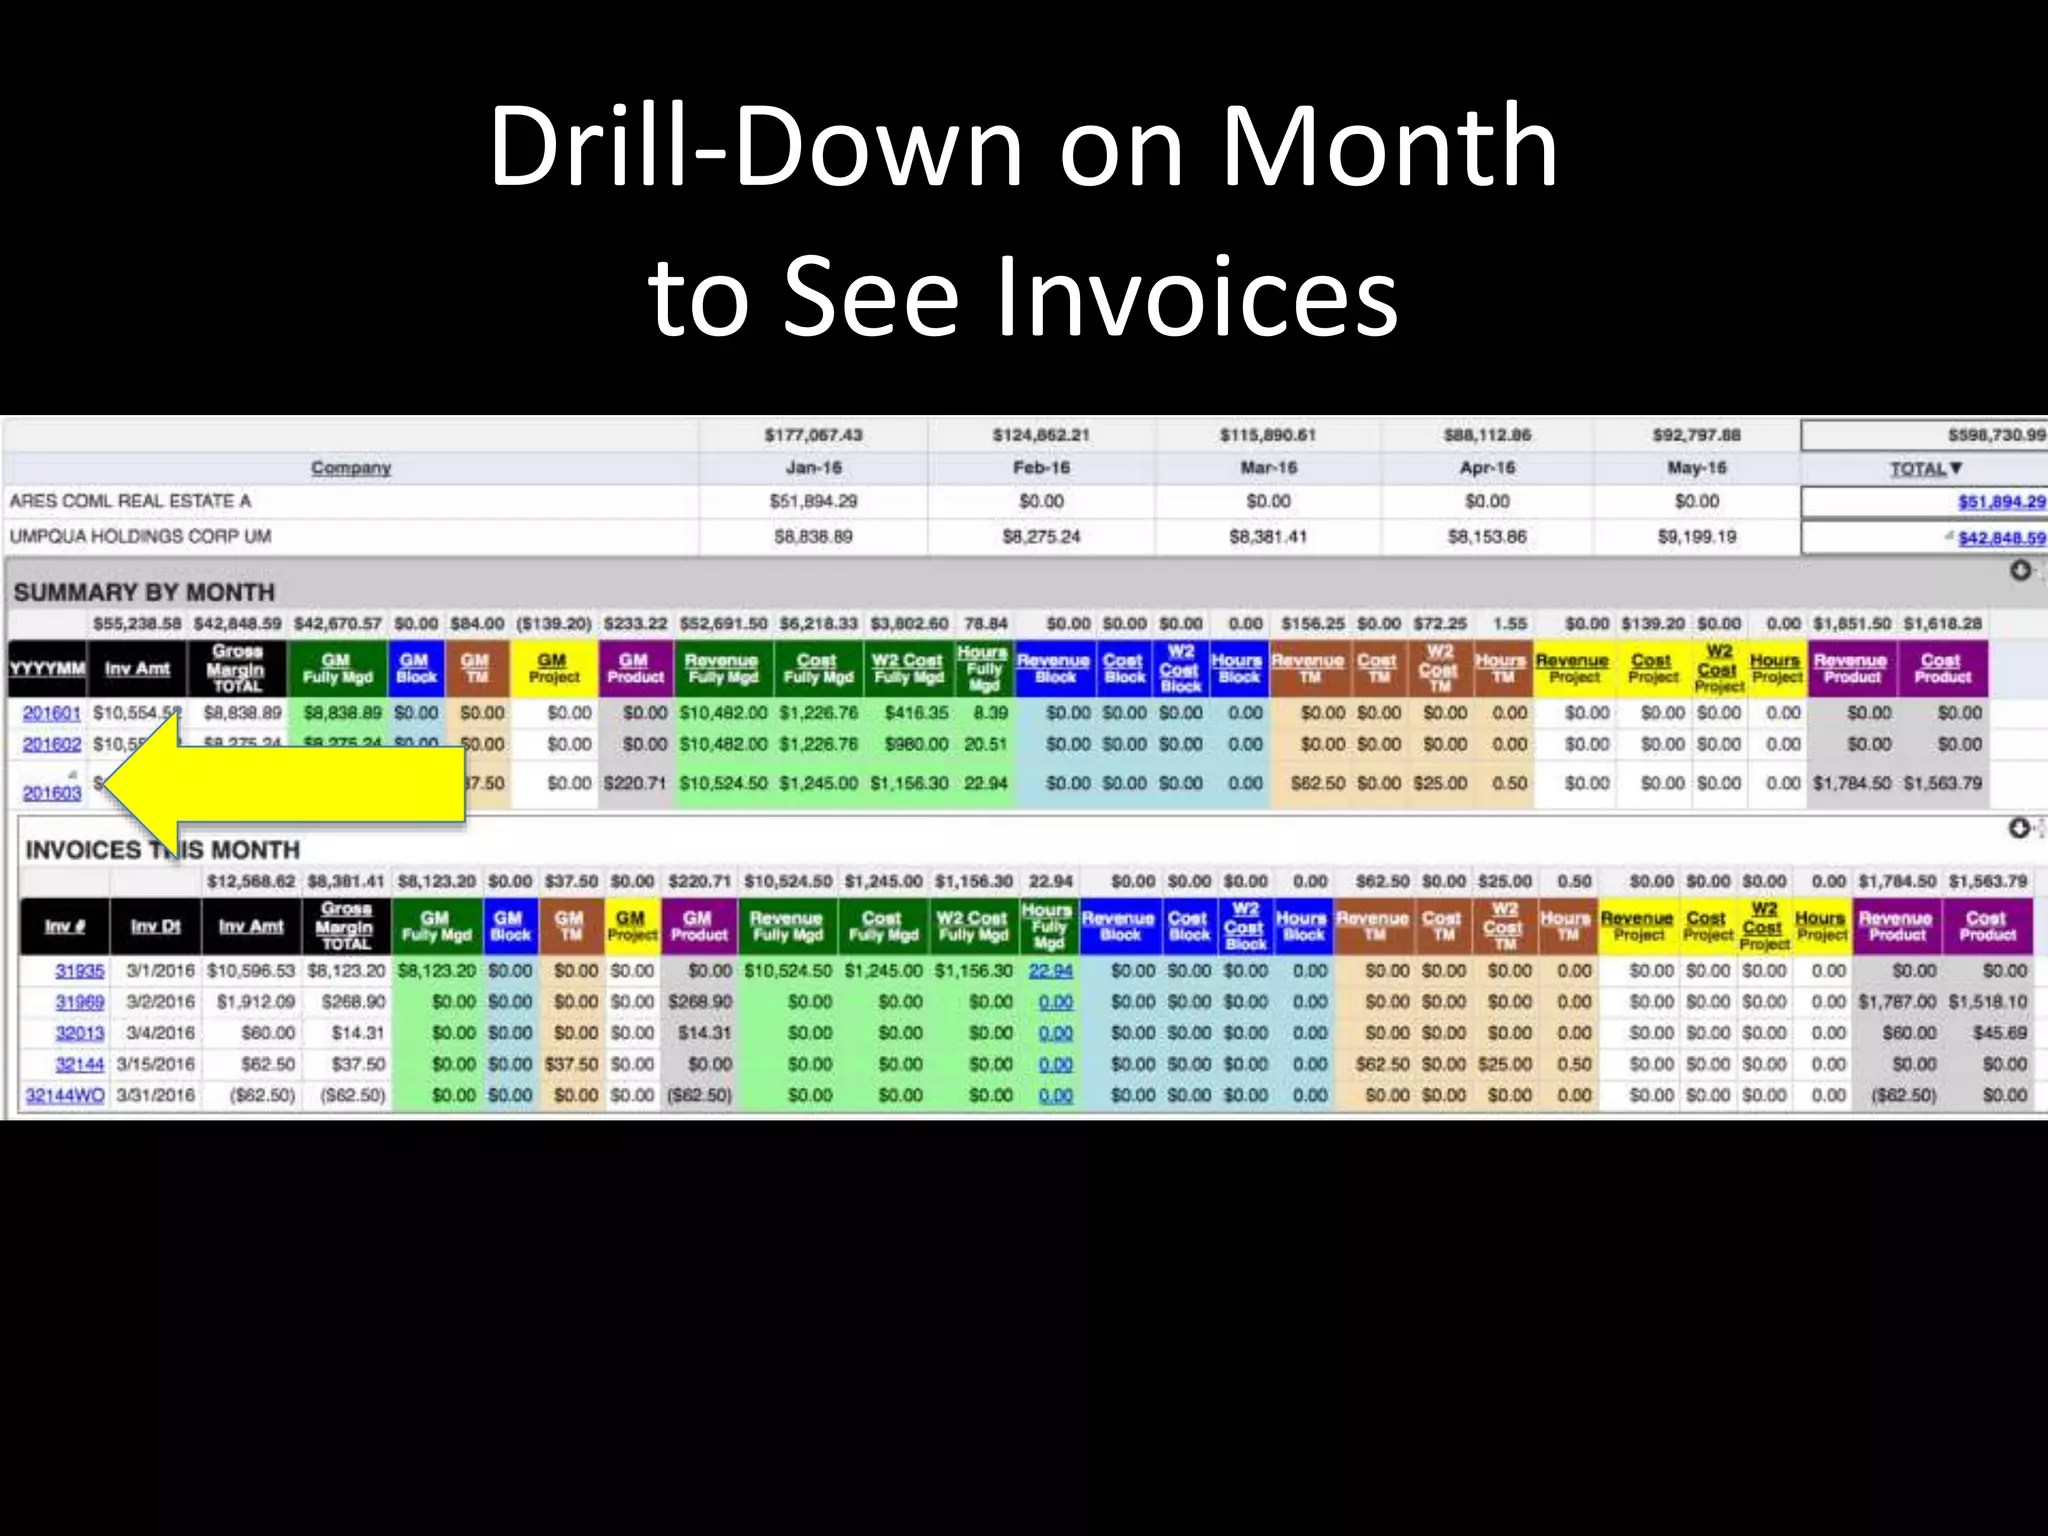
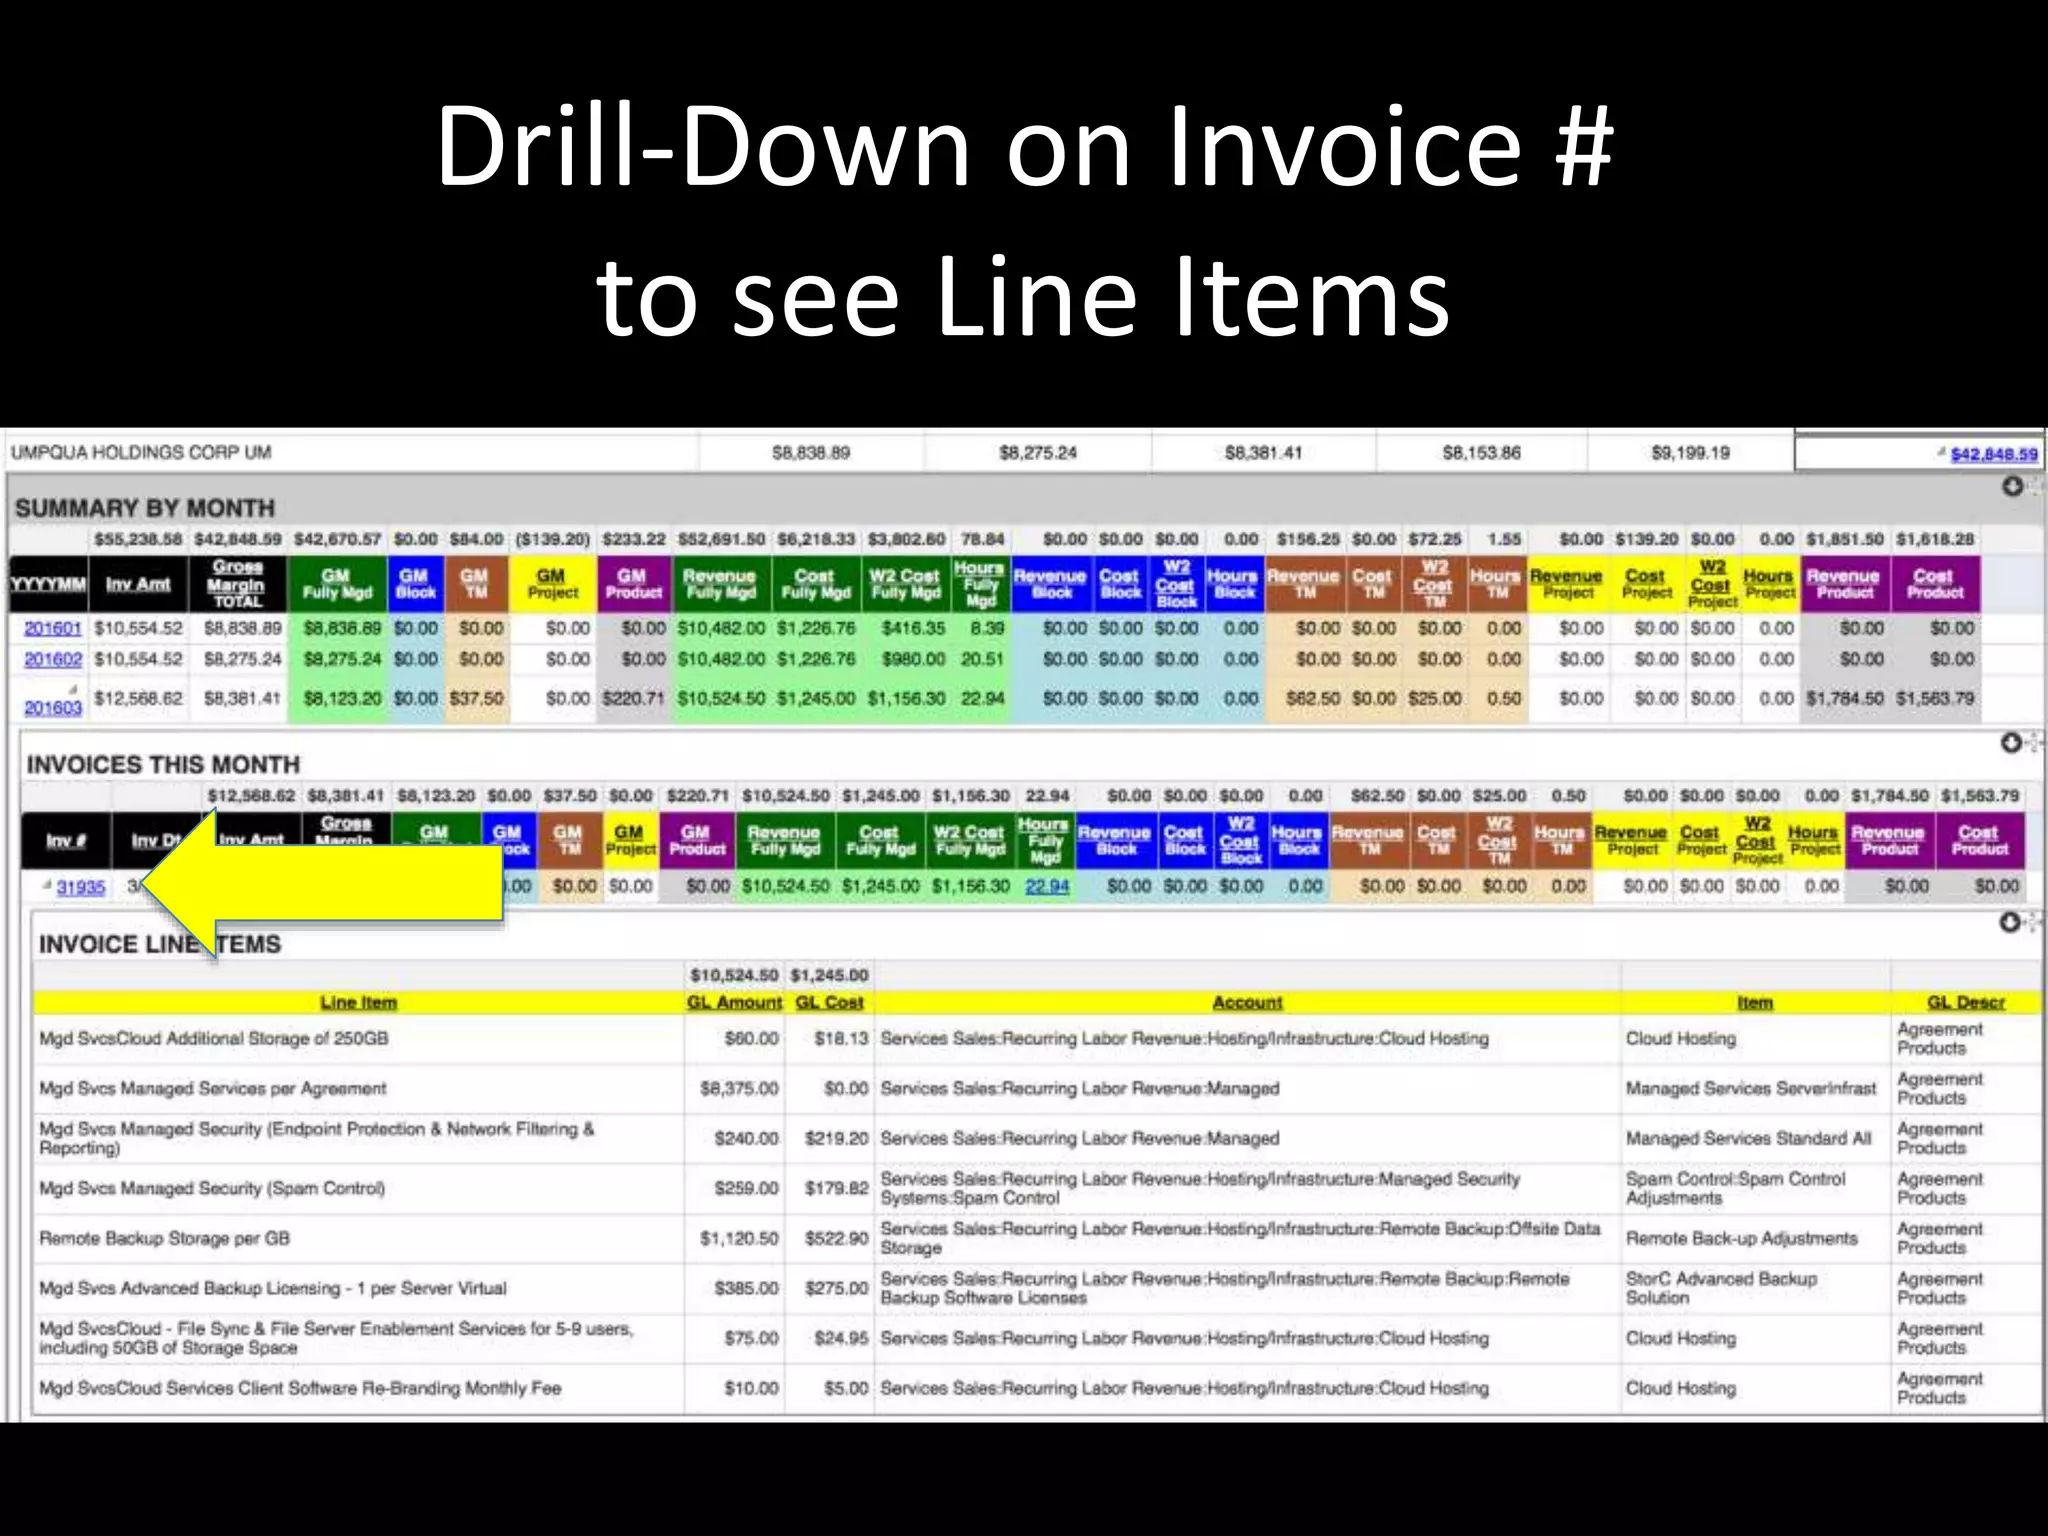
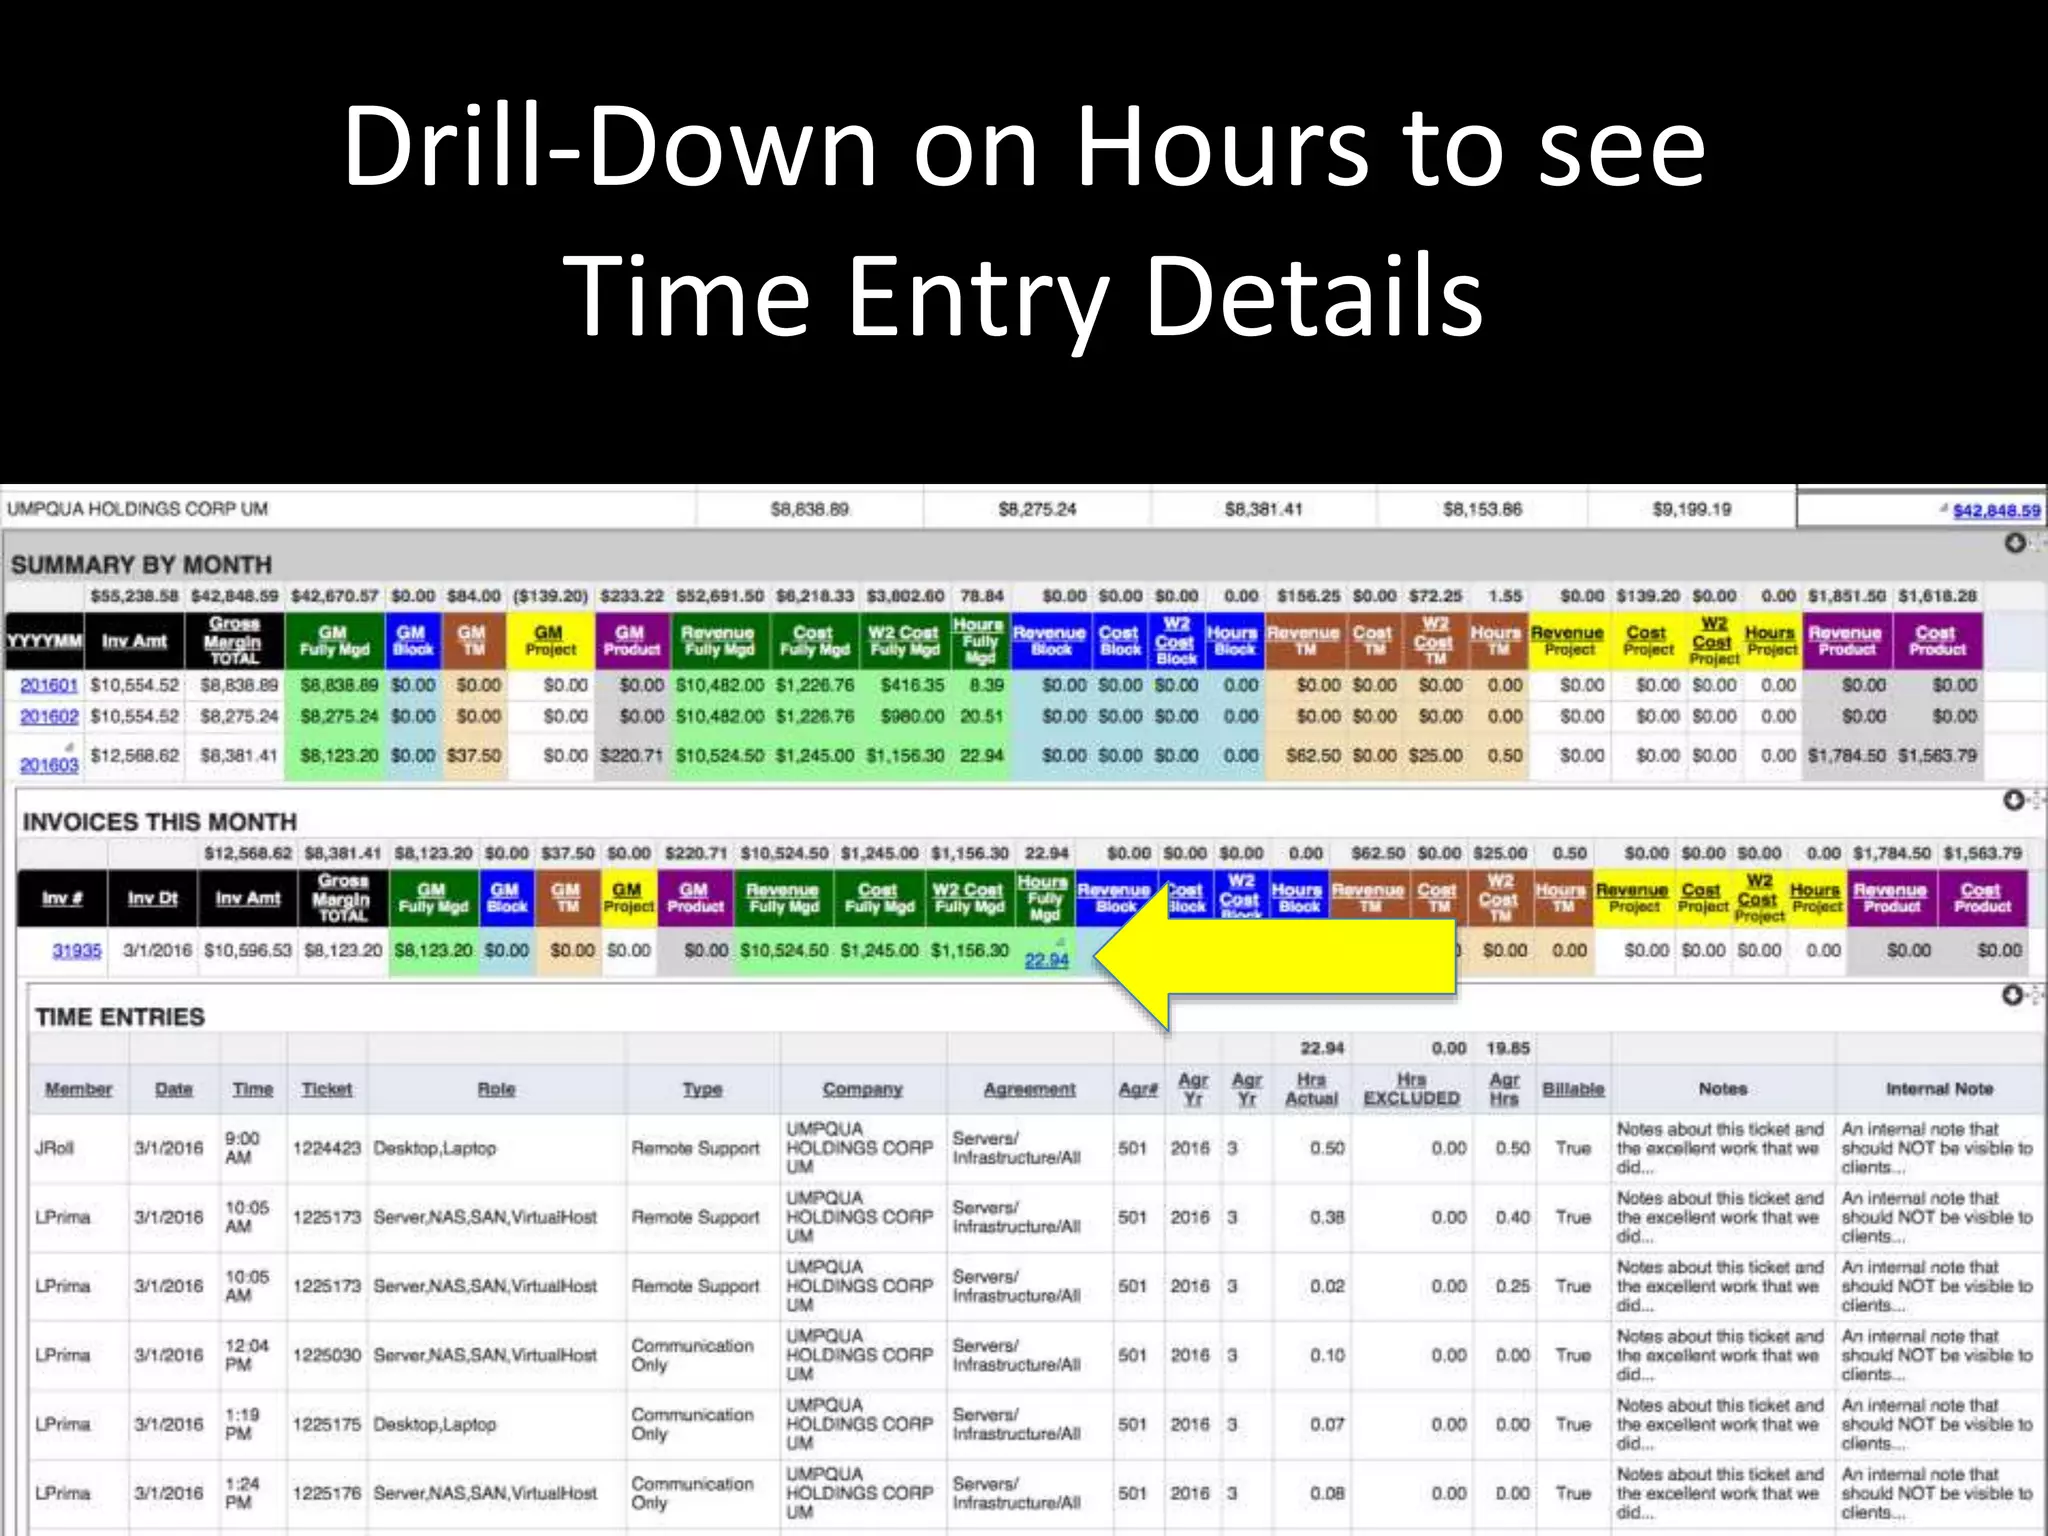
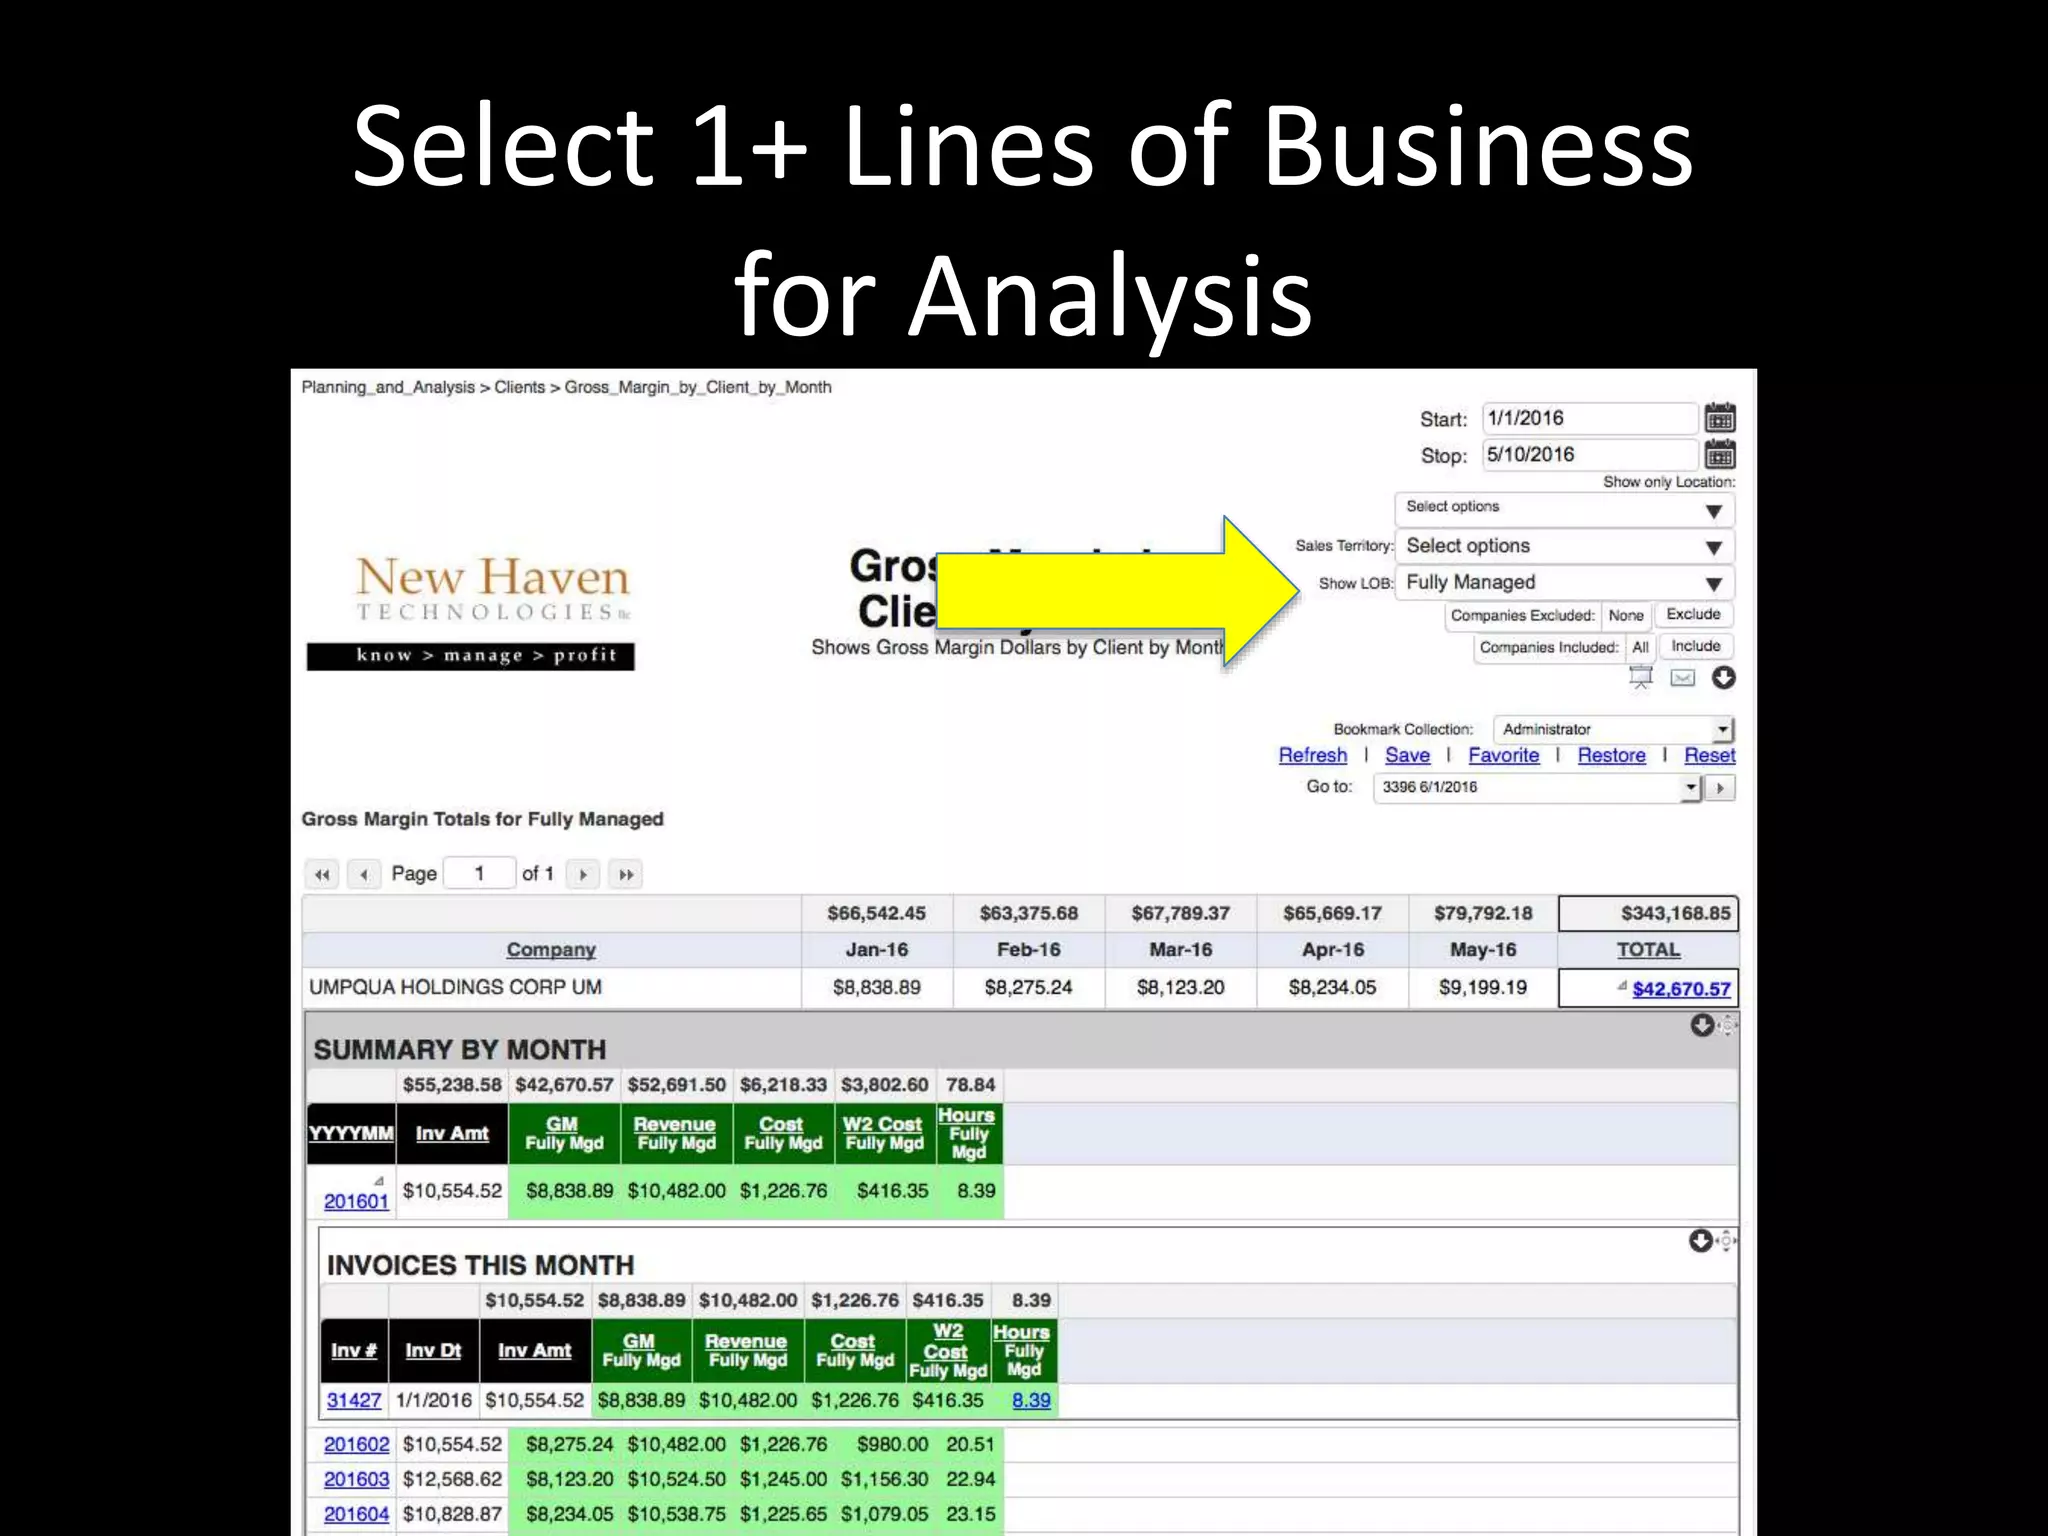
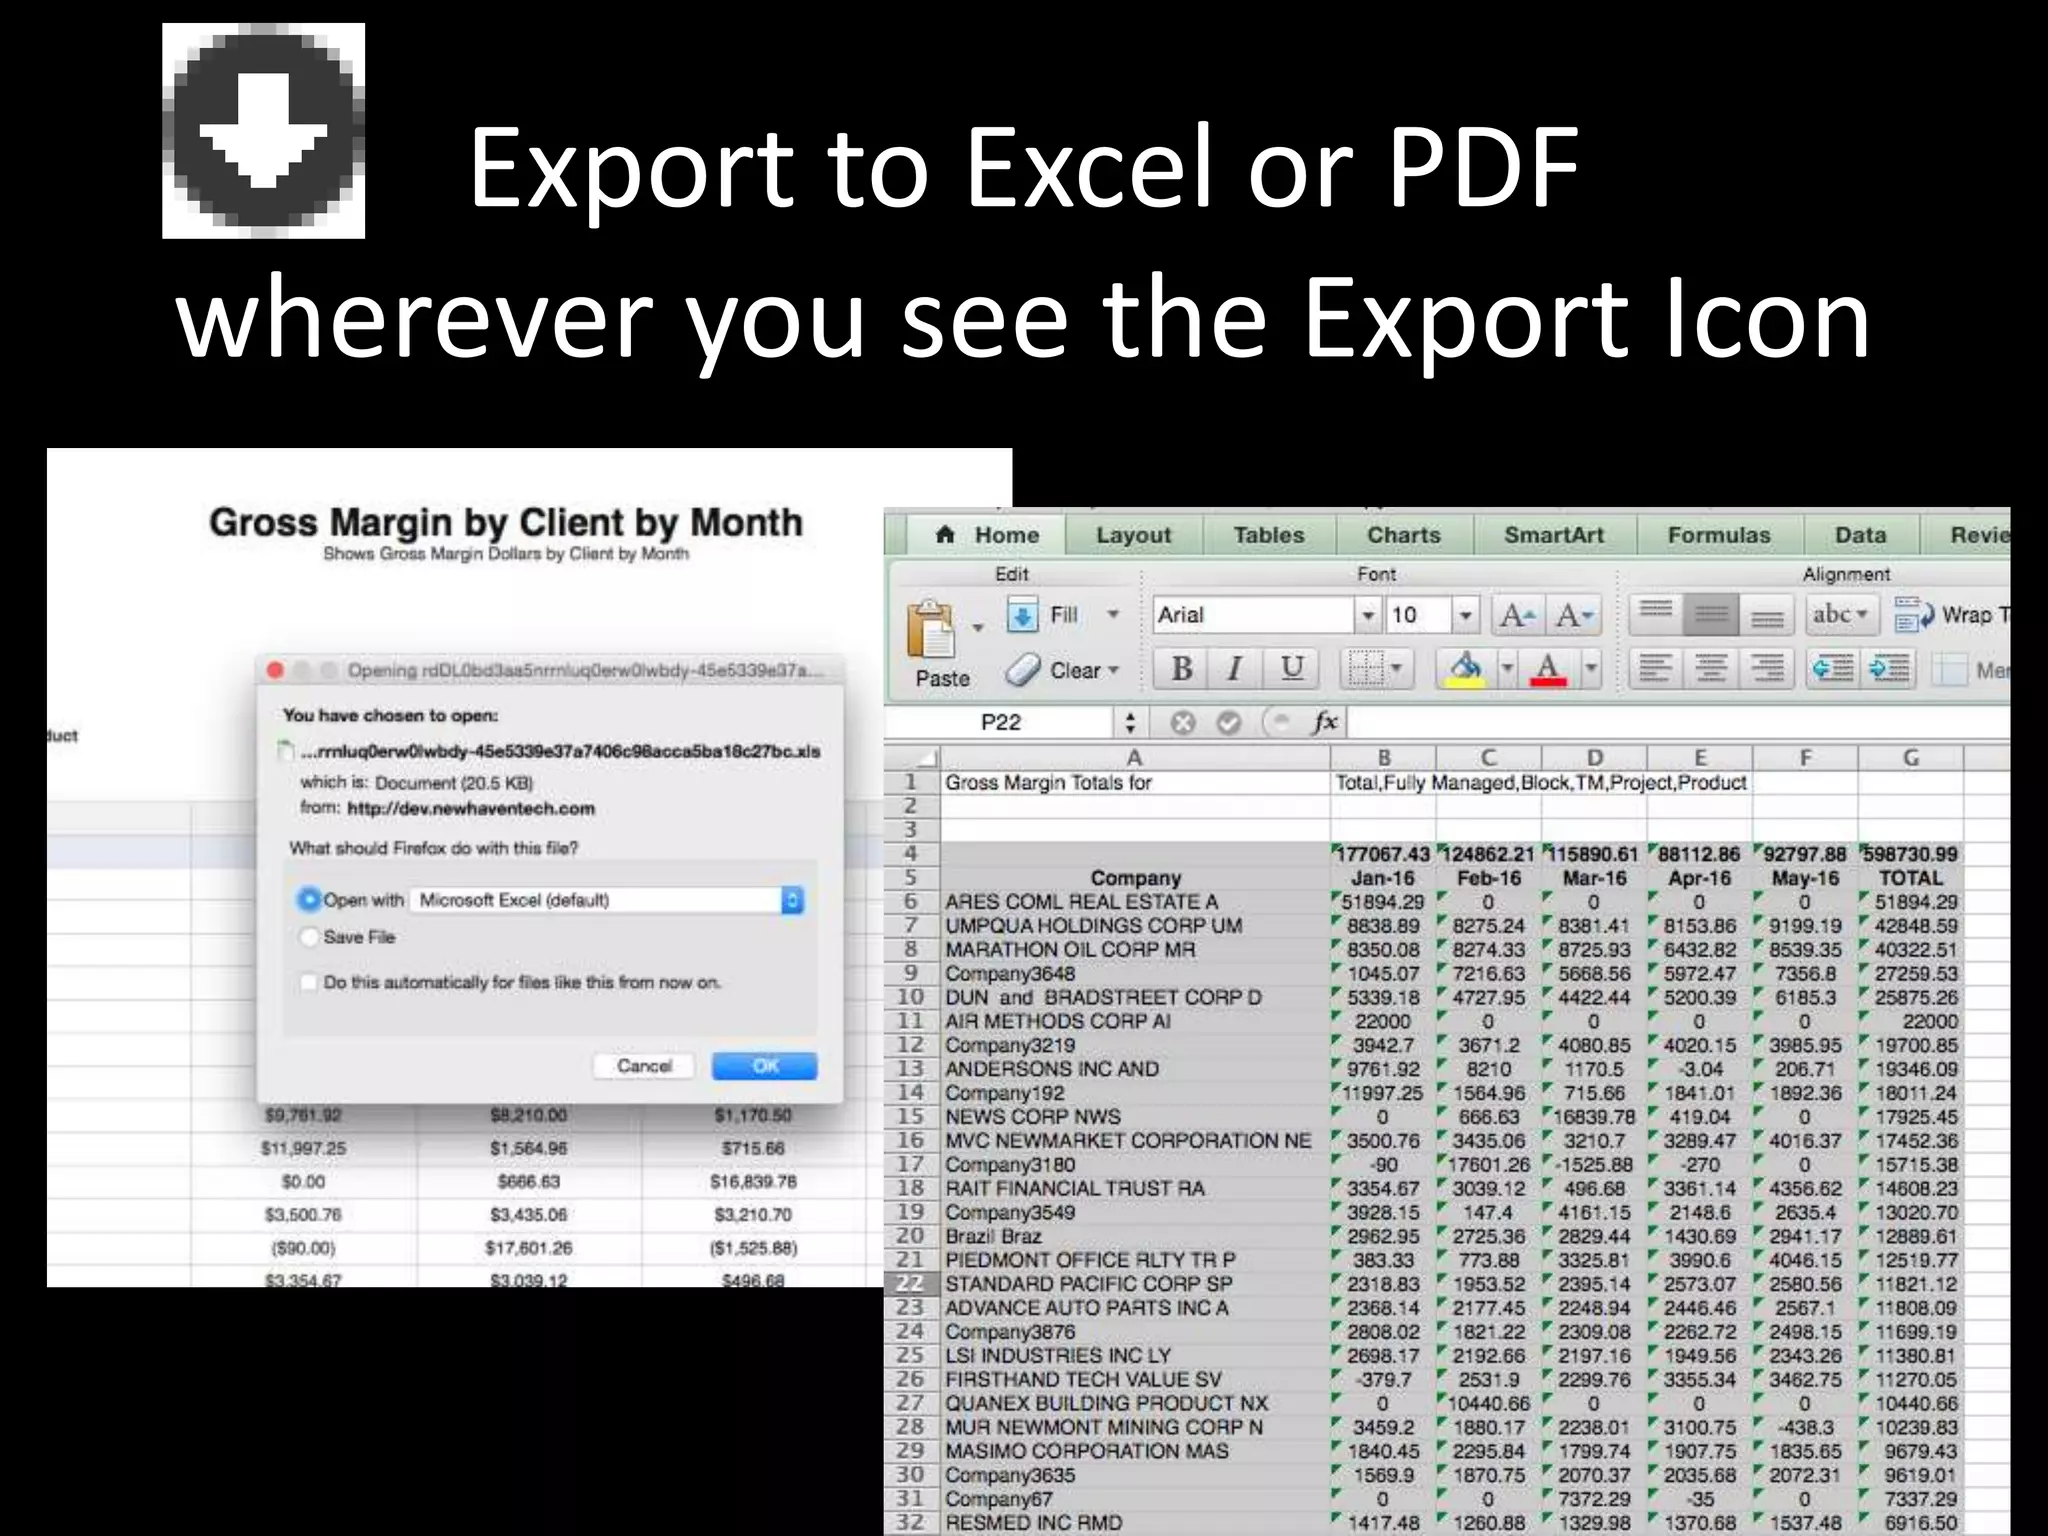


The document outlines a gross margin report by client, highlighting revenue and costs associated with each client on a monthly basis. It includes filtering options by line of business, sales rep, and location, and provides detailed drill-down capabilities into invoices and time entries. Additionally, users can export data, save settings for easy access, and find guidance through various resources.


