This white paper by the IEC Market Strategy Board addresses the integration of large-capacity renewable energy sources into existing electricity grids, highlighting the challenges and necessary conditions for successful integration. It discusses the role of electrical energy storage and operational enhancements necessary to manage the increased share of renewables, while also examining current practices and future technological solutions. The document concludes with recommendations for policy-makers, utilities, and industry stakeholders to facilitate effective grid integration.


![14 S E C T I O N 2
RE generation: the present, the future and the integration challenges
2.1 Drivers of RE development
RE is a growing component of electricity grids
around the world due to its contributions to
(1) energy system decarbonization, (2) long-
term energy security, and (3) expansion of
energy access to new energy consumers in the
developing world. As stated in the MSB EEE
Report:
In short: the challenge is ensuring energy
availability and preserving the environment. The
key elements are the following:
1) Stabilizing climate impact from fossil fuel use
2) Meeting the energy demand of a growing
population
3) Bringing electricity to the 1.6 B people
without access
4) Ensuring stable and secure energy access
for all nations
5) Transporting electricity long distances from
where it is generated to where it is used.
[msb10]
RE is implicated in all of these elements, and is
critical to transforming energy grids to meet the
environmental, economic and social challenges
of the future. Globally, RE’s share of electricity
generation will increase substantially over the
next two decades and beyond. Indeed, this is
already occurring: governmental action at the
international, national and subnational levels has
created a wide variety of laws and policies to
promote RE development. These include:
• carbon taxes: taxation of greenhouse gas
emissions, so as to internalize the climate-
disruption costs of fossil-fuel use;
• cap-and-trade systems: provision of
tradable annual emissions allowances to
greenhouse gas emitters coupled with
reduction in the quantities of allowances
issued each year;
• RE goals: mandates requiring load-serving
entities to source a specified proportion of
energy sold from renewable sources;
• feed-in tariffs (FiTs): guaranteed wholesale
prices for RE coupled with a requirement
that load-serving entities take renewable
power whenever it is available;
• tax credits: credits against taxable income
for generation or installation of RE;
• the development of smart grids: advances
in the architecture, functionality and
regulation of electricity grids so as to
enable higher penetrations of RE; and
• removal of long-standing fossil fuel
subsidies.
We will discuss the major public policy drivers
behind RE development in turn.
2.1.1 Decarbonization
The need to address global climate change,
a worldwide environmental phenomenon that
will affect everyone on the planet, is the most
public driving force for RE deployment. The
Intergovernmental Panel on Climate Change
(IPCC), the world’s leading authority on climate
change science, states in its Synthesis Report
to the Fourth Assessment Report that “warming
of the climate system is unequivocal, as is
now evident from observations of increases
in global average air and ocean temperatures,
widespread melting of snow and ice and rising
global average sea level”, and that “most of the
global average warming over the past 50 years
is very likely due to anthropogenic greenhouse
gas (GHG) increases and it is likely that there is a
discernible human-induced warming averaged
over each continent (except Antarctica).”](https://image.slidesharecdn.com/gridintegration-140608024623-phpapp02/85/Grid-Integration-Of-Large-Scale-14-320.jpg)
![15
The MSB EEE Report notes that CO2
emissions
related to energy use account for 70 % of total
GHG emissions, and that emissions related
to electricity generation approach half of that
[msb10]. Consequently, governments have
enacted policies to curb GHG emissions from
the power sector. Because electricity generated
from RE produces no GHG emissions,
increasing penetrations of RE onto the electrical
grid contribute to a decarbonization of the
electricity system: a reduction in GHGs emitted
per unit of energy produced. Energy system
decarbonization in turn slows the increase in
concentrations of GHGs in the atmosphere and
thereby mitigates the resultant radiative forcing
of the climate system.
In recent years, the ostensible progress of climate
change policies has stalled at the international
level, with a lack of hard commitments to
emission reductions from some large emitters.
Nevertheless, many countries have developed
incremental policies to promote RE development
in the absence of full international agreement. For
example, nearly 30 states in the USA have enacted
their own RE goals in the absence of federal
action; Germany has long used aggressive feed-in
tariff requirements that oblige power companies
to purchase renewably-generated energy at
fixed rates; and China has set a capacity goal of
150 GW-180 GW of wind power and 20 GW of
solar photovoltaic (PV) power for 2020. These
goals and policies will result in significant growth in
RE that will affect the operation of the power grid.
2.1.2 Energy security
Driven by the wind, the sun and the waves, RE
has no fuel costs. This zero-fuel-cost aspect
of RE manifests itself in two benefits. First,
average energy costs tend to decline over time
for renewable generation, as variable costs are
limited to operations and maintenance and do not
include fuel. Secondly, RE assets are insulated
from fluctuations in fossil fuel prices, which are
historically volatile and subject to geopolitical
disruptions. Coal, gas and oil-fired generation
costs, in contrast, increase when the cost of the
relevant fuel increases. Figure 2-1 depicts the
International Energy Agency’s (IEA) projections1
for the share of world electricity generation by
fuel up to 2035, and shows a displacement of
coal and oil-based generation’s shares by wind,
biomass and other renewables as governments
continue to promote RE.
Because fossil fuel supplies are both unevenly
distributed and ultimately exhaustible, many
countries have identified a long-term energy-
security proposition in gradually decreasing
dependenceonthemintheproductionofelectricity.
In comparison to fossil resources, renewable
resources are better distributed throughout the
world and do not diminish as they are used. A
country’s investment in RE results in a zero-fuel-
cost generation resource that is domestically
located. Thus even countries with substantial fossil
fuel resources, such as China, have set aggressive
wind power targets. And despite a recent boom
in natural gas production in the USA, states have
made no indication of any intent to remove RE
goals. RE can also prove useful for short-term
energy security concerns. Many electric utilities
have diversified their generation mixes with
renewables so as to hedge against volatile fossil
fuel prices on the oil, gas and coal markets.
1
These projections come from IEA’s New Policies
Scenario, the centrepiece of IEA’s analysis in its
World Energy Outlook. The new policies scenario
accounts for future policy developments that drive
world energy sources toward greater sustainability.](https://image.slidesharecdn.com/gridintegration-140608024623-phpapp02/85/Grid-Integration-Of-Large-Scale-15-320.jpg)
![16 S E C T I O N 2
RE generation: the present, the future and the integration challenges
2.1.3 Expanding energy access
Energy demand in developing countries is
growing rapidly (see Figure 2-2). IEA’s New
Policies Scenario projects electricity demand in
non-OECD countries to increase at a compound
average annual growth rate (CAAGR) of 3.5 %
to 2035. Total non-OECD electricity demand
nearly triples from 8 000 TWh in 2009 to almost
20 000 TWh by 2035 (see Figure 2-3). Asian
electricity demand grows the most rapidly,
with a 4.2 % CAAGR in the same period. In
addition to the needs outlined in the previous
subsections for cleaner energy and more
secure energy, the world simply needs more
energy as more people in the developing world
gain access to it.
As global energy demand increases, RE
provides one means among many of adding
energy assets to the system alongside growth
of other resources. IEA’s New Policies Scenario
projects a near tripling of global use of RE, from
3 900 TWh in 2009 to 11 100 TWh in 2035,
and growth in renewables accounts for nearly
half of the total increase in generation by 2035.
Indeed, under this scenario, a full third of global
electricity generation will be supplied by RE
(including hydroelectricity) by 2035. Figure
2-4 provides a breakdown of incremental
renewables growth by technology. Note the
large increase in wind power.
2009
2020
2035
20 043 TWh
27 881 TWh
36 250 TWh
0 %
Coal Gas Oil Nuclear Biomass Hydro Wind Other renewables
20 % 40 % 60 % 80 % 100 %
Figure 2-1 – Share of world electricity generation by fuel in IEA’s New Policies Scenario
[weo11]](https://image.slidesharecdn.com/gridintegration-140608024623-phpapp02/85/Grid-Integration-Of-Large-Scale-16-320.jpg)
![17
18 000
16 000
14 000
12 000
10 000
8 000
6 000
4 000
2 000
0
Other OECD
Mtoe
European Union
United States
Other non-OECD
Middle East
India
China
Inter-regional
(bunkers)
1990 2000 2010 2020 2030 2035
Figure 2-3 – Electricity demand by region in IEA's WEO 2011 Scenario (TWh)
[weo11]
Figure 2-2 – World primary energy demand by region in IEA’s New Policies Scenario
[weo11]](https://image.slidesharecdn.com/gridintegration-140608024623-phpapp02/85/Grid-Integration-Of-Large-Scale-17-320.jpg)
![18 S E C T I O N 2
RE generation: the present, the future and the integration challenges
While a world where a majority of electricity
generation is based on renewable sources
is far beyond the horizon, it is clear that the
confluence of government policy, utility planning
and global demand growth has the potential
to increase penetrations of RE substantially
on electricity grids worldwide. This shift in
generation portfolios will have profound effects
on the operation of the grid, which will in turn
affect the operation of RE resources themselves
as well as the operation of other resources and
equipment connected to the grid.
2.2 Present status of RE
generation and future
projections
At 3 902 TWh, RE accounted for 19.46 % of
the world’s electricity generation in 2009.
Hydroelectricity, by far the largest contributor
among the renewables, accounted for over
83 % of that share. Biomass, wind and solar PV
combined accounted for only 15 % of the global
8 000
7 000
6 000
5 000
4 000
3 000
2 000
1 000
0
TWh
2015 2020 2025 2030 2035
30 %
32 %
34 %
36 %
38 %
40 %
42 %
44 %
46 %
Other renewables
Solar PV
Biomass and waste
Hydro
Wind
Share of renewables
in total increase in
generation (right axis)
Figure 2-4 – Incremental global renewables-based electricity generation relative to 2009 by
technology in IEA’s New Policies Scenario
[weo11]
RE contribution, or 2.9 % of world electricity
generation [weo11]. Thus, while RE as a whole
comprises a substantial portion of global
electricity generation, the proportion of RE that
comes from variable sources such as wind
and solar is still relatively limited. Consequently
most power system operators to date have had
relatively small amounts of variable generation
to integrate. As we examine here, however, the
situation may change materially by 2035.
The IEA projects that global electricity production
from renewables (including hydroelectricity)
will grow to 8 108 TWh by 2025, an over-
100 % increase from 2009. By 2035, that figure
rises to 11 100 TWh, as illustrated in Figure
2-5. These estimates are based on IEA’s New
Policies Scenario, which takes into account
recently announced commitments and plans,
even if they are yet to be formally adopted
and implemented [weo11]. The New Policies
Scenario is the central scenario for IEA’s World
Energy Outlook 2011, and assumes a global
CO2
price of 30 USD to 45 USD per tonne.](https://image.slidesharecdn.com/gridintegration-140608024623-phpapp02/85/Grid-Integration-Of-Large-Scale-18-320.jpg)
![19
0
2 000
4 000
6 000
8 000
10 000
12 000
TWh
1990
2 317
3 902
5 394
6 712
8 108
9 540
11 100
2009 2015 2020 2025 2030 2035
3 000
2 000
1 000
0
US
OECD
Japan
Russia
China
India
MiddleEast
Africa
Latin
Brazil
1990
2009
2015
2020
2025
2030
2035Country/Region
TWh
Figures 2-5 and 2-6 – RE generation globally and by country/region to 2035
[weo11]
Figure 2-6 displays the projected growth of RE
generation by region or country [weo11]. Notably,
while the USA, OECD Europe, Latin America
and China have relatively similar numbers
in 2009, the growth rates are dramatically
different. China’s growth substantially outpaces
OECD Europe’s, and OECD Europe’s growth
substantially outpaces that of the USA and
Latin America. Africa and the Middle East
see relatively little growth in renewables. India
exhibits an aggressive growth rate, but begins
2009 with smaller numbers than other regions,
and so does not see the same degree of
absolute growth as neighbouring China.
It is important to note that charts in this
subsection referring to present RE capacities
reflect the state of the market in 2009, which
is the most recent year for which present data
is available from the IEA. However, RE capacity
has already expanded substantially since then,
with some notable developments in 2010. We
discuss these developments in the text when
relevant.
2.2.1 Wind energy
Wind energy plants around the world produced
273 TWh of electricity in 2009, from an estimated
installed capacity of 159 GW. IEA's estimates
of 2009 wind energy generation and capacity
by region and country are provided in Figures
2-7 and 2-8 [weo11]. Wind power developments
in 2010 have been substantial: China installed
over 16 GW of new wind capacity in 2010,
bringing its total to 42 GW. This exceeded the
US 2010 total of 40 GW, and made China the
world leader in wind capacity for the first time.
Europe installed nearly 10 GW of wind in 2010,
bringing its total capacity to 86 GW, over half of
which is located in Germany and Spain [smp11].](https://image.slidesharecdn.com/gridintegration-140608024623-phpapp02/85/Grid-Integration-Of-Large-Scale-19-320.jpg)
![20 S E C T I O N 2
RE generation: the present, the future and the integration challenges
IEA’s New Policies Scenario projects 1 282 TWh
of annual wind-generated electricity globally by
2020 [weo11], a 369 % increase from 2009. By
2030 that figure reaches 2 182 TWh, a near-
doubling of the 2020 estimate over the course
of a decade, as shown in Figure 2-9 [weo11].
In terms of capacity, IEA projects growth from
159 GW in 2009 to 582 GW in 2020, reaching
1 102 GW by 2035, as shown in Figure 2-10
[weo11].
160
140
120
100
80
US
OECDEurope
Japan
Russia
China
India
MiddleEast
Africa
LatinAmerica
Brazil
60
40
20
0
74 35
76
2 0 0 1 1 1
26
11
135
3 0 0 2 2 1
27
Country/Region
US
OECDEurope
Japan
Russia
China
India
MiddleEast
Africa
LatinAmerica
Brazil
0
10
20
30
40
50
60
70
80
Country/Region
TWh
GW
18
0
500
1 000
1 500
2 000
2 500
3 000
4
273
835
1 282
159
397
582
752
921
1 102
1 724
2 182
2 703
1990
2009
2015
2020
2025
2030
2035
2009
2015
2020
2025
2030
2035
TWh
0
200
400
600
800
1 000
1 200
GWh
Figures 2-7 and 2-8 – Wind energy generation and capacity by country/region in 2009
[weo11]
Figures 2-9 and 2-10 – Global wind energy generation and capacity projections to 2035
[weo11]](https://image.slidesharecdn.com/gridintegration-140608024623-phpapp02/85/Grid-Integration-Of-Large-Scale-20-320.jpg)
![21
0
100
200
300
400
500
600
700
800
900
US
OECD
Japan
Russia
China
India
MiddleEast
Africa
Latin
Brazil
1990
2009
2015
2020
2025
2030
2035
Country/Region
TWh
Figure 2-11 – Wind energy generation to 2035 by region/country
[weo11]
Wind capacity growth over this period is
dominated overwhelmingly by China, OECD
Europe and the USA, as shown in Figure 2-11.
Indeed, while the current disparity between
these countries and the rest of the world in wind
capacity is stark, it is dwarfed by future growth
estimates, by which the leaders will outpace the
others by orders of magnitude. OECD Europe
and China maintain growth in lockstep through
2035, leaving the USA somewhat behind, though
still a major player. It is also apparent that Latin
America’s growth in renewables overall does not
translate to a significant growth in wind.
Regionally, the OECD European countries
together show the strongest wind growth, slightly
outpacing China. 76 GW of European wind
power produced 135 TWh of electricity in 2009
[weo11]. Germany, Spain, Italy and France are
the major contributors to wind energy capacity
in this region [gwe10]. In Europe, the majority of
wind farms developed during the past ten years
have been onshore and small-capacity. With
many wind-rich areas now thoroughly exploited,
European wind developers are turning their
attention to large-capacity offshore wind farms
with centralized integration to the power grid.
By 2020, IEA projects wind capacity of 209 GW
and 449 TWh of generation in Europe. By 2030,
capacity reaches 289 GW and generation
reaches 675 TWh [weo11]. Germany has set a
target of 45.75 GW of wind capacity for 2020
[ger10], and Spain a target of 38 GW [esp10].
These plans contribute substantially to Europe’s
regional estimate, particularly in the next decade.
If we examine single countries rather than
regions, China is the world’s tour de force in
wind power development. 26 GW of wind power
supplied 27 TWh of electricity in China in 2009,
ranking it third globally in wind capacity. A year
later, China had jumped into first place with a
total of 42 GW in 2010 [smp11] [weo11]. China
is set to lead the world in wind generation and
wind capacity by 2035. The IEA predicts China
will produce 388 TWh of electricity from wind in
2020, and the National Energy Administration
(NEA) of China has set a target of 150-180 GW of
wind capacity by the same date [sgc12], which
matches IEA’s estimate of China’s installed wind
capacity of 180 GW. By 2030, IEA projects that
China will reach 280 GW of wind capacity, just
behind estimates for the combined European
countries [weo11].](https://image.slidesharecdn.com/gridintegration-140608024623-phpapp02/85/Grid-Integration-Of-Large-Scale-21-320.jpg)
![22 S E C T I O N 2
RE generation: the present, the future and the integration challenges
US wind capacity stood at 35 GW in 2009,
generating 74 TWh of electricity [weo11]. Most
of US wind capacity is concentrated in the
states of Texas, Iowa, California, Michigan
and Washington, and is onshore [wpa12].
As a result of declining energy demand, an
economic recession and a precipitous drop in
North American natural gas prices, the USA
did not keep pace with Europe and China in
2010, installing only 5 GW to Europe’s 10 GW
and China’s 16 GW. Still, the USA is expected to
remain a significant player in wind. IEA projects
that US wind generation will grow to 165 TWh
by 2015, more than double its 2009 value. By
2030, the capacity grows to 388 TWh from
151 GW [weo11].
Japan’s 2 GW of wind capacity produced
3 TWh of electricity in 2009 [weo11]. IEA
estimates Japanese wind capacity to grow to
7 GW by 2020, producing 18 TWh of electricity,
and to 15 GW by 2030, producing 41 TWh of
electricity [weo11]. Though these numbers are
dwarfed by those from geographically larger
regions such as China, OECD Europe and the
USA, it is worth noting that the expected rate
of increase of wind generation and capacity on
the Japanese grid is dramatic: generation is
expected to grow by 650 % between 2009 and
2030 under the IEA's New Policies Scenario.
The figures above do not differentiate between
onshore and offshore wind. However, the sorts
of integration challenges presented may differ
between onshore and offshore wind projects,
specifically with regard to the need for special
transmission technologies for offshore plants. We
therefore briefly examine the offshore segment
of the wind market, which at present exists
almost entirely in Europe, with a few projects in
China. Europe’s offshore wind capacity stood
at 4 GW at the end of 2011, with an additional
6 GW under construction at the time and 17 GW
consented to by EU member states [ewe11]. The
majority of these projects are in the UK, Denmark
and Germany, with some projects in Belgium,
the Netherlands and Sweden. The European
Wind Energy Association (EWEA), an industry
association, projects that Europe will have 40 GW
of offshore wind by 2020 producing 148 TWh of
energy, and 150 GW producing 562 TWh by 2030.
While industry estimates must be taken with the
proverbial grain of salt, these numbers at least
plausibly harmonize with IEA’s OECD European
wind (off- and onshore) projections of 209 GW by
2020 and 298 GW by 2030. EWEA itself identifies
the availability of high voltage direct current
transmission (HVDC) as a critical bottleneck for
the development of offshore wind in Europe.
2.2.2 Solar energy
Grid-relevant solar energy technologies can be
divided into two types: PV and concentrated
solar power (CSP). PV generates electricity
directly, converting sunlight to electricity
through a semiconductor such as silicon. CSP
technologies produce electricity by reflecting
and concentrating sunlight onto a fluid, which
then heats and boils water, the steam from which
then drives a turbine that produces electricity.
Presently, CSP has a lower contribution to RE
production than solar PV. We will discuss each
market in turn, beginning with the larger PV
market.
Solar PV generated 20 TWh of electricity from
22 GW of global capacity in 2009 (see Figures 2-12
and 2-13) [weo11]. The OECD Europe region far
surpassed all other regions in both capacity
and generation, despite its relatively weak solar](https://image.slidesharecdn.com/gridintegration-140608024623-phpapp02/85/Grid-Integration-Of-Large-Scale-22-320.jpg)
![23
resource. This apparent discrepancy is explained
by highly favourable policy environments for solar
PV in many European countries.
Though solar PV capacity is many times smaller
than wind capacity at present, it is expected to
grow at a faster pace than wind over the next
several decades. The IEA projects solar PV
generation of 230 TWh from 184 GW of capacity
in 2020, an over 1000 % generation increase from
2009. By 2030, those figures reach 551 TWh and
385 GW, more than double the 2020 estimates.
Figures 2-14 and 2-15 display IEA's projections
for solar PV energy production to 2035 [weo11].
0
2
4
6
8
10
12
14
16
0
2
4
6
8
10
12
14
16
18
TWh
GW
2
14
17
3
2
3
US OECD
Europe
Country/Region
Japan US OECD
Europe
Country/Region
Japan
0
100
200
300
400
500
600
700
800
1990
US OECD
Europe
Japan Russia China India Middle
East
Africa Latin
America
Brazil
2009 2015 2020 2025 2030 2035
TWhTWh
0 20
126
230
369
551
741
1990
2009
2015
2020
2025
2030
2035
0
20
40
60
80
100
120
140
160
180
Country/Region
Figures 2-12 and 2-13 – Solar PV energy generation and capacity in 2009 by country/region
[weo11]
Figures 2-14 and 2-15 – Energy generation from solar PV globally and by country/region
[weo11]](https://image.slidesharecdn.com/gridintegration-140608024623-phpapp02/85/Grid-Integration-Of-Large-Scale-23-320.jpg)
![24 S E C T I O N 2
RE generation: the present, the future and the integration challenges
In the OECD Europe region, solar PV produced
14 TWh of electricity from 17 GW of solar
PV capacity in 2009 [weo11]. Favourable
government policies and pricing have led to
higher penetrations, particularly in Spain, Italy
and Germany. In Germany, the government has
opted for a feed-in tariff, in which the utilities
pay the owner of a solar PV system a set tariff
for renewable power over a period of time
[obo12]. Consequently, solar PV provided 3 %
of the total power in Germany in 2011 [eck11].
Germany led the world in PV capacity in 2009
with 9 785 MW. Spain’s 2009 capacity figure,
at 3 386 MW, was lower but still substantial in
comparison to other countries [epa10]. Italy
has ramped up solar PV capacity dramatically
since then, reaching 12 750 MW and producing
10 TWh of energy in 2011 [gse12].
IEA projects 90 TWh from 84 GW of OECD
European capacity by 2020 and 139 TWh from
115 GW by 2030 [weo11]. Germany expects
its solar PV capacity to reach 52 GW by 2020
[ger10], and Spain estimates 8.4 GW by the
same year [esp10]. It is worth noting that
Europe’s generation capacity factors (the ratio of
energy generated from a given unit of power) for
solar PV are lower than those for the USA. This
disparity is explained by differences in the quality
of the resource: the USA receives much more
sunlight than Europe. Nevertheless, Europe’s
policy environment provides substantially more
support to solar power, particularly in Germany
and Spain, than does the US policy environment,
explaining the capacity estimate differences as
well as the ultimately higher generation estimates
for Europe.
US solar PV generated 2 TWh of electricity from
2 GW of capacity in 2009 [weo11]. IEA estimates
US solar PV generation at 38 TWh from 25 GW
of capacity in 2020 and 81 TWh from 50 GW of
capacity in 2030. [weo11] Note that the 2030
estimate for US solar PV capacity is roughly a
third of estimated US wind power capacity in
the same year.
Japan generated 3 TWh of its electricity from
solar PV sources in 2009 from 3 GW of capacity
[weo11]. By 2010, Japan had increased its
solar PV capacity to 3.6 GW. This increase
is attributable to a subsidy programme for
residential PV system installations and another
programme to purchase surplus PV power from
small systems at double the retail electricity
price [yam11]. IEA projects 18 TWh of electricity
from 17 GW of Japanese solar PV by 2020, and
32 TWh from 28 GW by 2030 [weo11].
China did not produce any significant amounts
of electricity from solar PV in 2009, but
that is changing rapidly, as it has become a
manufacturing leader in the technology. IEA
projects that China will produce 29 TWh from
20 GW of solar PV by 2020, and 89 TWh from
58 GW by 2030 [weo11]. This places China
behind the USA in solar PV generation in
2020, but ahead of it by 2030 [weo11]. China’s
National Development and Reform Commission
has set targets for China to achieve 10 GW
of solar capacity in 2015, and 50 GW of solar
capacity installed by 2020 [won11].
CSP’s market is much smaller than wind
power or solar PV, and it is less challenging
to integrate into the power system due to its
thermal aspects, which reduce variability in
output. CSP produced 1 TWh of electricity in
2009 from a global capacity of 1 GW, located
primarily in the USA, though Spain has since
taken the lead [weo11].](https://image.slidesharecdn.com/gridintegration-140608024623-phpapp02/85/Grid-Integration-Of-Large-Scale-24-320.jpg)
![25
CSP generation estimates are lower than those
for PV, but exhibit similar strength in growth
rates. IEA projects 52 TWh of CSP-generated
energy from 14 GW of capacity in 2020, and
167 TWh from 45 GW in 2030. Figure 2-16
displays IEA’s projections for global CSP
generation to 2035 [weo11].
Spain led the world in 2010 in CSP capacity at
over 632 MW. Spanish CSP capacity grew by
400 MW in 2010 due to a Royal Decree from the
Spanish government that provided incentives
for solar energy. In 2011, it began construction
on nearly 1 GW of additional CSP capacity
[rep11]. IEA projects 14 TWh of electricity from
4 GW of CSP sources in OECD Europe by 2020.
In 2030, that rises to 36 TWh from 10 GW. The
Spanish government, however, estimates that
Spain alone will install 5 GW of CSP to produce
15.35 TWh by 2020, more than IEA’s projection
for all of Europe [esp10].
IEA projections for US CSP closely track those
for OECD Europe, with 14 TWh from 4 GW in
2020, and 30 TWh from 8 GW in 2030.
2.3 RE grid integration challenges
Wind and solar generation both experience
intermittency, a combination of non-controllable
variability and partial unpredictability, and
depend on resources that are location-
dependent [per11]. These three distinct aspects,
explained below, each create distinct challenges
for generation owners and grid operators in
integrating wind and solar generation.
• Non-controllable variability: Wind and
solar output varies in a way that generation
operators cannot control, because wind
speeds and available sunlight may vary
from moment to moment, affecting
moment-to-moment power output. This
fluctuation in power output results in the
need for additional energy to balance
supply and demand on the grid on an
instantaneous basis, as well as ancillary
services such as frequency regulation
and voltage support. Figure 2-17 provides
a graphical example of hourly wind power
variability.
0
100
200
300
400
1990
1 1
24
52
92
167
307
2009 2015 2020 2025 2030 2035
TWh
Figure 2-16 – Global CSP energy generation to 2035
[weo11]](https://image.slidesharecdn.com/gridintegration-140608024623-phpapp02/85/Grid-Integration-Of-Large-Scale-25-320.jpg)
![26 S E C T I O N 2
RE generation: the present, the future and the integration challenges
• Partial unpredictability: The availability
of wind and sunlight is partially
unpredictable. A wind turbine may only
produce electricity when the wind is
blowing, and solar PV systems require the
presence of sunlight in order to operate.
Figure 2-18 shows how actual wind power
can differ from forecasts, even when
multiple forecast scenarios are considered.
Unpredictability can be managed through
improved weather and generation
forecasting technologies, the maintenance
of reserves that stand ready to provide
additional power when RE generation
produces less energy than predicted, and
the availability of dispatchable load to “soak
up” excess power when RE generation
produces more energy than predicted.
• Location dependence: The best wind
and solar resources are based in specific
locationsand,unlikecoal,gas,oiloruranium,
cannot be transported to a generation site
that is grid-optimal. Generation must be co-
located with the resource itself, and often
these locations are far from the places
where the power will ultimately be used.
New transmission capacity is often required
to connect wind and solar resources to
the rest of the grid. Transmission costs
are especially important for offshore wind
resources, and such lines often necessitate
the use of special technologies not found
in land-based transmission lines. The global
map in Figure 2-19 displays the latest data
on mean land-based wind speeds around
the world.
Figure 2-17 – Hourly wind power output on 29 different days in April 2005 at the Tehachapi
wind plant in California
[haw06]](https://image.slidesharecdn.com/gridintegration-140608024623-phpapp02/85/Grid-Integration-Of-Large-Scale-26-320.jpg)
![27
Figure 2-18 – Example of a day-ahead forecast scenario tree for the wind power forecast for
the PJM region of the United States
[mei10]
Figure 2-19 – Global mean wind speed at 80 m altitude
[tie12]
0
5000
10000
15000
20000
25000
30000
1 3 5 7 9 11 13 15 17 19 21 23 25 27 29 31 33 35Forecast hour [h]
Windpowerproduction[MW]
Scenario 1 Scenario 2 Scenario 3 Scenario 4 Scenario 5
Scenario 6 Expected Value Realized Value](https://image.slidesharecdn.com/gridintegration-140608024623-phpapp02/85/Grid-Integration-Of-Large-Scale-27-320.jpg)
![28 S E C T I O N 2
RE generation: the present, the future and the integration challenges
Because the presence of wind and sunlight are
both temporally and spatially outside human
control, integrating wind and solar generation
resources into the electricity grid involves
managing other controllable operations that may
affect many other parts of the grid, including
conventional generation. These operations
and activities occur along a multitude of time
scales, from seconds to years, and include new
dispatch strategies for rampable generation
resources, load management, provision of
ancillary services for frequency and voltage
control, expansion of transmission capacity,
utilization of energy storage technologies, and
linking of grid operator dispatch planning with
weather and resource forecasting [per11].
The essential insight to integration of variable
RE is that its variability imposes the need for
greater flexibility on the rest of the grid, from
other (controllable) generators to transmission
capacity to loads. Discussion of variable
generation operation alone is insufficient to
describe the full impact of high penetrations
of RE on power system operation. Thus this
report explores RE integration from both a plant
operator and a system operator perspective,
so as to identify the full range of operations
involved.
2.3.1 Non-controllable variability
Variability in the context of wind and solar
resources refers to the fact that their output is
not constant. It is distinct from unpredictability,
which we discuss in the following section. Even
if operators could predict the output of wind
and solar plants perfectly, that output would still
be variable, and pose specific challenges to the
grid operator, which we introduce here [per11].
On the seconds to minutes time scale, grid
operators must deal with fluctuations in frequency
and voltage on the transmission system that, if left
unchecked, would damage the system as well as
equipment on it. To do so, operators may order
generators to inject power (active or reactive) into
the grid not for sale to consumers, but in order to
balance the actual and forecasted generation of
power, which is necessary to maintain frequency
and voltage on the grid. These ancillary services go
by a plethora of names and specific descriptions.
Typical services for an impressionistic overview
include:
• frequency regulation: occurs on a
seconds-to-minutes basis, and is done
through automatic generation control
(AGC) signals to generators;
• spinning reserves: generators available to
provide power typically within 10 minutes.
These reserves are used when another
generator on the system goes down or
deactivates unexpectedly;
• non-spinning reserves: these generators
serve the same function as spinning
reserves, but have a slower response time;
• voltage support: generators used for
reactive power to raise voltage when
necessary;
• black-start capacity: generators available
to re-start the power system in case of a
cascading black-out.
Additionally, grid operators must track loads
– demand for electricity on the consumption
side of the grid – and ensure that generation
matches load at all times. This load following
function becomes particularly important at
times of day when demand for electricity
increases substantially, such as morning, a hot
afternoon, or evening. Load following may be
provided through a class of ancillary service or](https://image.slidesharecdn.com/gridintegration-140608024623-phpapp02/85/Grid-Integration-Of-Large-Scale-28-320.jpg)
![29
through a “fast energy market”, depending on
the system operator.
These functions are not new. Grid operators
have been regulating frequency and voltage,
maintaining reserves and following shifts in load
since the development of the electricity grid.
This is because loads themselves are variable,
and even conventional, controllable generation
experiences problems and cannot perform as
scheduled all of the time. Consumers demand
electricity in ways that, while predictable, are not
controllable and have some degree of variability.
Thus wind and solar generation does not introduce
entirely novel problems with which operators have
never grappled. Indeed, at low penetrations, the
integration challenges are primarily device and
local-grid specific, such as subsynchronous
resonance and harmonics, which the turbine itself
may cause. These issues are explained in greater
detail in section 3, and their solutions tend to be
device-specific rather than grid-level.
However, high penetrations of wind and solar
generation will add more variability to the energy
system than grid operators have traditionally
managed in the past, and thus increase demand
forancillaryservicesandbalancingenergyoverall.
It is more difficult, and sometimes impossible, to
manage such challenges at the device level, and
so grid-level actions, technologies and strategies
are often needed. Wind and solar resources in
sufficient amounts may also complicate load
following functions when large demand shifts
coincide with weather events that alter power
output from wind or solar resources. Grid
operators located in more remote regions and
serving smaller loads may have less flexibility
to provide ancillary services and load following
than their larger counterparts. Compounding
matters, plentiful RE resources are often located
in these remote locations. The IEA and other
bodies have recommended consolidation of grid
operators, in order to integrate RE sources over
larger areas and so reduce the variance of the
power produced, as well as easing of market
restrictions on sales of ancillary services as a
solution to this problem [iea09].
2.3.2 Partial unpredictability
Partial unpredictability, also called uncertainty,
is distinct from variability. The variability of wind
and solar generation is ever-present, a result of
reliance on the ever-changing wind and sun, and
affects the system at the moment-to-moment
time scale as a cloud passes over a PV plant
or the wind drops. Partial unpredictability, on
the other hand, refers to our inability to predict
with exactness whether the wind and sun will be
generally available for energy production an hour
or a day from now. This hour-to-day uncertainty
is significant because grid operators manage
the great majority of energy on the grid through
“unit commitment”, the process of scheduling
generation in advance, generally hours to a full
day ahead of time, in order to meet the expected
load. When actual production does not match
the forecast, the grid operator must balance the
difference. RE generation increases the cost of
this function by increasing the spread between
predicted and supplied energy, a cost that is
ultimately borne by consumers.
Unit commitment at present is largely
deterministic, meaning that once a generator is
scheduled to run, its full capacity is expected
to be available for use. This practice reflects
the relative predictability and controllability of
traditional coal, gas and hydropower generation
resources. Operators ensure the availability of](https://image.slidesharecdn.com/gridintegration-140608024623-phpapp02/85/Grid-Integration-Of-Large-Scale-29-320.jpg)


![32 S E C T I O N 3
Present: state of the art in integrating large-capacity RE
Figure 3-1 – A standard WTG with three blades and horizontal axis
(SGCC)
3.1 General
Although on a system-wide level RE power
plants generate electricity just like any other
power plants, RE power has quite distinctive
characteristics in generation, transmission
and operation technology when compared to
conventional generation. Understanding these
distinctive characteristics and their interaction
with the other parts of the power system is the
basis for the integration of large-capacity RE
power in the grid.
In this chapter, the state of the art of the
technologies and practices related to large-
capacity RE integration is described to facilitate
the understanding of their interaction with the
power grid. This discussion is further divided
into the RE generation technology itself, the
transmission technology and the operational
technology and practices.
3.2 RE generation technology
3.2.1 Wind power generation
1) Basics of wind power generation
Wind turbine generators (WTGs) extract energy
from wind and convert it into electricity via an
aerodynamic rotor, which is connected by a
transmission system to an electric generator
[iea11]. Today’s mainstream WTGs have three
blades rotating on a horizontal axis, upwind of
the tower (see Figures 3-1 and 3-2). Two-blade
WTGs (see Figure 3-3) and vertical-axis WTGs
(see Figure 3-4) are also available.](https://image.slidesharecdn.com/gridintegration-140608024623-phpapp02/85/Grid-Integration-Of-Large-Scale-32-320.jpg)
![33
In general, a WTG can begin to produce power
in winds of about 3 m/s and reach its maximum
output around 10 m/s to 13 m/s. Power output
from a WTG increases by the third power of
wind speed, i.e. a 10 % increase in wind speed
increases available energy by 33 %, and is
directly proportional to the rotor-swept area (the
area swept by the rotating blades). Power output
can be controlled both by rotating the nacelle
horizontally (yawing) to adapt to changes in
wind direction, and rotating the blades around
their long axes (pitching) to adapt to changes in
wind strength.
The capacity of WTGs has doubled
approximately every five years, but a slowdown
in this rate is likely for onshore applications due
to transport, weight and installation constraints.
Typical commercial WTGs at present have a
capacity of 1.5 MW-3 MW; larger ones can
reach 5 MW-6 MW, with a rotor diameter of up
to 126 metres [iea11].
Since a single WTG has limited capacity, much
less than a conventional power generator, a wind
power plant (WPP, usually called “wind farm”)
Rotor Blade
How Wind Power Works Horizontal-axis Turbine
Nacelle
Hub
Tower
Transformer
Rotor Hub
Low-speed
Shaft
High-speed
Shaft
Gearbox
Brake Brake Generator
Figure 3-3 – Two-blade WTG
(Ming Yang)
Figure 3-4 – Vertical-axis turbine
(Xu Ji)
Figure 3-2 – Structure diagram of a WTG
(HowStuffworks)](https://image.slidesharecdn.com/gridintegration-140608024623-phpapp02/85/Grid-Integration-Of-Large-Scale-33-320.jpg)
![34 S E C T I O N 3
Present: state of the art in integrating large-capacity RE
normally consists of many WTGs connected
together by overhead lines or cables. Their
power output is collected and transmitted to
the grid through an alternating current (AC) or
Power Grid
Step-up
transformer
Wind
turbine
Overhead
line or cable
Low voltage busbar
High voltage busbar
Figure 3-5 – Structure diagram of a wind farm
(SGCC)
direct current (DC) line, after voltage step-up
at the substation in the WPP (see Figure 3-5).
Some WPPs now have a capacity comparable
to that of conventional power generators.
2) Types and characteristics of major
WTGs
WTGs currently in operation mainly include
the following four types. Each type has some
unique characteristics due to its features in
topology [ewe05] [ner09] [sge11].
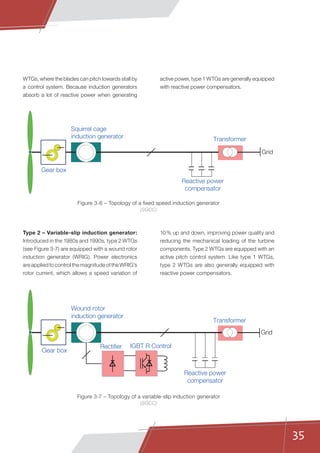
Type 1 – Fixed speed induction generator:
Introduced and widely used in the 1980s, type 1
WTGs (see Figure 3-6) are based on a squirrel
cage induction generator (SCIG). They can only
slightly vary their rotation speed (1 %-2 %), i.e.
they are almost “fixed speed”, thus their output
fluctuates as wind speed varies. To alleviate
this problem, a double-speed version of the
type 1 WTG was developed. Original type 1 WTGs
have few control options but passive stall. Active
stall designs can be adopted in improved type 1](https://image.slidesharecdn.com/gridintegration-140608024623-phpapp02/85/Grid-Integration-Of-Large-Scale-34-320.jpg)
![37
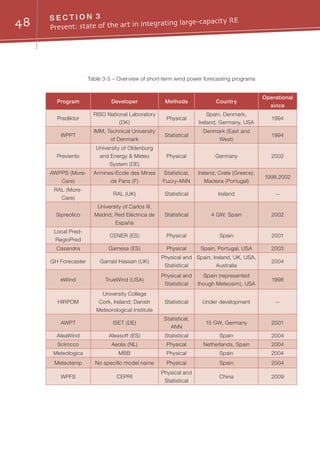
3) Offshore wind power generation
Offshore sites generally have better wind
resources than onshore sites, so WTGs
installed in offshore sites can achieve
significantly more full-load hours. Offshore
wind farm development can also relax many
constraints faced by onshore wind farms, such
as transport and land occupation. Today’s
offshore WTGs are essentially large onshore
ones with, for example, enhanced corrosion
protection. A specific offshore wind power
industry is developing and a specific offshore
supply chain is emerging [iea11]. A number of
WTG manufacturers have now developed large
WTGs with a capacity of more than 3 MW for
the offshore wind power market, and some
have been installed for trials. Future WTGs will
be even larger and specially tailored for offshore
applications. Offshore wind farms will also
be large in scale compared to onshore wind
farms. For instance, several planned projects
in the North Sea and the East China Sea have
capacities of well over 1 000 MW.
However, a number of issues make the
construction of offshore wind farms more
challenging and costly than onshore wind
farms, such as support structures for the large
turbines, difficult weather conditions, lengthy
and costly transmission cables and extended
transmission systems, high wind speed and
deep water, environmental issues and the
impact on other marine stakeholders [iea11].
In spite of this, offshore wind power is growing
and will grow more rapidly in the future with
improvements in the technology.
Grid
Synchronous
or induction
generator
Gear box
Transformer
Back-to-Back IGBT
Power converter
Figure 3-10 – The Shanghai Donghaidaqiao
offshore wind farm
(SGCC)
Figure 3-9 – Topology of a full-power conversion WTG
(SGCC)](https://image.slidesharecdn.com/gridintegration-140608024623-phpapp02/85/Grid-Integration-Of-Large-Scale-37-320.jpg)
![38 S E C T I O N 3
Present: state of the art in integrating large-capacity RE
3.2.2 PV power generation
1) Basics of PV power generation
Made of semiconductor materials, a photovoltaic
(PV) cell directly converts solar energy into
direct-current electricity. When sunlight shines
on an individual PV cell, the energy that the
cell absorbs from the sunlight is transferred to
electrons in the atoms of the semiconductor
material. These energized electrons then
become a part of the electrical current in the
circuit, generating electricity.
PV cells are connected in series and in parallel
to one another to form PV modules with
capacities of typically 50 W-200 W. PV modules,
combined with a set of additional application-
dependent system components (e.g. inverters,
sun trackers, batteries, electrical components
and mounting systems), form a PV system,
which is highly modular, with capacities ranging
from a few watts to tens of megawatts [iea11].
Large utility-scale PV systems are usually called
PV power stations. The structure diagram of a
PV power station is given in Figure 3-11.
Power grid
Step-up
transformer
PV panel
Cable
Lower voltage busbar
High voltage busbar
AC
DC
AC
DC
AC
DC
Inverter Inverter Inverter
Figure 3-11 – Structure diagram of a PV power station](https://image.slidesharecdn.com/gridintegration-140608024623-phpapp02/85/Grid-Integration-Of-Large-Scale-38-320.jpg)
![39
2) Types of PV power generation
technologies
According to the materials and design, current
PV power generation technologies can be
classified into crystalline silicon, thin-film and
concentrating PV (see Figures 3-12 and 3-13).
Crystalline silicon PV is currently the best-
established PV technology, with an energy
conversion efficiency of up to 20 %. More
recently, thin-film PV, which can also use non-
silicon semiconductor materials, is gaining
attention. Although thin-film PV generally has a
lower efficiency than silicon PV (around 11 %),
it is less expensive and less energy-intensive to
manufacture and is also more flexible for versatile
applications. Concentrating PV, in which sunlight
is concentrated and strengthened by a lens
before it reaches the PV cells, is on the edge of
entering full market deployment. Concentrating
PV can reach an efficiency of up to 40 %. Other
technologies, such as organic PV cells, are still in
the research phase [hts09] [iea11].
Figure 3-12 – Thin-film and silicon PV
Figure 3-13 – Concentrating PV
(SGCC)
(a) A-Si Thin-film PV (b) Polycrystalline silicon PV](https://image.slidesharecdn.com/gridintegration-140608024623-phpapp02/85/Grid-Integration-Of-Large-Scale-39-320.jpg)
![40 S E C T I O N 3
Present: state of the art in integrating large-capacity RE
3) Characteristics of PV power generation
One of the key components of PV systems
is the inverter. DC output from PV systems is
changed into AC by inverters. The performance
of the inverter is especially important for grid-
connected PV power plants, since it directly
influences whether the PV power plant can
meet the requirements of grid operation. Most
inverters have low voltage ride through (LVRT)
and flexible active and reactive power control
capabilities. However, since there is no rotating
component, PV systems cannot supply inertia
support to the power system.
Compared to CSP described below, PV power
generation (except for concentrating PV) has
the advantage that it can use not only direct
sunlight but also the diffuse component of
sunlight to generate electricity, which allows
its effective deployment in many more regions.
Compared to wind power generation, PV power
generation is less challenging for grid integration
because sunlight is more predictable than wind.
Up to now, the comparatively high cost of PV
power generation has been the main barrier to
its mass deployment [iea11].
3.2.3 Concentrated solar power
generation
1) Basics of CSP generation
CSP generation, also known as solar thermal
power generation, is much like conventional
thermal power generation that converts thermal
energy into electricity, but differs in how the
thermal energy is obtained. CSP plants use
various mirror configurations (with a sun tracking
system) to reflect and concentrate direct-beam
sunlight to heat the working fluid flows (such as
air, water, oil or molten salt) in the receivers to a
high temperature, thus converting solar energy
into thermal energy (see Figure 3-14).
receiver
reflector
directsolarbeam
radiation
Figure 3-14 – Principle of obtaining thermal
energy in CSP
[dlr05]
Using a generator driven by a steam turbine, gas
turbine or heat engine, this thermal energy is
then converted into electricity. CSP plants may
also be equipped with thermal energy storage
systems for operating during cloudy periods or
at night. A typical stand-alone CSP plant has a
configuration such as that in Figure 3-15.](https://image.slidesharecdn.com/gridintegration-140608024623-phpapp02/85/Grid-Integration-Of-Large-Scale-40-320.jpg)
![41
A CSP plant can also be designed as a hybrid
system that uses fossil fuel to supplement the
thermal output during low solar radiation periods
(see Figure 3-16), making the plant output
more stable and dispatchable. It can also be
integrated with a conventional combined-cycle
plant to improve energy efficiency.
Collector Field
Storage
Tank
Solar Steam
Generator
Turbine
Grid
Condenser
Heat Transfer Fluid
Steam
Generator
Collector Field
Storage
Tank
HTF
Heater
Solar Steam
Generator
Boiler
Turbine / Generator
Grid
Condenser
Fuel
Fuel
Heat Transfer Fluid (HTF)
Steam
Figure 3-15 – Stand-alone CSP plant
[gre12]
Figure 3-16 – Hybrid CSP plant
[gre12]](https://image.slidesharecdn.com/gridintegration-140608024623-phpapp02/85/Grid-Integration-Of-Large-Scale-41-320.jpg)
![42 S E C T I O N 3
Present: state of the art in integrating large-capacity RE
2) Types of CSP generation technologies
According to how the solar energy is collected,
present CSP technologies can be classified into
four major types [dlr05] [hts09] [iea11]: parabolic
trough, linear Fresnel reflector, solar tower and
parabolic dish systems (see Figure 3-17).
• Parabolic trough systems use long
rows of parabolic mirrors to reflect and
concentrate sunlight beams onto a linear
receiver tube that contains the working
fluids
• Linear Fresnel reflector systems use
long rows of flat or slightly curved mirrors
to concentrate the sunlight beams onto
a downward-facing linear receiver tube
fixed in space above the mirrors
• Solar tower systems, also known as
central receiver systems, use numerous
large, flat mirrors to concentrate sunlight
beams onto a receiver at the top of a
tower
• Parabolic dish systems, also known as
dish/engine systems, concentrate sunlight
Figure 3-17 – Types of CSP technologies
[dlr05]
(a) Parabolic trough system
(b) Linear Fresnel reflector (LFR)
(c) Solar tower
(d) Parabolic dish](https://image.slidesharecdn.com/gridintegration-140608024623-phpapp02/85/Grid-Integration-Of-Large-Scale-42-320.jpg)
![43
beams onto the focal point of a single
dish, where the receiver and an engine/
generator (such as a Stirling machine or a
micro-turbine) are installed
The capacity of parabolic trough, linear Fresnel
reflector and solar tower systems can reach
hundreds of megawatts, while the capacity of
dish/engine systems is generally in the 10 kW
range, suitable only for distributed generation.
The solar-to-electricity efficiency of parabolic
trough systems has been demonstrated to be
about 10 %-15 %, with a perspective of reaching
about 18 % in the medium term.
3) Characteristics of CSP generation
CSP is advantageous in that it offers a utility-
scale, dispatchable and firm RE option. With the
inherent energy storage capability in the form
of heat that can be used to generate electricity
up to hours later, and with further support from
additional thermal storage systems or a hybrid
system design, CSP plants can continue to
produce stable electricity even when clouds
block the sun or the sun sets. So it is much less
challenging to integrate CSP than wind or PV
generation into power systems.
Although CSP has better performance for grid
integration, the relatively immature technology
and the high cost are currently limiting its large-
scale deployment.
One disadvantage of CSP is that it requires
strong direct sunlight. As a result, adequate CSP
resources are generally limited to semi-arid, hot
regions or deserts. At the same time, like other
thermal power generation plants, CSP requires
water for cooling and condensation, which
means a tremendous challenge in exploiting
CSP resources in arid regions. Dry cooling (with
air) is an effective alternative, but with higher
costs and lower operating efficiencies.
3.3 Transmission technology
Large-capacity RE generation plants are
usually far from load centres, and they therefore
need long-distance power transmission. Up to
now, AC transmission has been used for large-
capacity RE power transmission, and voltage
source converter high voltage DC (VSC-HVDC)
transmission has been used for offshore wind
power integration. Examples will be given in
this section. Ultra-high voltage AC (UHVAC) and
current source converter HV/UHVDC (CSC-
HV/UHVDC) are planned to be used in large-
capacity RE power transmission; these will be
described in section 4.
3.3.1 AC transmission
AC transmission is a mature technology.
The capacity of an AC transmission line is
proportional to the square of the voltage level
and inversely proportional to the impedance of
the line, which increases with the transmission
distance. To achieve a large increase in the
transmission capacity of long-distance AC
lines, a natural way is to raise the voltage level.
The approximate transmission capacities and
distances of different voltage-level AC lines
are listed in Table 3-1 [sgc07]. For small-to-
medium scale RE power plants, transmission
lines below 330 kV are usually used. For large-
scale, long-distance RE power, transmission
lines above 500 kV are usually needed. Some
examples of AC transmission above 500 kV
for RE integration in China and the USA are
described below.](https://image.slidesharecdn.com/gridintegration-140608024623-phpapp02/85/Grid-Integration-Of-Large-Scale-43-320.jpg)
![44 S E C T I O N 3
Present: state of the art in integrating large-capacity RE
1) USA
Currently, three major 500 kV transmission
projects are under construction or have been
approved in Southern California for RE power
transmission [ete11], a summary of which is
given in Table 3-2.
2) China
In November 2010, a 2 398 km double-circuit
750 kV transmission line was commissioned for
the interconnection of the Xinjiang power grid
and the Northwest power grid as well as for the
transmission of the phase I Jiuquan wind power
base. Jiuquan wind power base phase I has an
installed capacity of 5 160 MW. A small portion
is locally consumed, while most is transmitted
to the load centre of the Northwest power grid
(see Figure 3-18). A second 750 kV transmission
corridor is now under construction. 500 kV
transmission lines have also been built for the
Jilin wind power base in Northeast China.
Table 3-1 – Typical transmission capacities and distances of different voltage-level AC lines
Table 3-2 – Three AC transmission projects in California for RE power transmission
Voltage level (kV) Capacity (MW) Distance (km)
110 10-50 50-150
220 100-500 100-300
330 200-800 200-600
500 1 000-1 500 150-850
765 2 000-2 500 Above 500
Project
RE integration
capacity provided
by project (MW)
Transmission
line length
(km)
Purpose
Sunrise Power Link 1 700 196
Enhance grid connection between
Imperial Valley and San Diego,
transmitting wind, solar and
geothermal power from Imperial Valley
and Arizona to San Diego
Tehachapi
Renewable
Transmission Project
5 850 530
Transmitting wind and solar power in
Tehachapi area
Colorado River
Devers Valley (CDV)
4 700 270
Transmitting wind and solar power
in the Blythe area between California
and Arizona](https://image.slidesharecdn.com/gridintegration-140608024623-phpapp02/85/Grid-Integration-Of-Large-Scale-44-320.jpg)
![45
3.3.2 VSC-HVDC transmission
IGBT-based VSC-HVDC differs from the
conventional thyristor-based current source
converter HVDC (CSC-HVDC, also known
as line commutated converter HVDC (LCC-
HVDC)) in that it is self-commutated via control
circuits driven by pulse-width modulation, while
CSC-HVDC is line-commutated, i.e. switched
off when the thyristor is reversely-biased from
the AC voltage [wei11]. Compared to CSC-
HVDC, VSC-HVDC offers among others the
following major advantages [vsc10]:
1) It can rapidly control both real and reactive
power, independently, within its rated MVA
capacity. As a result, it can transmit very low
and even zero active power, which is suited to
the frequent and wide-range output fluctuation
of RE generation, while CSC-HVDC is limited by
minimum startup power. VSC-HVDC terminals
can generate or absorb a given amount of
reactive power as instructed or according to
the voltage level of the connected AC grid,
providing excellent voltage support, while CSC-
HVDC terminals always absorb reactive power
when working, requiring large amounts of
reactive power compensation.
2) It can rapidly reverse the reactive power
direction merely by reversing the current
direction, without changing the voltage polarity
as CSC-HVDC requires. It therefore needs no
changes in the topology and strategy of the
converter station control system.
3) It does not require support from the connected
AC grid for commutation as CSC-HVDC does,
and can therefore be connected to weak or even
passive AC grids, while CSC-HVDC requires the
connected AC grid to be sufficiently strong.
Due to these advantages, VSC-HVDC is desirable
for RE integration, especially for offshore wind
power, as well as for grid interconnection and
power supply to isolated systems and to crowded
metropolitan areas. The fast development of
RE has led to a rapid increase in VSC-HVDC
projects in recent years. Some VSC-HVDC
projects commissioned for RE integration are
listed in Table 3-3. There were also 12 VSC-
HVDC transmission projects under construction
all over the world at the end of October, 2011.
From 2009 onwards, the total capacity of VSC-
HVDC projects under construction in the world
has reached 10 GW, which is four times higher
than that of the projects built before 2009.
Xinjiang
Load centre
Jiuquan wind power base
Over 1 000 km
Figure 3-18 – Transmission of the phase I Jiuquan wind power base, Northwest China
(SGCC)](https://image.slidesharecdn.com/gridintegration-140608024623-phpapp02/85/Grid-Integration-Of-Large-Scale-45-320.jpg)
![46 S E C T I O N 3
Present: state of the art in integrating large-capacity RE
3.4 Operational technologies
and practices
This section focuses on operational technologies
and practices related to wind power, since wind
power generation is currently the most widely
deployed large-capacity RE generation and has
significant impacts on power system operations.
Much has been done to address these impacts
by researchers and grid operators worldwide.
Similar technologies and practices can also be
used for PV and solar thermal power generation.
For the operation of power systems with high
penetration of large-capacity RE generation, RE
power forecasting is critical for grid operators
to carry out operational planning studies and
ensure that adequate resources are available
for managing the variability of RE output.
3.4.1 Power forecasting
1) Forecasting methods
Based on the time scale of the forecast, wind
power forecasting can be classified as ultra-
short-term forecasting, short-term forecasting
and medium/long-term forecasting. Short-term
forecasting is currently the most widely used,
with a time scale up to 48-72h. The principle
of short-term wind power forecasting is shown
in Figure 3-19. Present methods for short-
term wind power forecasting generally include
physical methods, statistical methods, and a
hybrid of the two.
• Physical methods start with a numerical
weather prediction (NWP) model, which
provides the expected wind speed and
direction at a future point in time. Further
steps include the application of the NWP
model results to the wind farm site, the
conversion of the local wind speed to
power, and the further application of the
forecast to a whole region [ewe05].
• Statistical methods first establish the
relationship between the historical NWP
data and the historical power output data
of wind farms via one or more learning
algorithms, and then predict the wind farm
power output based on this relationship.
The advantages and disadvantages of the two
types of method are shown in Table 3-4.
Table 3-3 – VSC-HVDC projects commissioned for RE integration
Year Project Country MW / kV / km Remarks
1999 Gotland Sweden 50 / ±80 / 70
Onshore wind power integration
(voltage support)
2000 Tjæreborg Denmark 7.2 / ±9 / 4.3
Onshore wind power integration
(testing for offshore wind power
integration)
2009 Nord E.ON 1 Germany 400 / ±150 / 203 Offshore wind power integration
2011 Shanghai Nanhui China 18 / ±30 / 10 Offshore wind power integration](https://image.slidesharecdn.com/gridintegration-140608024623-phpapp02/85/Grid-Integration-Of-Large-Scale-46-320.jpg)
![47
Figure 3-19 – Principle of short-term wind power forecasting
(SGCC)
Numerical weather
prediction (NWP)
Forecast program
Power output
forecast
Some of the major short-term wind power
forecasting programs available on the market
are listed in Table 3-5. Although the current
programs are already able to provide valuable
forecast results, further improvement is eagerly
expected [ewe05].
Methods Advantages Disadvantages
Physical
methods
• Require no historical power output
data for the wind farms; suitable for
new wind farms.
• Based on detailed analysis of each
atmospheric process; the forecasting
model can be optimized to obtain
more accurate forecasts.
• Very sensitive to systematic
errors caused by incorrect initial
information.
Statistical
methods
• High accuracy can be achieved if
high-quality data can be obtained.
• Self-adjustment can be made to give
appropriate output even if the input is
not included in the training set.
• Require a great deal of highly
consistent historical data.
• Work like a black box, difficult
to understand the learning and
decision-making process and
optimize the model.
Table 3-4 – Advantages and disadvantages of two forecasting methods](https://image.slidesharecdn.com/gridintegration-140608024623-phpapp02/85/Grid-Integration-Of-Large-Scale-47-320.jpg)
![49
2) Forecast accuracy
The accuracy of wind power forecasting can
be measured by different indices. Root mean
square error (RMSE) normalized to the installed
wind power is most commonly used. Regardless
of the forecasting method used, the forecast
error (RMSE) for a single wind farm is between
10 % and 20 % of the installed wind power
capacity for a horizon of 36 hours [ewe05].
Spatial aggregation greatly reduces forecast
errors, just as it reduces variability. As seen in
Figure 3-20, the level of accuracy improves as
the size of the region considered for forecasting
increases. This is due to spatial smoothing
effects. The error reduction shown along the
vertical axis in Figure 3-20 is the ratio between
the RMSE of a regional prediction and the RMSE
of forecasting for a single site, and is based on the
measured power production of 40 wind farms in
Germany. Aggregation over a 750 km region may
reduce forecasting error by about 50 % [eis11]. If
forecasting is scaled up to apply to the aggregated
wind power of a large area, the forecast error
(RMSE) can drop to below 10 % [ewe05].
On the other hand, the forecast error increases
as the time horizon of the forecast increases,
as shown in Figure 3-21, which also shows the
improvement in forecasting techniques over the
years. Generally, the error for 1-2 hours ahead
for a single farm forecast can be about 5 %-7 %,
and can reach 20 % for day-ahead forecasts.
Figure 3-20 – Decrease of wind forecast error
for aggregated wind power production
[hol09] (energy meteo systems)
Figure 3-21 – Wind forecast error as a percentage of wind production, as a function
of the time forward from the present
[uei10]
0
0.2
0.4
0.6
0.8
1
0 500 1 000 1 500 2 000
Errorreduction
Region size (km)
Meanabsoluteerror/meanproduction(%)
WIND FORECAST EVOLUTION – 2005-2008 (DATA FROM RED ELECTRICA ESPANA)
40
35
30
25
20
15
10
5
0
0 1 4 7 10 13 16 19 22 25
Hours
28 31 34 37 40 43 46 49
2007
2006
2005
2008](https://image.slidesharecdn.com/gridintegration-140608024623-phpapp02/85/Grid-Integration-Of-Large-Scale-49-320.jpg)
![50 S E C T I O N 3
Present: state of the art in integrating large-capacity RE
3.4.2 Operational practices
Due to the differences in RE generation
development, the conventional generation fleet,
grid structure as well as market and institutional
environments, the operational practices
related to RE integration are quite different in
different countries or regions. Some operational
practices related to wind power integration in
major countries are briefly introduced below.
1) China
According to the Renewable Energy Law and
related regulations, wind power (and other
renewables) should be given first priority in
generation scheduling and dispatching under
normal power system operating conditions. To
meet this requirement, grid operators consider
predicted wind power generation in the mid-to-
long term, day-ahead and intra-day operation
planning processes and fully exploit flexibility
from conventional power plants, as well as the
capacity of inter-grid tie-lines to accommodate
the maximum wind power while maintaining
system security and reliability (see Figure 3-22)
[sgc11] [wei11].
The requirement is also emphasized for
WPPs to be equipped with control and
monitoring systems; these serve to enhance
their controllability and provide operational
information to grid operators. To date, all
grid-connected WPPs have been equipped
with control and monitoring systems that can
communicate with the dispatching centres in
real time.
Wind power forecasting systems have been
deployed in several regional or provincial
dispatching centres in the State Grid Corporation
of China (SGCC), but only about 30 WPPs have
established a plant-level wind power forecasting
system, a situation needing to be improved by
more stringent management. A SGCC NWP
centre has also been established in the China
Electric Power Research Institute (CEPRI) to
provide weather information needed by the
wind power forecasting systems. Based on
wind power forecasting at different time scales,
a “wind power optimal dispatching decision
support system” had been developed and put
into operation in the dispatching centre of the
Jilin provincial power grid (see Figure 3-23).
Figure 3-22 – System operation in China taking wind power into account
[sgc11]
Mid-long term
Forecast
Day-ahead
forecast
Intra-day
forecast
Wind power forecast
Wind energy
scheduling
Day-ahead
scheduling of
WPPs
Real-time
control of WPPs
Entire grid
Operation planning,
Unit commitment
Wind/Conventional power plant dispatch
Day-ahead scheduling
of conventional plants
Real-time control of
conventional plants
Entire grid
Entire grid
and WPP
and WPP](https://image.slidesharecdn.com/gridintegration-140608024623-phpapp02/85/Grid-Integration-Of-Large-Scale-50-320.jpg)
![51
Figure 3-23 – The “wind power optimal dispatching decision support system” in Jilin
[sgc11]
WP information
input
Day-head real
time WP plan
WP forecasting WPP control
Security analysis
regarding WP
Analysis and display
of WP operation data
D5000 dispatching platform
AVC
AGC
2) Denmark
Energinet.dk, the transmission system operator
(TSO) of Denmark, mainly uses two wind power
forecast tools: one external and one internal. The
external forecast tool gives a 0-12 hour forecast
every 5 minutes and a 0-48 hour forecast every
hour. The input to the forecasting includes four
different numerical weather predictions. The
internal forecast tool includes a 0-6 hour short-
term forecast and a 12-36 hour day-ahead
forecast.
A well-functioning power market and an
automatic dispatching system have been
established throughout the north European
power system including Denmark, through
which the hydropower in Norway and Sweden
is often used to balance the wind power in
Denmark. Figure 3-24 shows the monitoring
curves of power generation and exchange,
where line A is total power production based
on individual 5-minute schedules from all
power plants, lines B are exchange plans with
neighbouring grids (Western part of Denmark
(DK1) to SvK in Sweden, DK1 to Tennet in
Germany, DK1 to ENDK in Denmark and DK1 to
SN in Norway, from top to bottom). In general,
the Nordic Power System can be balanced by
trading: the additional electricity produced by
WPPs is purchased at a low price and sold to
the other grids at a higher price. In addition
co-generation plants and electric boilers play
an important role in winter in balancing the
fluctuations caused by large-scale wind power.](https://image.slidesharecdn.com/gridintegration-140608024623-phpapp02/85/Grid-Integration-Of-Large-Scale-51-320.jpg)
![52 S E C T I O N 3
Present: state of the art in integrating large-capacity RE
3) Germany
Three of the four TSOs in Germany (50Hertz,
Tennet, Amprion and ENBW) have established
wind power forecasting systems, covering
approximately 98 % of Germany’s wind
power capacity. For example, the Amprion
company has set up a Front Office to manage
the operation of the forecasting system and
optimize the forecast results by a combination
tool (see Figure 3-25). Amprion shares wind
power forecasting data (day-ahead and ultra-
short-term) with other members of TSC (TSO
Security Cooperation).
In September 2004, the German “Renewable
Energy Sources Act” amendment introduced
a new mechanism for wind power balancing,
which requires each system operator to
contribute to balancing the whole country's
wind power output in proportion to the size of
its regional grid.
This mechanism allocates wind power and the
associated fluctuation to each system operator
in real time. It is more equitable in the distribution
of balance services and related costs. The four
system operators have developed a real-time
wind power monitoring system to determine
the wind power balancing capacity that every
system operator should be responsible for.
In fact, as concerns wind power, the regional
grids have integrated into a single large grid in
Germany.
In certain areas, the wind power output will
sometimes exceed the transmission capacity of
the grid, and the grid managers have a legal
obligation to increase power transmission
capacity. In the interim period before the
additional capacity objectives are achieved, the
grid managers can require the wind farms to
reduce their power output or shut down some
of the wind turbines.
Figure 3-24 – Monitoring power generation and power exchange with neighbouring grids
[sad11]
A
B](https://image.slidesharecdn.com/gridintegration-140608024623-phpapp02/85/Grid-Integration-Of-Large-Scale-52-320.jpg)
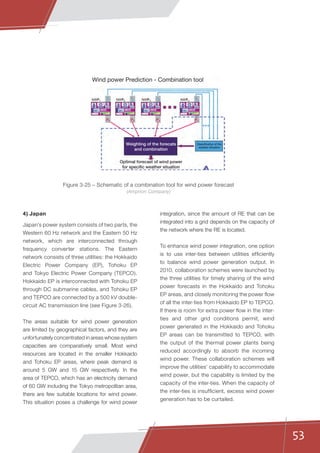
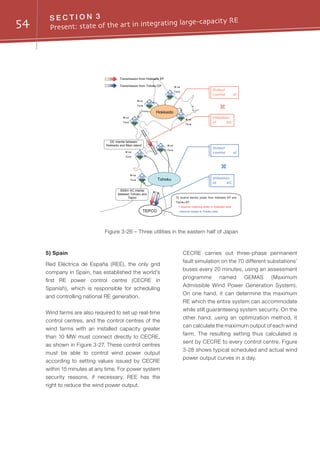
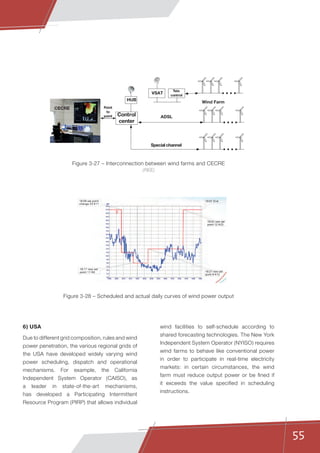
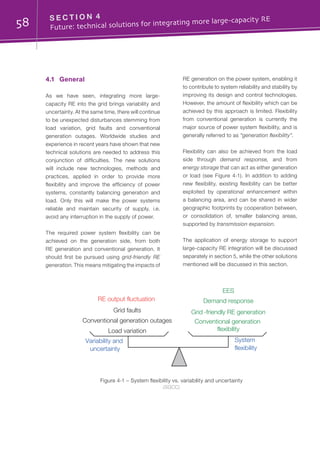
![59
4.2 Grid-friendly RE generation
4.2.1 Need for grid-friendly RE
generation
At the beginning of its development RE
generation technology focused more on tapping
the maximum power from RE resources. It
neglected to make any contribution to power
system reliability and stability and in the absence
of standards and incentives was not designed
to operate in a coordinated fashion with the rest
of the system. As long as RE penetration is low
this is manageable and can be accepted by
power system operators. But as RE generation
penetration grows, and especially as the
capacity of RE power plants becomes larger
and larger, this will have a serious impact on
system operation.
For example, in 2011 several serious wind
turbine disconnection incidents occurred
in China due to the lack of fault ride-through
capability (see 4.2.2), including one at the
Jiuquan wind power base on February 24,
which led to the disconnection of 598 wind
turbines from the grid (840.43 MW of power
output) and a significant frequency drop.
Therefore it is becoming increasingly important
that RE generation should play a greater role
in helping to maintain system reliability and
stability, and this may be increasingly required
by interconnection standards. Technologies
have been developed and are continuously
improving at the generating unit, plant and
plant cluster level to make RE generation more
predictable, controllable and dispatchable, or in
other words more grid-friendly.
4.2.2 Advanced characteristics of RE
generating units and plants
Development of power electronics and
mechanical engineering technologies, as well
as the design of proper control strategies,
have enabled wind generating units to possess
performance comparable or even superior
to those of conventional thermal or hydro
generating units. Some advanced operational
capabilities of wind generating units and the
methods to achieve them are cited below from
[ner09] and [bac11] with minor modifications.
Most of these capabilities can also be achieved
for solar PV generating units since they share
many technical characteristics with wind turbine
generators, especially the inverter-based ones.
1) Voltage/Var control and regulation
Reactive power support and power factor control
can be provided either through a built-in capability
(available for wind generating units types 3 and 4)
or through a combination of switched capacitor
banks and power electronic based transmission
technologies such as static var compensator
(SVC) and static synchronous compensator
(STATCOM) (flexible AC transmission system
(FACTS) equipment as discussed in 4.4.2,
applicable to all types of wind generating units).
2) Fault ride-through
The ability is needed to survive (ride through)
specific low and high voltage/frequency ranges
and durations caused by faults or disturbances
in the power system. Voltage ride-through can be
achieved with all modern wind generating units,
mainly through modifications to the controls. In
some cases, with older type 1 or type 2 wind](https://image.slidesharecdn.com/gridintegration-140608024623-phpapp02/85/Grid-Integration-Of-Large-Scale-59-320.jpg)
![60 S E C T I O N 4
Future: technical solutions for integrating more large-capacity RE
Figure 4-2 – Typical structure of a “grid-friendly” wind power plant
(SGCC)
Power grid
Step-up
transformer
Low voltage busbar
High voltage busbar
SCADA
Reactive
power
compensation
Fault ride-through
control
Active power /
Frequency control
Other control
Reactive power /
Voltage control
Wind farm controller
Communication
module
Dispatch Centre
Command, Data
Measurement
Power
Communication
module
generating units at weak short-circuit nodes in
the transmission system, there may be a need
for additional transmission equipment.
3) Active power control, ramping and
curtailment
This can be achieved through unit control
mechanisms for wind turbine units with active-
stall or pitch control, or discrete tripping of units.
4) Primary frequency regulation
Primary frequency regulation can be supplied
by all units that are equipped with some form of
pitch regulation (i.e. active-stall or pitch control).
5) Inertial response
Inertial response is inherent in type 1 and type 2
units, and can be achieved through supplemental
controls in the converter to emulate inertial
behaviour for type 3 and type 4 units.
6) Short-circuit current control
All inverter-based variable generators have a built-
in capability to limit the fault current to a level that
does not exceed 150 % of the full load current.
For grid integration it is important to view RE
generation at the plant level. An RE power plant
is not just a simple collection of RE generating
units, but is also supported by many other
components and systems so as to function like
a conventional power plant. Based on advanced
generating units, these characteristics can also
be achieved at the plant level. Plant-level reactive
power compensation, accurate RE generation
output forecasting, the presence of monitoring,
control and data communication systems, as well
as properly designed relay protection schemes all
help to improve the predictability, controllability
and dispatchability of RE power plants. An
example of the typical structure of a “grid-friendly”
wind power plant is given in Figure 4-2 [sge11].](https://image.slidesharecdn.com/gridintegration-140608024623-phpapp02/85/Grid-Integration-Of-Large-Scale-60-320.jpg)
![61
750 kV Anxi
substation
750kV
Jiuquan
substation
#1
#2
#3
#4
#5
#6
#7 #8
#9
#10200 MW
200MW
200 MW
200MW
200MW
200MW
200 MW
200 MW
200MW200 MW
200 MW
200MW
300 MW
200MW
200 MW
200MW
280 km
330kV
substation
330 kV line
750 kV line
Wind power plant
200 MW
35 kV line
4.2.3 Centralized control of an RE plant
cluster
The areas with the best RE resources may see
the development of RE power bases with many
RE power plants located adjacent to each other.
A schematic diagram of the Jiuquan Wind Power
Base in Northwest China is given in Figure 4-3
as an example. It is organized in several layers:
arrays of wind turbine generators form a wind
power plant, several plants are connected to
a 330 kV collection substation through 35 kV
lines, and several collection substations are
further connected to a final 750 kV integration
substation through 330 kV transmission lines
of tens of kilometres. In other words, a large-
capacity RE power base may consist of several
RE plant clusters.
The control of the RE power plants in such
a cluster must be coordinated if operational
problems are to be avoided. Taking reactive
Figure 4-3 – Schematic diagram of the Jiuquan Wind Power Base, Gansu, China
(SGCC)
power control as an example [pei12]: with
multiple wind plants having requirements to
provide reactive power and control grid voltages,
problems have emerged when the voltage and
reactive power controllers in nearby plants have
been incompatible, resulting in poor voltage
control and counterproductive reactive power
flows. There have been numerous reports of
one or more plants at maximum reactive power
output while neighbouring plants are absorbing
reactive power. To avoid this kind of situation,
centralized cluster control is an attractive solution.
A centralized cluster control system, configured
in a multi-layer structure such as that depicted in
Figure 4-4, can be used to coordinate the active
and reactive power control of a RE power plant
cluster, just as cascaded hydro power plants on
a river are controlled. Such a centralized cluster
control system, the so-called Large Wind Power
Plants Cluster Active Power Intelligent Control
System, has been developed and deployed at
the Jiuquan Wind Power Base [sgc11].](https://image.slidesharecdn.com/gridintegration-140608024623-phpapp02/85/Grid-Integration-Of-Large-Scale-61-320.jpg)
![62 S E C T I O N 4
Future: technical solutions for integrating more large-capacity RE
4.2.4 Improvements in modelling RE
generation
In order to represent accurately the static,
dynamic as well as short-circuit performance
of RE generators, plants and clusters and their
impacts on power systems, appropriate models
of the different types of RE generation are
needed.
Up to now, most RE generation modelling efforts
have been carried out at the generator level
[aba11] [bac11] [mma11]. Although RE generator
manufacturers have long been developing and
refining models to improve their generator
design – these are typically user-written
proprietary models on commercial software
platforms – it has now been recognized that
publicly available industry-standard models,
similar to those available for conventional
generation, are needed for planning studies.
Significant progress has been made towards
industry-standard models by the task forces or
working groups under WECC, the Institute of
Electrical and Electronics Engineers (IEEE), the
Utility Wing Integration Group (UWIG) and the
North American Electric Reliability Corporation
(NERC), with the development and distribution
of generic dynamic models for wind turbine
generators. These are models with general
model structures that allow for representation
of wind turbine generators of the same type,
regardless of manufacturer, by selecting
appropriate model parameters. WECC and
IEC groups are moving forwards to refine
and validate these generic models, for which
collaboration between the power engineering
community and wind turbine manufacturers is
necessary. Efforts to develop generic models
for PV have also begun. However, regarding RE
Dispatching centre
Cluster control
station #1
Cluster control
substation #1
Plant
executive
station #1
Cluster control
station #2
Cluster control
#N
Cluster control
#1
Cluster control
#N
Plant
executive
station #N
Plant
executive
station #1
Plant
executive
station #N
Plant
executive
station #1
Plant
executive
station #N
Plant
executive
station #1
Plant
executive
station #N
substation substation substation
Figure 4-4 – RE power plant cluster control system structure
(SGCC)](https://image.slidesharecdn.com/gridintegration-140608024623-phpapp02/85/Grid-Integration-Of-Large-Scale-62-320.jpg)
![63
generator modelling, a great deal of research
still needs to be carried out, e.g. to determine
the short-circuit contribution of different types
of RE generators, and to represent the more
advanced and rapidly developing control
characteristics of RE generation, such as those
described in 4.2.2.
IEEE and IEC groups have started to expand
efforts in generic dynamic modelling for
entire wind power plants, including control
and auxiliary equipment [mfc11]. Modelling of
large-scale wind power plants is particularly
challenging due to the fact that they may
consist of tens or even hundreds of individual
generators, distributed over the large footprints
of the plants, and the requirement of being
represented as a single equivalent unit in power
system simulations for simplicity. Techniques
are needed to aggregate the individual
generator models while considering the spatial
and temporal interaction among the generators.
Techniques are also needed to represent all the
cables connecting all the generators as a single
equivalent circuit, and to test the validity of the
equivalent model as a whole. Extending this
modelling work to huge clusters of wind power
plants, such as the 10 GW-scale wind power
bases in China, will be even more difficult.
4.3 Improved flexibility in
conventional generation
4.3.1 Need for more flexibility in
conventional generation
Although system flexibility can also be achieved
through demand response and energy storage
as well as through grid-friendly RE generation,
it may take decades for low-cost, large-scale
storage to mature (with the exception of the
widely used but topographically restricted
pumped hydro storage), and demand response
as a flexibility resource is still in its infancy.
Flexibility in conventional power plants (generally
referred to as “generation flexibility”) is therefore
the major source of power system flexibility, and
“the need for increased generation flexibility is
central to the challenges posed by intermittent
renewables” [eis11]. The need for generation
flexibility differs in different countries and regions
due to their different existing generation mix.
Generally, hydro power plants with a reservoir
are most flexible, followed by gas-fired power
plants, then coal-fired power plants and
last nuclear power plants, but it is difficult to
measure flexibility so as to allow use of the
measurements in generation planning.
4.3.2 Assessment of generation flexibility
1) Flexibility of conventional power plants
The relevant technical characteristics of
conventional power plants that contribute to
operational flexibility are the cycling, ramping and
partial loading capabilities. Cycling capability
is a generator’s ability for frequent and fast
startup or shutdown. Ramping capability is the
rate at which a generator can change its output,
either upwards or downwards. Partial loading
capability is the minimum output level at which
a generator can be stably operated, as well as
the efficiency when operating at different output
levels lower than rated capacity. Due to the
differences in design and technology, different
types of power plants have different levels of
operational flexibility, implying varying impacts
on equipment health, service life, operational
costs and GHG emissions.](https://image.slidesharecdn.com/gridintegration-140608024623-phpapp02/85/Grid-Integration-Of-Large-Scale-63-320.jpg)
![64 S E C T I O N 4
Future: technical solutions for integrating more large-capacity RE
Hydro power plants with reservoirs are very
flexible in operation. They can be easily and
quickly started up or shut down with little impact
on equipment health or service life. They can start
from off-duty status and ramp to full-loading status
in several minutes, and change their capacity
by 50 % in fractions of a minute. Their minimum
output can be very low, which means a regulation
range of near 100 % capacity. However, output
and hence the flexibility contribution of hydro
power plants can be influenced by seasonal
factors (drought and flooding seasons) as well
as non-electricity-sector requirements such as
flood and drought control or environmental and
navigational considerations.
Gas-fired power plants, including natural
gas combined cycle (NGCC) and simple cycle
gas turbine (SCGT) plants, are also flexible
generation resources. Current designs of
SCGTs in operation are able to ramp to 100 MW-
150 MW in 10 minutes, and NGCC plants in
60 to 80 minutes. New NGCC designs with an
increased focus on the ability to operate in a
system with a large proportion of intermittent
renewables are expected to produce 150 MW
in 10 minutes and to ramp to full load in 30
minutes. The ramping rate of NGCC and SCGT
plants is generally up to 8 % per minute. NGCC
plants can reduce their output to 80 % of
capacity with only a minimal heat rate penalty,
but with increasing efficiency losses at lower
outputs [eis11].
Coal-fired power plants have limited
operational flexibility. They are not suitable for
frequent cycling since they may take several
hours to start up or shut down. Their ramping
rates are generally only 1 %-3 % per minute;
new large-capacity generators can reach 5 %
per minute. Their minimum output is generally
70 %-80 % of capacity; new large-capacity or
specially designed peaking generators can go
down to 50 % or lower, but lower output will lead
to higher fuel consumption per kWh generated.
An example is given in Table 4-1 [npg10]. The
flexibility of specific coal-fired power plants
can be influenced by their size, age, operating
pressure, fuel quality and the control systems
installed [eis11].
Table 4-1 – Standard coal consumption of typical 600 MW and 1 000 MW generators
at different loading levels
Loading level
(% of rated capacity)
Standard coal consumption (g/kWh)
1 000 MW ultra-supercritical
generators
600 MW ultra-supercritical
generators
40 % 306 311
50 % 298 303
75 % 287 290
100 % 282 284](https://image.slidesharecdn.com/gridintegration-140608024623-phpapp02/85/Grid-Integration-Of-Large-Scale-64-320.jpg)
![65
Nuclear power plants also have limited
operational flexibility and are less used for ramping
for economic reasons. Relatively new nuclear
reactorscandown-ramp20 %oftotaloutputwithin
an hour, but require six to eight hours to ramp
up to full load. Nuclear plant ramping operations
are not fully automated, creating opportunities
for operator error. Although operational costs for
nuclear plants running at partial load versus full
load do not significantly differ, they need to run
as base load units at high output levels to recover
their high capital costs [eis11].
With more large-capacity RE generation being
integrated into power systems, not only the
flexible hydro and gas-fired power plants are
required to adjust their output more frequently,
the coal-fired and nuclear power plants
traditionally operated mainly as base load units
are also shifting to more flexible operation
paradigms. Much effort is needed to better
understand the impact of flexible operation
on the technical, economic and environmental
performance of conventional power plants,
especially thermal power plants, hence to
support the improvement in equipment design,
retrofit and daily operation, as well as the design
of necessary financial incentives.
2) Measuring generation flexibility
The need for more generation flexibility is
well recognized. However, there is currently
a lack of metrics, methods and tools to
measure the flexibility and its related cost of
provision, determine the flexibility required,
and optimize the generation resources to
provide the required flexibility with minimal
cost, all of which would be needed to support
the planning and operation of power systems
with more large-capacity RE. It is much more
difficult to measure generation flexibility than to
measure the adequacy of generation capacity;
the former is more complicated and requires
more data and detailed modelling [trp11].
Collaboration between grid operators and
the research community is desirable to foster
efforts to develop more rigorous methods and
tools to accurately quantify, monitor and assess
the degree of flexibility in a given power system
for a given level of RE penetration [sad11].
The research community has started to
respond to the need for power system flexibility
measurement. The emphasis is on generation
flexibility,currentlythemajorflexibilityresource,but
efforts also include using demand response and
energy storage for flexibility. The Integration of
Variable Generation Task Force (IVGTF) under the
NERC in 2010 released a special report on the
flexibility requirements and metrics for variable
generation [ner10], which discussed the metrics
and approaches for flexibility measurement. The
IEA Grid Integration of Variable Renewables
(GIVAR) project has proposed a semi-quantitative
method supported by qualitatively described
limiting constraints on flexible resources to
assess system flexibility, and a subsequent
project specially targeting the quantification of
system flexibility is expected [fat11]. The Alberta
Electric System Operator (AESO) has developed
a dispatch decision support tool, incorporating
wind power forecasting, to measure system
flexibility and help operators to manage the
increased variability and uncertainty [pao11].
4.3.3 Generation planning for both
adequate capacity and adequate
flexibility
In power systems with higher variability and
uncertainty due to the integration of more](https://image.slidesharecdn.com/gridintegration-140608024623-phpapp02/85/Grid-Integration-Of-Large-Scale-65-320.jpg)
![66 S E C T I O N 4
Future: technical solutions for integrating more large-capacity RE
Figure 4-5 – Generation planning process incorporating flexibility assessment
[trp11]
large-capacity RE, it is becoming increasingly
important for the generation planning process
to consider not only the adequacy of generation
capacity, but also the adequacy of generation
flexibility. Simply having a specified number of
megawatts of capacity may not be adequate
for system security if that capacity is not flexible
enough to respond to system variability [aba11].
1) Planning for adequate generation
capacity
For capacity planning, the calculation of the
“capacity value” (also known as “capacity credit”)
of RE generation has been recognized as a major
issue. The capacity value of a generation resource
can be defined as the amount of additional load
that can be served due to its addition while
maintaining existing levels of reliability. The
calculation of the capacity value of RE generation
is much more difficult than that of conventional
generation due to its inherent variability and
uncertainty. Research on this issue has received
much attention. Both the IEEE Power Energy
Society (PES) and the NERC IVGTF have
established task forces to study it. A rigourous
“effective load-carrying capacity” (ELCC) method
based on reliability simulation as well as several
approximate methods have been proposed for
wind power capacity value calculation, and are
being extended to solar power. But there remain a
number of problems, including the representation
of other types of generation in the calculation,
the accuracy of approximate methods and the
requirement of high-quality wind, solar and
synchronized demand data for the ELCC method
to produce reliable results [bac11] [cvw11].
2) Generation planning considering
flexibility at the system level
In order to consider flexibility requirements, a
new paradigm of generation planning is needed.
One example is the approach proposed in
[trp11], adding a flexibility assessment stage into
the planning process, as shown in Figure 4-5.
It starts from the relatively simple traditional
capacity adequacy calculation, using metrics
such as loss of load expectation (LOLE) and
expected unserved energy (EUE), to form an
initial generation portfolio, and then moves to the
more data-intensive system flexibility assessment
and production cost simulation stages. Both of
these stages involve computation-intensive unit
commitment and economic dispatch studies.
This three-stage approach is designed to reflect
the aims of the planning process, i.e. to provide a
reliable, operable, least-cost generation portfolio
for the given study period. If excessive or
inadequate flexibility is observed, the generation
portfolio or unit commitment model can be
altered and the whole process iterated, in order
to find a better generation portfolio that meets
Capacity
adequacy
assessment
System flexibility
assessment
Production cost
simulation
Generation
portfolio
If portfolio is unreliable in operation](https://image.slidesharecdn.com/gridintegration-140608024623-phpapp02/85/Grid-Integration-Of-Large-Scale-66-320.jpg)
![67
the dual aims of minimizing cost and meeting a
specified flexibility standard.
Again, the system flexibility assessment is
possible only when metrics measuring flexibility
in the planning context are available, which
is currently not the case. A good start is the
metric named “insufficient ramping resource
expectation” (IRRE) developed by the IEA, which
applies principles similar to those underlying the
LOLE metric for capacity adequacy calculation.
3) Generation planning considering
flexibility at resource site level
Besides incorporating flexibility considerations
into generation planning at the system level,
special designs can also be used at resource
site level to exploit the flexibility of conventional
generation in order to compensate for the
variability and uncertainty of RE.
Such an approach is intended for some wind
power bases in China, where the so-called
“wind-fire bundling” design has been proposed
(see Figures 4-9 and 4-10): coal-fired power
plants are planned near a wind power base
and will share its transmission lines. Wind
power output fluctuations can be smoothed
out by adjusting coal-fired production; thus
the utilization of the transmission line can be
improved as compared to transmitting only
wind power and the average cost of electricity
at the receiving end can be reduced [sgc11].
4.4 Transmission expansion
4.4.1 Needs for transmission expansion
Accommodation of large-capacity RE
generation needs large-scale transmission
grid expansion and reinforcement for the
following reasons:
1) Grid expansion and inter-regional connection
are needed to transmit the energy generated by
large-capacity RE sources, which are generally
located far from load centres and the existing
grid.
2) Through grid expansion, the geographic
diversity of RE generation can be exploited
to smooth out their aggregated variability
and uncertainty and to reduce the RE power
forecast error.
3) Grid expansion and reinforcement can
support interconnection between balancing
areas, hence facilitating their cooperation or
consolidation to share flexibility resources.
As shown in [smp11], transmission for RE
integration is an issue everywhere for both
technical and regulatory reasons. An inability to
solve the transmission problem will jeopardize
the achievement of RE goals, and drive up the
cost to reliably integrate these new resources
into power systems.
4.4.2 Application of new transmission
technologies
1) Higher voltage level AC transmission:
UHVAC
UHVAC transmission lines with rated voltage
levels of 1 150 kV or 1 000 kV were built and
commissioned by the former Soviet Union and
Japan in the 1980s and 1990s, but then operated
at a 500 kV voltage level for practical reasons.
China is now leading the research and application
of 1 000 kV UHVAC transmission, which seems a
desirable technology to meet the need for large-
scale, long-distance power transmission from the](https://image.slidesharecdn.com/gridintegration-140608024623-phpapp02/85/Grid-Integration-Of-Large-Scale-67-320.jpg)
![68 S E C T I O N 4
Future: technical solutions for integrating more large-capacity RE
large coal, hydro, wind and solar energy bases in
the northern and western regions to the central and
eastern regions with huge and still fast-growing
electricity demand. The first 640 km single-circuit
Jindongnan-Nanyang-Jingmen 1 000 kV UHVAC
test and demonstration transmission project was
commissioned in 2009, the reinforcement which
followed was completed at the end of 2011, and
it can now transmit 5 000 MW of power stably.
Some UHVAC projects have been planned to form
part of the large-capacity, long-distance wind
power transmission installation from the West-
Inner Mongolia and Hebei wind power base in
Northern China [sgc11]. UHVAC has also attracted
attention from other emerging large economies
facing similar energy delivery challenges, such as
India [tea07].
A single-circuit 1 000 kV AC line can transmit
4 000 MW to 5 000 MW over an economic
distance of 1 000 km to 1 500 km. Compared
to 500 kV AC transmission, 1 000 kV AC
transmission has many advantages in improving
transmission capacity and distance, reducing
power loss, reducing land use and saving cost,
as shown in Table 4-2 [sin06] [tgy06]. For RE
energy transmission, UHVAC is mainly suitable
for transmitting power from on-shore RE plants
using overhead lines.
2) More flexible AC transmission: FACTS
Based on advanced power electronic technologies
and innovative designs, FACTS equipment can
be applied to improve the capacity, stability and
flexibility of AC transmission, making it more
capable of transmitting large-capacity RE. For
example, thyristor controlled series compensators
(TCSCs) can be installed in transmission lines to
reduce electrical distance, increase damping and
mitigate system oscillation; SVC, STATCOM and
controllable shunt reactors (CSRs) can be shunt-
installed on substation buses to solve the reactive
power compensationandvoltagecontrolproblems
which are common in RE integration due to their
output fluctuation. SVCs or STATCOMs may
also be used to improve the performance of RE
power plants to meet integration requirements on
reactive power and voltage control, while keeping
the design of RE generators relatively simple.
It was noticed when studying the integration of
the Jiuquan wind power base in Northwest China
that the large wind power output fluctuations
would cause large voltage fluctuations in the
whole network, especially at the nodes in the
transmission corridor. To stabilize voltage, many
voltage-regulating devices must act frequently
and in a well-coordinated way, which is harmful
for the equipment and difficult to implement. In
order to solve this problem, a 750 kV CSR was
installed on the Dunhuang substation’s 750 kV
bus (see Figure 4-6), with field testing completed
at the end of 2011. Developed by CEPRI, it has a
capacity of 300 Mvar and 4 controllable grades:
100 %, 75 %, 50 % and 25 %; the adjustment
range is 25 %-100 %.
Table 4-2 – Comparison between 1 000 kV and 500 kV AC transmission: gain factors
Item
Typical
capacity
Economic
distance
Power Loss
Corridor width
per kW
Comprehensive
construction
cost per kW
1 000 kV/500 kV 4~5 1.5~2 1/4 1/3 3/4](https://image.slidesharecdn.com/gridintegration-140608024623-phpapp02/85/Grid-Integration-Of-Large-Scale-68-320.jpg)
![69
3) Higher voltage level DC transmission:
UHVDC
CSC-HVDC is a conventional HVDC transmission
technology that is relatively mature and has long
been used for long-distance, large-capacity
power transmission without midway drop points,
as well as for the interconnection of asynchronous
power networks. Compared to AC transmission,
it has advantages such as lower loss, lower
line cost, narrower corridor and rapid power
control capabilities. Like AC transmission, DC
transmission is also progressing in the direction
of ultra-high voltage levels for larger-capacity and
longer-distance power delivery. Again, China is
leading in the application of ultra-high voltage DC
(UHVDC) transmission. The 1 907 km, 6 400 MW,
±800 kV UHVDC demonstration project from
Xiangjiaba to Shanghai was commissioned in
April 2010. SGCC has planned to build more than
ten ±800 kV or ±1 100 kV lines to transmit power
from the wind power bases in Xinjiang, Gansu and
Inner Mongolia to the Northeast-Central China
load centres, ranging in length from 1 600 km to
2 700 km [sgc11], as shown in Figure 4-7.
Figure 4-6 – 750 kV CSR at the Dunhuang substation, NW China
(SGCC)
Figure 4-7 – UHVDC transmission plan for some 10 GW-level wind power bases in China
(SGCC)
800 kV-DC
1000 kV-DC
1100 kV-DC
North China Grid
Mengdong
MengxiXinjiang
Jiuquan
Northwest China Grid
Central China Grid East China Grid](https://image.slidesharecdn.com/gridintegration-140608024623-phpapp02/85/Grid-Integration-Of-Large-Scale-69-320.jpg)
![70 S E C T I O N 4
Future: technical solutions for integrating more large-capacity RE
Figure 4-8 – Design for transmitting wind power only with HVDC
(SGCC)
Figure 4-9 – “Wind-fire bundling” design with HVDC transmission
(SGCC)
Figure 4-10 – “Wind-fire bundling” design with HVDC transmission and local grid
(SGCC)
AC
DC AC
DC
Load centre
HVDC
Wind power base
AC
DC AC
DC
Coal power base
power base
Load centre
HVDC
Wind
AC
DC AC
DC
Local grid
Coal power base
power base
Load centre
HVDC
Wind
However, there are still some problems in
the use of CSC-HVDC or UHVDC to transmit
RE [hsh12]. For example, when HVDC lines
are used to transmit only wind power to load
centres (see Figure 4-8), not only the low
utilization rate problem mentioned in 4.3.3, but
also the minimum startup power of the HVDC
lines and problems in frequency stability and
voltage stability require more research.
The “wind-fire bundling” design (see Figure 4-9)
can withstand common wind disturbances,
but if wind speeds change rapidly frequency
is difficult to control. Without strong voltage
support, outages on the sending end may
lead to voltage collapse and disconnection of
wind generators, depending on the electrical
distance between coal and wind power plants.
With voltage support from the local AC grid
(see Figure 4-10), the stability problems can be
mitigated, but attention should be paid to the
impact of wind power fluctuation on the local
grid.](https://image.slidesharecdn.com/gridintegration-140608024623-phpapp02/85/Grid-Integration-Of-Large-Scale-70-320.jpg)
![71
4) More flexible DC transmission: from
VSC-HVDC to MTDC and DC grids
The major advantages of VSC-HVDC as
compared to conventional CSC-HVDC described
in 3.3.2 make it not only suitable for application
in RE integration, but also more convenient to
form multi-terminal DC (MTDC). Three or more
converter stations are linked to each other with
DC lines, each interacting with an AC grid, which
facilitates flexible multi-grid interconnection and
even DC grids. These will be useful in future RE
integration where multiple resource sites and
multiple receiving ends are involved.
The preference for VSC-HVDC for relatively
long-distance offshore wind power integration is
presented in Figure 4-11. It is clear that for short
distances and relatively low power high voltage
alternating current (HVAC) technology will
suffice. As power as well as distance increases,
HVAC should be augmented with FACTS devices
in order to compensate for HVAC losses and to
provide stability support. In order to connect
remote offshore wind power plants to a grid,
VSC-HVDC technology is preferred.
In order to tap large quantities of offshore wind
power from the North Sea, a transnational
offshore grid based on multi-terminal VSC-
HVDC has been proposed. A simulation
benchmark test system has been developed to
facilitate detailed investigations into operational
questions, as shown in Figure 4-12. Study
results show that extensive coordination of
control systems is essential, both in order to
avoid unwanted DC loop flows and to find the
location of the optimal slack node in the system,
which also depends on the selection criteria
chosen [coc11]. Multi-terminal VSC-HVDC has
also been adopted in the design of the Tres
Amigas Super Station project proposed in the
USA to interconnect its Eastern, Western and
Texas power grids, as well as to fully exploit the
abundant RE resources near the project site
[ete11] [tgs12]. In EU’s Super Grid plan, MTDC
and DC grids based on VSC-HVDC technology
will also play an important role.
Figure 4-11 – Transmission technologies for
integrating offshore wind power
[ern11]
Figure 4-12 – Benchmark test system for the
European transnational offshore grid
[coc11]
VSC Offshore Grid
VSC Country Interconnectors
ac Offshore Grid
Onshore
Grid NL
Onshore
Grid DE
Onshore
Grid DK
Onshore
Grid NOR
NOR
DK
DE
NL
295 MW
200 MW
210 MW
©
600 MW
300 MW
468 MW
282 MW
303 MW
1,648 MW
600 MW
1,000 MW
1,000 MW
∑
=
–5,000
M
W
700 MW
Cobra – 700 MW
1,400
M
W
NordLink–1,400MW
Hub NL
Hub DE
Hub DK](https://image.slidesharecdn.com/gridintegration-140608024623-phpapp02/85/Grid-Integration-Of-Large-Scale-71-320.jpg)
![72 S E C T I O N 4
Future: technical solutions for integrating more large-capacity RE
To date, VSC-HVDC has not reached voltage or
capacity as high as CSC-HVDC, and VSC-HVDC
terminals also suffer from higher power loss.
VSC-HVDC transmission with voltage levels less
than ±150 kV and capacity less than 200 MW
is relatively mature. VSC-HVDC transmission
projects with voltage levels of 350 kV and
capacity of 400 MW have been commissioned,
but they are still much smaller than recent
±800 kV, 6 400 MW CSC-HVDC projects.
The power loss in a VSC-HVDC converter
station is typically 1 %-6 % currently, much
higher than the 0.5 %-1 % loss of a CSC-HVDC
converter station. Predominantly VSC-HVDC
installations use cables as the transmission
medium, although a 350 kV VSC-HVDC using
overhead lines has been commissioned by ABB
in Namibia at the Caprivi Link. One of the limits
imposed on the power transfer capability of a
VSC-based HVDC system lies in the capability
of DC power cables. Predominantly DC power
cables are used with VSC-HVDC connections
to help ease right-of-way discussions, and
they are the only option for offshore VSC-
HVDC connections. However, with the option of
overhead lines for VSC-HVDC, power levels can
increase as VSC technology advances. Finally,
since most VSC-HVDC projects have been
operating for only a few years, the overall long-
term security and reliability of VSC-HVDC also
remain to be proved over time, as with any new
type of technology.
4.4.3 Developments in transmission
planning
1) Current practice in transmission
planning
Up to now, transmission planning has
mainly been based on expert judgment
and deterministic simulations based on
mathematical models of the power network
and its components. For one scenario of load
forecast and generation portfolio for the year
studied, transmission alternatives are first
proposed by planning experts, then extensive
simulations are performed, including power
flow, stability and short-circuit studies, among
others, under typical normal and contingency
situations (generally “worst cases”), to verify
whether the deterministic planning criteria
can be met. If not, modifications are made to
the alternatives and simulations are re-run.
For technically viable alternatives, economic
comparisons may be made to find the best
one. In some cases, in order to account for
uncertainty, several scenarios of load forecast
and generation portfolio may be considered as
a so-called “sensitivity analysis” or “scenario
method”.
2) Towards probabilistic transmission
planning
The necessity of probabilistic transmission
planning has been acknowledged in the
research and industry community, following the
realization that deterministic planning methods
may not be able to reflect the probabilistic
nature of outage and system parameters, and
that the widely used N-1 security criterion
may be insufficient to capture the real “worst
case”, for which a corresponding risk analysis
is necessary. As the separation of generation
and transmission planning resulting from power
market restructuring has made deterministic
transmission planning less meaningful, the
increasing uncertainty introduced by large-
capacity RE integration is making the need for
probabilistic transmission planning more urgent
[bac11] [mit11] [pts11].](https://image.slidesharecdn.com/gridintegration-140608024623-phpapp02/85/Grid-Integration-Of-Large-Scale-72-320.jpg)
![73
Rather than replacing traditional deterministic
transmission planning, probabilistic planning is
called to complement it by adding probabilistic
planning criteria and evaluation in the planning
processes, as shown in the conceptual flow
chart in Figure 4-13.
Probabilistic planning criteria, tools and
techniques have been developed for
probabilistic transmission planning over the
past several decades; however, they will require
critical review for completeness and applicability
before they can become accepted by industry.
More research on additional probabilistic
planning techniques is required. High-quality,
high-resolution datasets of RE generation are
also necessary; they are currently very limited
and difficult to obtain [ner09].
Figure 4-13 – Conceptual flow chart of probabilistic transmission planning
[pts11]
Initial 7 alternatives
5 alternatives
3 alternatives
The best alternative
Environmental, societal,
and political assessment
Deterministic technical
analysis, including N-1
principal
Probabilistic reliability
evaluation
Probabilistic economic
analysis](https://image.slidesharecdn.com/gridintegration-140608024623-phpapp02/85/Grid-Integration-Of-Large-Scale-73-320.jpg)
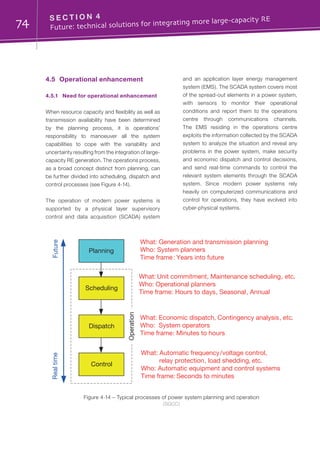
![75
Historically, various operational tools (EMS
applications)havebeendevelopedanddeployed
to successfully address the existing variability
and uncertainty in power systems. As variability
and uncertainty increase substantially due to
the integration of large-capacity RE generation,
enhancements have to be made to major
operational tools as well as some operational
practices; the development and incorporation
of more accurate RE power forecasting is critical
to most of these enhancements. The integration
of large-capacity RE generation may also pose
more challenges to cyber-security.
4.5.2 More accurate RE power forecasts
As described in section 3.4.1, many wind
power forecast methods and programs have
been developed in the last two decades, and
the forecast accuracy has been significantly
improved, especially for short-term forecasts.
However, the forecast accuracy is still low as
compared to load demand forecasts, especially
for day-ahead and longer time horizons. In
addition, the need to forecast significant weather
events and provide probabilistic information
along with forecast results is not well addressed.
Listed below are some directions for improving
forecast accuracy and the value of forecasting
in operations [atp11] [ner09] [pei12] [sad11].
1) Model and data improvement
Improvements in atmospheric observation and
numerical weather prediction models are critical
for improving RE power forecast accuracy; here,
a promising avenue is collaboration among
related sectors at national and international
levels to improve boundary-layer weather
forecasts. Collection and processing of high
quality meteorological and electrical data from
RE power plants, both historical and real-time,
is also essential, and for this purpose four-
dimensional data assimilation technology may
play an important role.
2) Centralized forecast and ensemble
forecast
Centralized forecasting at system level can
improve forecast accuracy as compared to
plant-level forecasts, thanks to the spatial
smoothing effect mentioned in section 3.4.1.
It is also beneficial for error reduction that the
single centralized forecasting system should
receive input data from several commercial
forecast providers and combine them to form a
single ensemble forecast.
3) High-resolution plant-level forecast
and nodal injection forecast
While centralized forecasting is the best
approach for system-level forecasts, high-
resolution separate forecasts at different RE
power plants are also very important for RE
generation dispatch, and for determining the
power injected into each delivery node in the
power system for managing transmission
congestion.
4) Ramp events forecast and situational
awareness
Forecasting of ramp events, sudden and large
RE generation output changes caused by severe
weather events, is of great importance to provide
situational awareness to grid operators and help
decision-making. However, the definition and
forecast methods of ramp events need more
research before ramp event forecasts can be
integrated into forecasting products.](https://image.slidesharecdn.com/gridintegration-140608024623-phpapp02/85/Grid-Integration-Of-Large-Scale-75-320.jpg)
![76 S E C T I O N 4
Future: technical solutions for integrating more large-capacity RE
5) Human forecast
System operators may become good human
forecasters after accumulating years of
experience. They sometimes outperform
advanced forecasting tools. More research
is needed into how best to combine human
forecasts with computed forecasts.
6) Probabilistic forecast
By providing not only the value but also the
probability of expected RE power production
or ramp events, probabilistic forecasts could
become very valuable for system operations.
4.5.3 Enhancement of operational tools
and practices
Power system operation is the field that sees
the most prominent and direct impacts of
large-capacity RE integration. Many aspects of
enhancements to operational tools and practices
have been discussed in the literature [coc11]
[ner09] [opp11] [sad11] [sin12]. Briefly cited below
are some major enhancements related to EMS
applications. The underlying principle behind
these developments is to improve operators’
situational awareness by evaluating potential
events and their impacts, and to provide operators
with guidance on possible mitigating measures.
1) Unit commitment
Detailed unit commitment (UC) studies are
normally conducted one day ahead, to determine
what amount and types of conventional
generation units should be available at what
time to ensure the desired generation capacity,
and also enough flexibility to address system
variability and uncertainty. With increased levels
of RE generation it is recognized that UC will
not be effective unless the RE power forecast
is taken into account, and that it should be run
more frequently, say every 4 to 6 hours or at
even shorter intervals, or alternatively each time
a new RE power forecast is provided.
2) Contingency analysis
Contingency analysis (CA) assesses the impacts
of potential contingencies, which are normally
outages of different grid components, under
certain operating conditions. With increased levels
of RE generation, the contingency set must be
augmented to include those extreme ramp events
which are due to RE and outages of RE power
plants. Information from the RE power forecast is
needed to determine potential contingencies.
3) Online dynamic security analysis
Online dynamic security analysis (DSA) has
been implemented in many power system
control centres to help operators make the
right operational decisions. It evaluates system
security and stability limits based on near-real-
time network topology and operating conditions,
such as the transmission line thermal limits and
the system voltage/transient/frequency stability.
By incorporating the RE power forecast and
modelling, an online DSA system can be adapted
to cope with the operational risks and challenges
resulting from increased levels of RE generation.
As an example of such a tool, the wind security
assessment tool (WSAT) implemented in
EirGrid’s control centre (see Figure 4-15) is used
to assess the instantaneous secure amount
of wind generation based on voltage stability
analysis (VSA) and transient stability analysis
(TSA) under normal operating conditions and
credible faults.](https://image.slidesharecdn.com/gridintegration-140608024623-phpapp02/85/Grid-Integration-Of-Large-Scale-76-320.jpg)
![77
4) Security constrained economic dispatch
Security constrained economic dispatch
(SCED) determines how to dispatch generators
to produce electricity at the lowest cost subject
to reliability requirements and operational limits
on generation and transmission facilities. It
is now evolving to accommodate two major
directions of power system development: the
increase in high penetration RE generation
and the development of demand response
and smart grid applications (see 4.6). As
described in 4.3, more flexibility is needed
from conventional generation to integrate high
levels of large-capacity RE generation, and the
increased ramping and cycling requirements of
thermal power plants will lead to a significant
increase in their operational costs. These costs
have to be better understood before they can
be taken into account to improve the economic
dispatch process.
5) Automatic generation control
AGC is a centralized system designed to
ensure real-time generation/load balance
and frequency stability, by regulating the
power output of selected generation units
and exchanging power on tie-lines between
different power systems or control areas.
Existing AGC algorithms need to be modified
so that, based on RE power forecasts, they
may address the variability and uncertainty
of RE generation. There is also an increasing
requirement to regulate the output of RE
power plants in addition to that of conventional
generation units, based on the advanced
control capabilities and the monitoring, control
Figure 4-15 – Wind Security Assessment Tool (WSAT) structure
[sin12]
Other
information
WSAT Manager
Near real-time
wind limits
Security
violation details
Wind
forecast
Real-time
system
snapshot
Real-time
contingencies
Input Data
Results display
Pythoninterface
Study
WSAT
Online
VSAT
Online
TSAT
Security assessment](https://image.slidesharecdn.com/gridintegration-140608024623-phpapp02/85/Grid-Integration-Of-Large-Scale-77-320.jpg)
![78 S E C T I O N 4
Future: technical solutions for integrating more large-capacity RE
and data communication systems for RE power
plants described in section 4.2.
6) Stochastic operations and risk-based
decision making
To address the increased uncertainty,
including that related to RE power forecasts,
many researchers believe that future EMS
applications should make greater use of
stochastic modelling techniques. Stochastic
UC, stochastic SCED and stochastic optimal
power flow, for example, should be feasible
by taking advantage of the greater computing
power now available. Risk-based decision
making techniques are also needed to improve
the current deterministic and binary decision-
making process; for this, research on how to
quantify the relevant operational risks and the
severity of contingencies such as extreme ramp
events is critical.
7) Security and defence generally
“Security” in DSA and SCED (see above)
mainly refers to the physical aspects of power
system security, or security of supply. As a
cyber-physical system, the power system also
faces cyber-security challenges, including
the reliability of the communications systems
serving the power system, and protection of
critical information related to power system
monitoring and control as well as confidential
customer information [top12]. Failures in
cyber-security, especially those caused by
malicious cyber attacks on the control system,
may damage power system elements and
endanger the physical power system’s security
of supply. Since large-capacity RE power
plants are usually remotely located and consist
of many widely-distributed, small-capacity
generating units, the cyber-security of their
control systems may require more attention.
Although substantial efforts have been made
by some organizations to address control
system security, such as the power system data
communication standard protocols developed
by IEC Technical Committee (TC) 57 and widely
used in power equipment, SCADA and EMS,
cyber vulnerability is still a salient problem,
and is becoming even more complex with the
development of smart grids [iig12] [sic12].
Moreover, as power systems, meteorological
systems, communications networks, water,
commerce, etc., the so-called “critical
infrastructures”, become more closely
integrated, it becomes increasingly important
that the security protocols in one sector are
considered within the broader context of the
security protocols in connected sectors, as
well as the security needs of the country and
region. This issue involves harmonization of
cyber-security policies both vertically (e.g.
from system operation down to individual
wind turbine control) and horizontally (e.g.
from the power grid to emergency services
and telecommunications). With regard to RE
integration, this would suggest a need for
integrated security policies between weather
forecast systems and power system operation,
specifically dispatch. For example, a highly
secure power grid system with high RE
concentrations could still be quite vulnerable
to an attack that targets the country’s weather
forecasting service, either disrupting forecasting
or providing false forecast data. A grid operator
who relied on such data might find himself in
serious trouble, beyond simple variations in
forecast.](https://image.slidesharecdn.com/gridintegration-140608024623-phpapp02/85/Grid-Integration-Of-Large-Scale-78-320.jpg)
![79
4.6 Demand response
4.6.1 Demand response applications for
RE integration
Demand response (DR), the development and
extension of traditional demand-side management
or load management practices, is recognized as
a key application of the smart grid. Currently the
USA is far in the lead in research and application
of DR, with Europe, China and other countries
catching up [jef11]. The US Federal Energy
Regulatory Commission’s (FERC) definition of
DR is: “Changes in electric use by demand-side
resources from their normal consumption patterns
in response to changes in the price of electricity,
or to incentive payments designed to induce lower
electricity use at times of high wholesale market
prices or when system reliability is jeopardized”
[adr11]. While this definition covers well the
current DR practices in the USA, it may not be
able to reflect DR’s evolving capabilities, including
those expected to support RE integration.
AsREpenetrationrises,DR’svalueasanadditional
source of power system flexibility to compensate
for the variability and uncertainty of RE generation
will increase. For example, REE (Spain) created
a demand-side management department in
2007 in order to promote demand management
mechanisms such as interruptible service, electric
vehicle integration, smart metering and time-of-
use tariffs. These mechanisms, used together,
are expected to enhance the ability of the system
to integrate increasing quantities of RE [coc11].
DR can help RE integration in two main ways,
load shifting and balancing.
1) Load shifting
DR can be deployed to transfer a part of the
load to off-peak periods to absorb excess
RE generation, particularly for wind power
generation, which often exhibits inverse-
peaking characteristics: generating more
power during off-peak periods and less power
during peak demand periods. At off-peak
periods, conventional generation plants are
often already reduced to their minimum output,
and the insufficiency in demand will make wind
power curtailment inevitable, reducing wind
power plants’ capacity utilization efficiency and
preventing the replacement of fossil-fuelled
power generation for emission reduction.
Shifting load to off-peak periods also brings
additional energy efficiency and cost benefits
for customers. For example, Denmark has
implemented zero- and negative-spot electricity
prices to encourage customers to use electricity
during hours of excess wind generation, and
has planned for increased integration between
the transport, heating and electricity sectors
to find new sources of off-peak load for wind
energy [coc11].
2) Demand-side balancing services
Fast-acting DR can be deployed to help balance
generation and load in real time. Loads can
be aggregated and directed to respond very
quickly and therefore be capable of following
the fast ramps of RE generation, reducing the
need for ramping capability from conventional
generation [ded10]. Some system operators
are already using DR to counter down-ramps
of RE generation, showing flexibility potentially
equal to conventional generation options. But
different types of load have different response
capabilities and different costs of response,
and more research is needed to identify the
true aggregate value and capability of DR in this
area [ner09].](https://image.slidesharecdn.com/gridintegration-140608024623-phpapp02/85/Grid-Integration-Of-Large-Scale-79-320.jpg)
![80 S E C T I O N 4
Future: technical solutions for integrating more large-capacity RE
4.6.2 Demand response practices and
trends
The practices of DR vary not only among
different countries due to differences in
electricity markets, technological development
and goals for deploying DR, but also inside the
boundaries of certain countries. The leading
DR programmes in the USA can generally be
classified into two categories: dispatchable
programmes and reactive programmes [mit11].
a) Dispatchable programmes, also known
as load management or control programmes,
allow direct control of load responses by the
grid operator or a third-party aggregator. An
incentive is often offered to customers in return
for participation.
b) Reactive programmes rely on customers’
voluntary responses to a variety of signals
communicated to them. The most common
signal used at present is price, although other
types of information, such as environmental
signals or neighbourhood-comparative data,
may prove useful in the future. Reactive
programmes can further be divided into
wholesale programmes administered by
independent system operators (ISOs) and
regional transmission organizations (RTOs), and
retail programmes that present customers with
retail prices carefully determined by specific
time-varying pricing structures.
Each of the dispatchable, wholesale and retail
reactive programme categories consists of
several types of programmes, as shown in
Figure 4-16. According to a recent survey [adr11],
they respectively contributed to approximately
62 %, 27 % and 8 % of the nation’s potential
peak load reduction (aggregate load enrolled
in DR programmes). Although dispatchable
programmes still represent a high proportion of
enrolment, the advent of smart metres, which
allow for two-way information flows between
customers and utilities, has enabled the growth of
reactive programmes and increased engagement
with residential and commercial customers.
Figure 4-16 – Types of DR programmes in the USA
(SGCC)
Load control
programmes
(62 %)
Emergency payment programmes (25 %)
Demand
response
Wholesale
programmes
(27 %)
Retail
programmes
(8 % )
Interruptible tariff programmes (20 %)
Direct load control programs (17 %)
Capacity market programmes
Energy price programmes
Ancillary service programmes
Critical peak pricing programmes
Peak time rebate programmes
Real-time pricing programmes
Time-of-use prices programmes
(Dispatchable programmes)
(Reactive programmes)](https://image.slidesharecdn.com/gridintegration-140608024623-phpapp02/85/Grid-Integration-Of-Large-Scale-80-320.jpg)
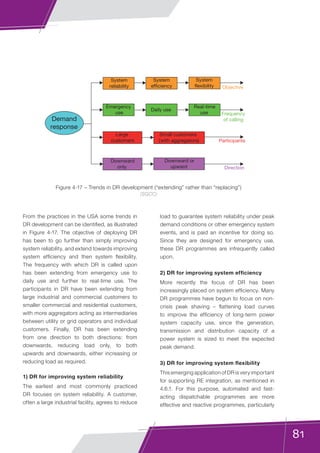
![82 S E C T I O N 4
Future: technical solutions for integrating more large-capacity RE
price-mediated retail programmes, may be
less effective. Changes to market rules and
reliability standards are also required in some
regions, to allow DR to participate in providing
balancing services [mit11]. This application of
DR is further envisioned in [ded10] as demand
dispatch, which is expected to perform many of
the same ancillary services currently provided
by conventional power plants. Potential loads
that are suitable for demand dispatch are
those that, when remotely controlled, would go
largely unnoticed by the customers, such as
electric hot water heaters, heating-ventilation-
air conditioning systems and electric vehicles.
4.6.3 Technologies supporting more
demand response
Although the success of DR programmes
depends to a very large extent on effective
commercial arrangements (including rate
structures and pricing schemes) and on an
accurate evaluation of cost-effectiveness, some
new technologies are physically essential for
DR to function or to function better. We discuss
these briefly here.
1) Advanced metering infrastructure
technology
Advanced metering infrastructure (AMI)
technology, commonly known as “smart
metering”, permits fine-grained communication
of system conditions to customers and fine-
grained measurement of customer responses
via two-way communications between the
customer and the utility. It is the technical
foundation for engaging more DR, especially
from smaller customers in the future. It allows
customers to receive information signals from
utilities involving price, environmental impact
and other aspects, and utilities to receive time-
of-use data that reveals how much energy
customers use at any given time [mit11].
2) “Behind-the-meter” technologies
AMI and home area networks also enable the
use of a host of consumer-side technologies
for building or home energy management, such
as controllable appliances, monitoring and
analysis of energy use, and price-responsive
thermostats. These technologies can enable
smaller commercial and residential customers
to respond more actively to price or other
supply-side signals. However, currently they are
relatively immature and costly [mit11].
3) Electric vehicles
Plug-in electric vehicles (EVs) are being
promoted in a variety of useful roles. Not only
are EVs low-emission, but they also have the
potential to function as storage facilities from
which energy can be dispatched to the grid or
the home; they can be a dispatchable, night-
time load to soak up excess wind energy; and
they can provide balancing energy and ancillary
services for RE integration.
4) Cyber-security solutions
Since DR involves the coordinated reaction or
control of a large number of loads using very
many communications messages, there are
serious concerns with the cyber-security risk.
First, private customer information such as that
concerning living habits might be vulnerable;
this concern has led to public opposition to AMI
and DR in some places. Secondly, information
can be intentionally modified or faked to gain
a financial advantage by fraud. Even more
seriously from the system operation point of
view, there are concerns that DR could be](https://image.slidesharecdn.com/gridintegration-140608024623-phpapp02/85/Grid-Integration-Of-Large-Scale-82-320.jpg)
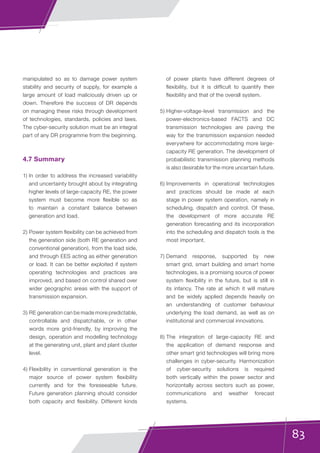


![86 S E C T I O N 5
Application of large-capacity EES to support RE integration
5.1 General
This section examines the many uses of large-
capacity energy storage to meet grid needs in
the integration of large-capacity RE. Section 4
identified the need for greater flexibility in
power systems as RE penetrations rise, and
divided sources of flexibility into grid-friendly
RE generation, generation flexibility, demand
response, system operation, and transmission
expansion. Here we revisit the first three
concepts with an emphasis on energy storage
as a means of providing generation flexibility for
the grid, RE generation flexibility, and flexibility
through demand response via electric vehicles.
Energy storage, due to its tremendous range
of uses and configurations, may assist RE
integration in any number of ways. These uses
include, inter alia, matching generation to loads
through time-shifting; balancing the grid through
ancillary services, load-following, and load-
levelling; managing uncertainty in RE generation
through reserves; and smoothing output from
individual RE plants. We do not examine energy
storage technologies themselves in great detail
here, as the MSB EES Report [msb11] has
already done so. Nor do we cover applications of
energy storage for purposes not directly related
to RE integration. Please refer to the MSB EES
Report for a detailed and thorough discussion
of all relevant energy storage technologies and
their entire scope of use.
5.2 Promising large-capacity EES
technologies
The universe of energy storage applications
maps closely to the challenges of integrating RE
into the grid. In the same way that RE integration
creates needs at a variety of temporal scales,
different types of energy storage are suited
to different discharge times, from seconds to
seasons. The tremendous application range of
storage is shown in Figure 5-1.
Figure 5-1 – Comparison of rated power, energy content and discharge time of different EES technologies
[msb11]](https://image.slidesharecdn.com/gridintegration-140608024623-phpapp02/85/Grid-Integration-Of-Large-Scale-86-320.jpg)
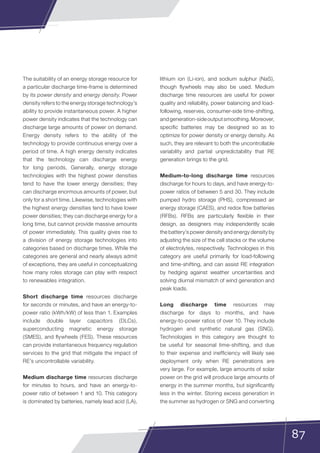
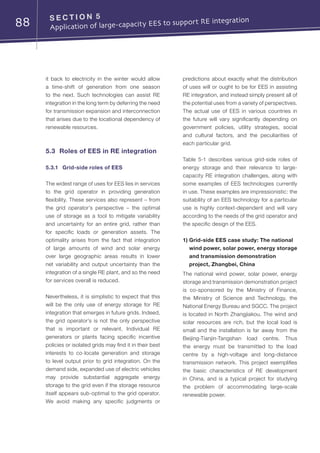
![89
Table 5-1 – Grid-side roles of EES
[msb11] [tre10]
Role Time scale(s) Description Benefits to RE integration
Examples of EES
technologies
Time shifting / Arbitrage /
Load levelling
Hours to days
EES allows storage of off-
peak energy and release
during high-demand
period
A solution to diurnal
generation cycles that do not
match load cycles
NaS batteries,
CAES, PHS, RFB
Seasonal shifting Months
EES stores energy
for months at a time,
releasing it at times of the
year when RE output is
typically lower
Allows use of renewably-
generated energy year-
round, reducing reliance
on traditional generation
in seasons with, e.g., low
sunlight
Hydrogen, SNG
Load following / Ramping
Minutes to
hours
EES follows hourly
changes in demand
throughout the day
May mitigate partial
unpredictability in RE output
during critical load times
Batteries, flywheels,
PHS, CAES, RFB
Power quality
and stability
1 second
Provision of reactive
power to the grid to
handle voltage spikes,
sags and harmonics
Mitigates voltage instability
and harmonics caused
or exacerbated by
uncontrollable variability of
RE generation
LA batteries, NaS
batteries, flywheels,
RFB
Operating reserves
Frequency regulation
Seconds to
minutes
A fast-response increase
or decrease in energy
output to stabilize
frequency
Mitigates uncontrollable
moment-to-moment
variability in RE generation
output
Li-ion batteries, NaS
batteries, flywheels,
PHS (with advanced
variable speed
control)
Spinning Reserves ~10 Minutes
A fast-response
increase or decrease in
energy output to cover
a contingency, e.g.
generator failure
Mitigates partial
unpredictability of RE
generation output, providing
(or removing) energy when
the RE resource does not
perform as expected
PHS, flywheels,
batteries
Supplemental reserves
Minutes to
hours
A slower response
resource that comes
online to replace a
spinning reserve
Provides firm power in the
event of an especially severe
and long-lasting drop in RE
output. Use for RE integration
is expected to be infrequent
and low-value
PHS
Efficient use of
transmission network
Minutes to
hours
EES can help grid
operators defer
transmission system
upgrades through time-
shifting and more efficient
operating reserves
Reduced transmission
costs, mitigates locational
dependency challenges of
RE generation
Li-ion
Isolated grid support
Seconds to
hours
EES can assist in the
integration of RE on small
power grids, such as
those in use on islands
Time-shifting and power-
quality applications to
mitigate variability and
unpredictability of RE
generation
LA batteries
Emergency power supply
/ Black start
Minutes to
hours
EES may be used to
re-start the power
system in the event of a
catastrophic failure
No specific benefit accrues
to RE integration, but storage
resources may nonetheless
provide black start capability
to the grid
LA batteries](https://image.slidesharecdn.com/gridintegration-140608024623-phpapp02/85/Grid-Integration-Of-Large-Scale-89-320.jpg)
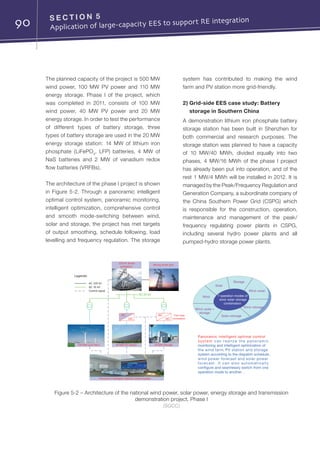
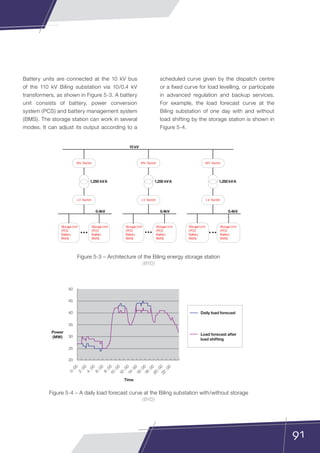
![92 S E C T I O N 5
Application of large-capacity EES to support RE integration
3) Grid-side EES case study: Multi-
application use of pumped hydro
storage in Taiwan
Though PHS is historically associated with
time-shifting, newer units offer a considerably
expanded range of operation, including the use
of PHS for operating reserves such as frequency
regulation and spinning reserves. The Taiwan
Power System, for example, contains ten PHS
units: four 250 MW units located at the Ming-Hu
hydro plant and six 267 MW units located at the
Ming-Tan hydro plant.
Because Taiwan’s grid is isolated, it must
guarantee sufficient operating reserves to
maintain system frequency without load-
shedding in the event of the failure of its
largest generating unit. In Taiwan’s case, this
largest unit is 950 MW, a substantial portion of
Taiwan’s 34 630 MW of capacity. Taiwan thus
uses PHS units in daily operations for both
time-shifting and operating reserve functions
simultaneously. During peak demand periods,
the PHS units are operated in generating mode,
supplying both frequency regulation through
automatic generation control of the turbine
speed and a reduction in system operating
costs by replacing peaking generators. During
off-peak periods, PHS units operate in pumping
mode to consume surplus energy, and also
offer emergency reserves by way of PHS load-
shedding. That is, if a large generator fails in an
off-peak period, the PHS’s load from pumping
may be immediately shed to stabilize system
frequency [rvp08].
5.3.2 Generation-side roles of EES
Operators of RE generation plants may use
energy storage technologies to assist in the
integration of a particular plant, or of several
plants that feed into the same substation. Using
the terminology of section 4, EES used in this
fashion serves to improve the grid-friendliness
of RE generation itself. It is important to
understand that generation-side use of energy
storage is not simply a shift in ownership of
the storage resource, but an entirely different
role for storage from that envisioned by grid-
side use of EES. Rather than using EES as a
tool to balance an entire power grid, an RE
generation plant may use EES to provide
integration applications prior to grid integration,
either at the plant or substation level. While the
technical requirements of generation-side EES
applications are similar to those of grid-side
EES, greater flexibility is required of generation
side EES facilities, because a single RE plant
exhibits greater variability and uncertainty than
many RE plants aggregated on the same grid.
This means that dedicating EES facilities to
specific RE generation results in proportionately
higher costs than using EES to balance net
variability and uncertainty on the grid. For
isolated and geographically-constrained grids,
Figure 5-5 – A PHS plant in Taiwan
[tem12]](https://image.slidesharecdn.com/gridintegration-140608024623-phpapp02/85/Grid-Integration-Of-Large-Scale-92-320.jpg)
![93
however, co-location of RE generation and EES
may be an attractive option, as balancing such
grids through interregional trading, conventional
backup capacity or demand-side management
is more challenging than for larger and more
interconnected grids.
Essentially, generation-side use of EES aims
to transform an uncontrollably variable and
partially unpredictable resource into a controlled
and predictable one – it turns RE generation
into something that looks very much like
conventional energy generation. Such an RE
generation resource is said to be dispatchable. It
may also play a role in effectively utilizing limited
transmission capacity, particularly where the
RE generation is located on an isolated or weak
grid. Generation-side uses of EES include:
• Time shifting. The dedicated energy
storage facility stores energy whenever
its generator produces it, and stands
ready to dispatch energy to the grid
when needed. This can make RE output
both predictable to grid operators and
co-temporal to demand. Time shifting
functions require EES facilities to store
large quantities of energy for significant
periods of time, from hours to days. NaS
batteries exemplify the qualities needed
for this function: they may store relatively
large amounts of energy efficiently for
hours at a time as well as ramp quickly, as
shown in Figure 5-6. Storage efficiency is
very important for economical operation
of time shifting, as an inefficient storage
facility will lose significant portions of the
energy it time-shifts. Efficiency varies
greatly by EES technology and also by the
operation profile, as is covered in detail in
the MSB EES Report.
Figure 5-6 – Comparison of battery output and duration
(NGK)
Li-ion batteryMobile PC Electric vehicle
System output [kW] Large capacity・Long hours
NAS battery
500 kW
~
More than 10 000 kW
(several hours)
10
100
1 000
10 000
100 000
0 2 4 6 8
Time [hours]
1
Lead-acid battery
Li-ion battery
(stationary)
Capacitor
fly wheel](https://image.slidesharecdn.com/gridintegration-140608024623-phpapp02/85/Grid-Integration-Of-Large-Scale-93-320.jpg)
![95
5.3.3 Demand-side roles of EES
Energy storage has a number of applications
for energy consumers; time-shifting to reduce
consumption of grid electricity at peak times,
firm power for off-grid, renewably-powered
homes or critical industrial applications, and
emergency power supply are a few examples.
These applications, however, are related more
to the needs of the consumer than to solving
particular challenges related to the integration
of large-capacity RE. In seeking demand-side
EES technologies that directly relate to large-
capacity RE integration, only one critical type
emerges: electric vehicles.
EVs are significant to RE integration because
of the potential for aggregation. While a single
EV can store a relatively small amount of
energy, many EVs all plugged into the grid at
the same time may someday be operated as
a single large energy-storage device, or virtual
power plant (VPP). As such an electric vehicle
virtual power plant (EVPP) may provide both
time-shifting and other energy applications to
store RE at times of low demand and release
it to meet peak demand, as well as operating
reserves such as frequency regulation service,
increasing quantities of which are needed as
more variable RE generation is added to a
system [mev09]. Such functions are referred to
as vehicle-to-grid (V2G) systems.
EVPPs providing V2G services must satisfy the
requirements of both vehicle owners and grid
operators. By aggregating individual vehicles into
a single controllable EES resource, an EVPP can
potentially achieve this balancing act, bidding and
providing ancillary services at all times without
locking a vehicle owner into a charging station
from which she or he cannot depart at will. Thus
the vehicle owner is not inconvenienced and
the grid operator may treat the EVPP as though
it were a conventional provider of ancillary
services [tec10]. Aggregation also allows for the
creation of a large enough virtual facility to meet
the capacity requirements of many ancillary
service markets, which are often too high for an
individual EV to satisfy.
Figure 5-8 – Compensation for intermittent RE
(NGK)
Compensation for intermittent renewable energy
Energy shift
Solar power
Wind power
Flat operation
Shifting a firm capacity to higher demand period
Smoothing and energy
shifting by NAS
PowerPower
PVoutput
Power
Charge
Discharge](https://image.slidesharecdn.com/gridintegration-140608024623-phpapp02/85/Grid-Integration-Of-Large-Scale-95-320.jpg)
![96 S E C T I O N 5
Application of large-capacity EES to support RE integration
EVPPs are still conceptual in nature, and involve
significant complexities that are beyond the
scope of this report. A number of modelling
efforts are presently examining EVPP feasibility
and architecture. One of the more robust and RE-
integration relevant modelling efforts is located on
the Danish island of Bornholm, which relies heavily
on wind turbines with 30 MW of wind capacity that
services 22 % of the island’s load. The EDISON
project on Bornholm aims to coordinate charging
and discharging of EVs so as to optimize utilization
of wind energy on the island’s grid. Successfully
implementing V2G functionality so as to support
grid integration of RE will require a host of new
standards and grid codes [evf10] [gcr09].
5.4 Technology needs of large-
capacity EES applications
The interconnection and facility management
needs of EES technologies are discussed at
length in the MSB EES Report, and these needs
do not change considerably when EES is used
to support RE integration. Consequently, we
do not cover those issues again here. Rather,
this section focuses on a larger-scale inquiry
as to the role of EES in assisting RE integration
on a specific electricity grid. That is, how can
a prospective operator of an EES facility – be it
grid-side, generation-side, or demand-side VPP –
determine whether and how to design, place and
utilize the facility? What type of storage to install,
and with what capacity, depends on how that
storage will be used. How it is used depends on
where it is located and the specifics of the power
system that it serves. Where it is located depends
on both what type of storage is being installed
and on the siting of other future generation.
EES technologies tend to be flexible; they can
provide multiple services within a number of
time scales, as explained above. A PHS plant
with a variable-speed turbine, for example, may
participate in both time-shifting functions and
frequency regulation. Its design specifications
Figure 5-9 – Bornholm’s distribution grid and power plant locations
[evf10]](https://image.slidesharecdn.com/gridintegration-140608024623-phpapp02/85/Grid-Integration-Of-Large-Scale-96-320.jpg)
![97
are likely to change depending on the proportion
of operations that fall under time-shifting and
the proportion of operations that fall under
regulation. Those proportions, in turn, depend
on the generation profiles and interconnection
status of electricity grids, which will change
substantially over the coming decades.
Because an EES technology can draw on a
number of value streams which themselves
may be met by other means, there is a need for
optimization of storage placement and use within
the context of the power system as a whole, both
today and into the future. Research on storage
optimization is already under way, but there
is relatively little convergence or organization
of results at the moment. In 2009 alone, over
500 published articles applied optimization
algorithms to RE in some way, but a review of
the literature demonstrates the experimental
and highly varied topics and approaches of the
researchers [oma11]. An “optimal” optimization
strategy that is ready for global, commercial-
scale use has yet to emerge for low-carbon
energy system planning.
In addition to their present lack of convergence,
an impressionistic review of several popular
storage-specific optimization studies reveals
a focus on optimizing economic dispatch
decisions for a specific type of storage facility
on a known grid configuration, often a simplified
or isolated grid [ede10] [mlt10] [ops08] [sco12]
[vce03]. These studies treat the installation of
an EES facility as an a priori decision. In other
words, they assume a storage facility, and then
go about determining its optimal operation.
This is not to say that such optimization studies
are not necessary and useful – they are most
certainly both, particularly to grid operators
working with existing or planned EES facilities.
But there is a need for peer-reviewed,
consensus-supported optimization tools at
a higher level of abstraction. Such tools could
provide commercial-level decision support
for the planning of storage on the grid at a
pre-installation stage from a more global
perspective, and across larger time scales.
Indeed, when considering the long-term needs
of global electricity grids as they accommodate
ever-increasing penetrations of variable RE, the
decision of when and where to place certain
kinds of energy storage in the first place is a
primary question. The HOMER optimization
model for distributed power, which allows a user
to evaluate economic and technical feasibility
for a wide range of remote, stand-alone and
distributed generation applications, represents a
potential starting point for developing such tools
[hey12].
Based on the topics discussed throughout this
paper, an EES planning and decision tool for
utilities and facility developers might consider
the following factors, both at present and in
future scenarios:
• amounts and net variability of RE
generation on the grid;
• interconnectivity of the grid to other grids,
and balancing capabilities between them;
• conventional backup capacity available
and desirable;
• demand-side management applications
and capabilities;
• system costs or market prices for
operating reserves, power quality
services, and balancing energy;
• time-shifting/arbitrage potential in relevant
energy markets; and
• technological capabilities and flexibility of
various EES technologies.](https://image.slidesharecdn.com/gridintegration-140608024623-phpapp02/85/Grid-Integration-Of-Large-Scale-97-320.jpg)
![100 S E C T I O N 6
Standards for large-capacity RE integration
6.1 General
Besides improvements in the technologies,
methods and operational practices described
in sections 4 and 5, improvement in standards
is another important aspect of supporting the
integration of more large-capacity RE generation
while maintaining power system reliability
and stability. Many device-level standards
have already been developed, such as the
IEC 61400 series on wind turbines developed
by IEC TC 88 and the IEC 60904 series on
PV devices developed by IEC TC 82. These
standards are very important for promoting
the development of wind and solar PV power
generation technologies. A new TC, IEC TC 117,
was also established in 2011 for solar thermal
power plants.
But for grid integration, more relevant are the
system-level integration standards prescribing
the performance of RE power plants and
their interaction with the power system, such
as the requirements for the interconnection,
design, modelling, testing, monitoring, control
and operation of RE power plants. Since solar
thermal power plants use steam-turbine-driven
synchronous generators and standards for
them can therefore easily be adapted from
those for conventional thermal power plants,
this section focuses on integration standards
for large-capacity wind and PV power plants.
6.2 Present situation
Currently, RE integration standards mainly
exist at the national level or grid company
level. Based on experiences and lessons
learned from the past and from other countries
[pei12], many countries or grid companies
have been updating their general grid codes,
or developing separate standards documents
such as requirements or guidelines, to meet the
demands of fast-growing wind and PV power
generation. Some standards for wind power
plant interconnection in some major countries
are listed in Table 6-1. Some of the grid codes
also include requirements for PV power
integration, since they are intended to address
the interconnection of all kinds of generation as
well as loads (i.e. all customers of the grid). The
major integration standards for wind and PV
power in China are listed in Table 6-2, including
national, industry-wide and grid company level
standards.](https://image.slidesharecdn.com/gridintegration-140608024623-phpapp02/85/Grid-Integration-Of-Large-Scale-100-320.jpg)
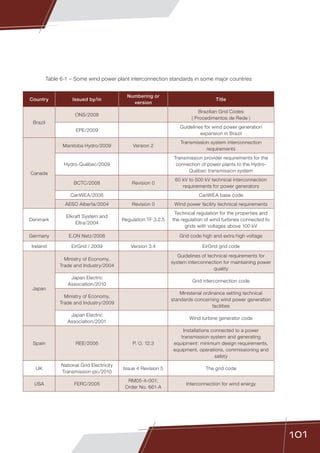
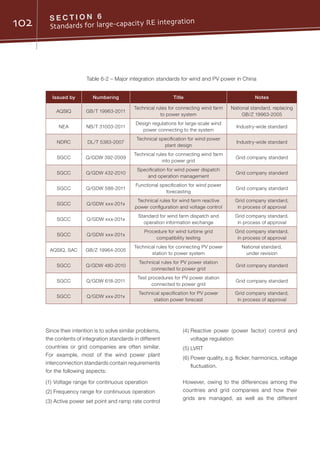
![103
features and development stages of RE
power generation, these integration standards
may also differ in much of their contents and
especially in the specific values of certain
requirements. For example, the newly updated
GB/T 19963-2011 (replacing GB/Z 19963-
2005) in China, which was issued at the end of
2011 and entered into force on 1 June 2012, also
sets out requirements on the number of circuits
connecting power plants to the grid, generation
forecast and report, configuration of reactive
power compensation, provision of simulation
models and parameters, communication with
the grid operator, and provision of field test
reports. To take the low-voltage ride-through
requirement as a specific example, Figure 6-1
shows the differences among major countries
or grid companies. In addition to the LVRT
requirement, some countries or grid companies
(e.g. E.ON Netz in Germany) also require wind
power plants to provide reactive power during
a fault period to help system voltage recovery.
6.3 Future needs
In order to support the integration of more large-
capacity RE generation, much standardization
effort is needed. Since it would not be useful to
discuss detailed technical requirements here,
some important general considerations are
given below.
1) Standards should be developed and kept
continuously updated to reflect advances in
RE generation technology and encourage
RE to become more grid-friendly, with
performance comparable or even superior
to that of conventional generators. For
example, the ability of wind power plants
to provide zero-voltage ride-through is
becoming an industry norm, high-voltage
ride-through is under discussion, and inertial
response may also be required in the near
future [pei12] [sra12].
Figure 6-1 – Differences in LVRT requirements in major countries or grid companies
(SGCC)
-0.2
0.0
0.2
0.4
0.6
0.8
Time (s)
0-0.2 0.2 0.4 0.6 0.8 1.0
ELTRA ELKRAFT E.ON Type 1 FERC REE
1.2 1.4 1.6 1.8 2.0 2.2 2.4
1.0
2.6 2.8 3.0 3.2 3.4
China](https://image.slidesharecdn.com/gridintegration-140608024623-phpapp02/85/Grid-Integration-Of-Large-Scale-103-320.jpg)
![104 S E C T I O N 6
Standards for large-capacity RE integration
2) Interconnection standards should place
performance requirements at the plant level
or at the point of interconnection rather than
interfere in how these requirements are met
within the RE power plant. RE power plants
should be treated as closely as possible in
the same way as conventional power plants
for equity and simplicity, while appreciating
the unique features of RE power generation.
3) Interconnection standards should also
consider anticipated as well as existing
conditions, aggregate impacts, and the
effects of displacing conventional generation
by RE generation. It is difficult to modify
requirements on existing facilities after the
fact [opp11].
4) Besides interconnection standards,
standards or best-practice documents are
also needed in the whole planning, design,
commissioning and operation process for
RE integration, such as modelling, testing,
communications, monitoring, control,
generation forecast, scheduling and
dispatch. For example, the Typical Design of
Wind Farm Electrical Systems [tpd11] issued
by SGCC in August 2011 has provided
modular design guidance for wind power
plants in China to meet the interconnection
performance requirements in an efficient
and cost-effective way. The IEEE PES Wind
and Solar Plant Collector System Design
Working Group is also planning to initiate
standards-making activities on wind power
plant collector system design [aba11]. In this
work, the collector system of a wind power
plant is informally defined as “everything in
the power plant that is not a wind turbine
generator”, which is similar to the concept of
“electrical system” used by SGCC.
5) Early experience in distributed RE integration
may be helpful for developing standards for
large-capacity RE integration, but large-
capacity RE integration differs in many
respects from distributed RE integration
and should be treated very differently. One
example is that the current standards for
relatively small-capacity PV power plants
may not be applicable to large-capacity
desert PV power plants. Another example is
the conflict between the LVRT requirements
of FERC Order NO. 661-A and IEEE
Standard 1547 for distributed resources
interconnection [bac11].
6) In addition to continuing the development
of device-level standards, the IEC should
make an effort to develop system-level,
performance-oriented RE integration
standards, based on relevant national,
regional or grid company standards.
Although the challenges and practices of
RE integration differ substantially among
different countries, there are many common
issues and interests. To enable this to
happen, platforms for worldwide research,
discussion and exchange of experiences
are needed. To facilitate communication,
developing a common language and
terminology for RE integration might be a
good starting point.
7) Other, supporting standards are also needed
in related technologies, such as MTDC
and DC grids as well as demand response
[des10], but they are only indirectly relevant.
The IEC and other standardization bodies in
some cases already have groups addressing
them.](https://image.slidesharecdn.com/gridintegration-140608024623-phpapp02/85/Grid-Integration-Of-Large-Scale-104-320.jpg)


![110 R e f e r e n c e s
[aba11] Richard Piwko, et al.: A Blast of Activity: Wind Power at the IEEE Power Energy Society,
IEEE Power Energy Magazine, 9(6), p26-35, Nov/Dec 2011.
[adr11] Federal Energy Regulatory Commission: 2010 Assessment of Demand Response and
Advanced Metering, p21, Staff Report, Feb 2011.
[atp11] Mark Ahlstrom, et al.: Atmospheric Pressure: Weather, Wind Forecasting, and Energy Market
Operations, IEEE Power Energy Magazine, 9(6), p97-107, Nov/Dec 2011.
[bac11] Mark G. Lauby, et al.: Balancing Act: NERC’s Integration of Variable Generation Task Force
Plans for a Less Predictable Future, IEEE Power Energy Magazine, 9(6), p75-85, Nov/Dec
2011.
[coc11] Hannele Holttinen, et al.: Currents of Change: European Experience and Perspectives with
High Wind Penetration Levels, IEEE Power Energy Magazine, 9(6), p47-59, Nov/Dec 2011.
[cvw11] Task Force on the Capacity Value of Wind Power, IEEE Power and Energy Society, et al.:
Capacity Value of Wind Power, IEEE Transactions on Power Systems, 26(2), p564-572, May
2011.
[ded10] Alec Brooks, et al.: Demand Dispatch: Using Real-Time Control of Demand to Help Balance
Generation and Load, IEEE Power Energy Magazine, 8(3), p20-29, May/June 2010.
[des10] Scott Coe, et al.: Demanding Standards: Developing Uniformity in Wholesale Demand
Response Communications to Enhance Industry Growth, IEEE Power Energy Magazine,
8(3), p55-59, May/June 2010.
[dlr05] German Aerospace Center, et al: Concentrating Solar Power for the Mediterranean Region,
Report, April 2005.
[eck11] V. Eckert: http://af.reuters.com/article/commoditiesNews/idAFL6E7NT1WK20111229?page
Number=2virtualBrandChannel=0, Article 2011, Accessed 29 March 2012.
[ede10] S. You, et al.: Economic Dispatch of Electric Energy Storage with Multi-service Provision,
IPEC 2010.
[eis11] Douglas Todd: Managing Large-Scale Penetration of Intermittent Renewables, MITEI
Symposium on Managing Large-Scale Penetration of Intermittent Renewables, Cambridge/
U.S.A, 20 April 2011.
[epa10] European Photovoltaic Association: Global Market Outlook for Photovoltaics until 2014,
Report, May 2010.
[ern11] Ernst Scholtz: Grid Integration of Renewables: Challenges and Technologies, MITEI
Symposium on Managing Large-Scale Penetration of Intermittent Renewables, Cambridge/
U.S.A, 20 April 2011.
[esp10] Gobierno de España: Spain's National Renewable Energy Action Plan, Report, 2010.
[ete11] Yi Zhang, et al.: Overview of the Practice of Renewable Generation Integration and
Transmission Planning in North America, Energy Technology and Economics, 2011, 23(8),
p1-7, 23, in Chinese.
[evf10] C. Binding, et al.: Electric Vehicle Fleet Integration in the Danish EDISON Project – A Virtual
Power Plant on the Island of Bornholm, IBM Research Report RZ 3761 (2010) # 99771.](https://image.slidesharecdn.com/gridintegration-140608024623-phpapp02/85/Grid-Integration-Of-Large-Scale-110-320.jpg)
![111
[ewe05] The European Wind Energy Association: Large Scale Integration of Wind Energy in The
European Power Supply: Analysis, Issues and Recommendations, Report, Dec 2005.
[ewe11] The European Wind Energy Association: Wind in Our Sails: The coming of Europe’s Offshore
Wind Energy Industry, Report, 2011.
[fat11] Aidan Tuohy, et al. Flexibility Assessment Tool: IEA Grid Integration of Variable Renewables
Project, IEEE Power Energy Society General Meeting Power System Flexibility Panel, 2011.
[gcr09] EDISON Consortium: Report: WP2.7 Grid Codes and Regulation Related to EVs, Report,
2009.
[ger10] Federal Republic of Germany: National Renewable Energy Action Plan in accordance with
Directive 2009/28/EC on the promotion of the use of energy from renewable sources, Report,
2010.
[gre12] Webpage: http://www.greenrhinoenergy.com/solar/technologies/cst_systems.php,
Accessed 27 May 2012.
[gse12] GSE Group: Osservatorio Statistico, http://www.gse.it/it/Dati %20e %20Bilanci/
Osservatorio %20statistico/Pages/default.aspx, Accessed 18 July 2012.
[gwe10] Global Wind Energy Council: Global Wind Energy Outlook 2010, Report, October 2010.
[haw06] D. Hawkins, et al.: Evolving Role of Wind Forecasting in Market Operation at the CAISO,
Power Systems Conference and Exposition, pp. 234-238, Atlanta/U.S.A, 29 October-1
November 2006.
[hey12] Homer Energy: http://www.homerenergy.com, Accessed 23 July 2012.
[hol09] H. Hollttinen, et al. Design and operation of power systems with large amounts of wind
power, Final report, IEA Wind Task 25, 2009.
[hsh12] Hong Shen: Transmission of large scale wind power in China. IEC Workshop on Grid
Integration of Large-capacity Renewable Energy and Large-capacity Energy Storage,
University of Colorado at Boulder, March 2012.
[hts09] Benjamin Kroposki, et al. Harnessing the Sun: An Overview of Solar Technologies, IEEE
Power Energy Magazine, 7(3), p22-33, May/June 2009.
[iea09] S. Inage: Prospects for Large-Scale Energy Storage in Decarbonized Power Grids,
International Energy Agency Working Paper, 2009.
[iea11] Adam Brown, et al: Renewable Energy: Markets and Prospects by Technology, International
Energy Agency Information Paper, 2011.
[iig12] Chen-Ching Liu, et al.: Intruders in the Grid: Cyber-vulnerability and Mitigation Studies Using
a SCADA Test Bed. IEEE Power Energy Magazine, 10(1), p58-66, Jan/Feb 2012.
[jef11] Jeff St. John: Is Europe Ready for Automated Demand Response?, Greentechmedia, 7 Oct 2011.
[mei10] P. Meibom, et al.: Advanced Unit Commitment Strategies in the United States Eastern
Interconnection, 9th Annual International Workshop on Large-Scale Integration of Wind
Power into Power Systems as well as on Transmission Networks for Offshore Wind Power
Plants, Quebec/Canada, 18-19 October 2010.](https://image.slidesharecdn.com/gridintegration-140608024623-phpapp02/85/Grid-Integration-Of-Large-Scale-111-320.jpg)
![112 R e f e r e n c e s
[mev09] M. Caramanis, et al.: Management of Electric Vehicle Charging to Mitigate Renewable
Generation Intermittency and Distribution Network Congestion, Joint 48th IEEE Conference
on Decision and Control and 28th Chinese Control Conference, 2009.
[mfc11] Robert Zavadil, et al. Models for Change: Ensuring System Reliability in the Age of Large
Wind Power Plants, IEEE Power Energy Magazine, 9(6), p88-90, Nov/Dec 2011.
[mit11] Massachusetts Institute of Technology: The Future of The Electric Grid, Report, 2011.
[mlt10] G. Corso: Multi-objective long term optimal dispatch of Distributed Energy Resources in
micro-grids, UPEC 2010.
[mma11] Abraham Ellis, et al.: Model Makers: Simulating PV Systems in Transmission and Distribution
Planning, IEEE Power Energy Magazine, 9(3), p55-61, May/June 2011.
[msb10] International Electrotechnical Commission Market Strategy Board: Coping with the Energy
Challenge: The IEC’s role from 2010 to 2030, White Paper, September 2010.
[msb11] International Electrotechnical Commission Market Strategy Board: Electrical Energy Storage,
White Paper, December 2011.
[ner09] North American Electric Reliability Corporation, Integration of Variable Generation Task
Force: Accommodating High Levels of Variable Generation, Report, April 2009.
[ner10] North American Electric Reliability Corporation, Integration of Variable Generation Task
Force: Flexibility Requirements and Metrics for Variable Generation, Report, Aug 2010.
[npg10] Northwest Power Grid, State Grid Corporation of China: Power Demand Forecast, Power
and Electricity Balancing, and Load Following Capability Analysis of the Northwest Power
Grid in the 12th Five-year Plan Period, Report, 2010, in Chinese.
[obo12] 1BOG Blog, How Solar Feed-in Tariffs (FiTs) Work, http://solarfinancing.1bog.org/feed-in-
tariffs/, Accessed 13 Feb 2012.
[oma11] R. Banos, et al.: Optimization methods applied to renewable and sustainable energy: A
Review, Renewable and Sustainable Energy Reviews 15 (2011) p1753-1766.
[opp11] North American Electric Reliability Corporation, Integration of Variable Generation Task
Force: Operating Practices, Procedures, and Tools, Report, Mar 2011.
[ops08] P.D. Brown: Optimization of Pumped Storage Capacity in an Isolated Power System with
Large Renewable Penetration, IEEE Transactions on Power Systems 23 (2008), p523-531.
[pao11] John H Kehler, et al.: Planning and Operational Considerations for Power System Flexibility,
IEEE PES General Meeting Power System Flexibility Panel, 2011.
[pei12] Richard Piwko, et al.: Penetrating Insights: Lessons Learned from Large-Scale Wind Power
Integration, IEEE Power Energy Magazine, 10(2), p44-52, Mar/Apr 2012.
[per11] I. Perez-Arriaga: Managing Large Scale Penetration of Intermittent Renewables, MITEI
Symposium on Managing Large-Scale Penetration of Intermittent Renewables, Cambridge/
U.S.A, 20 April 2011.
[pts11] Wenuan Li: Probabilistic Transmission System Planning, Book, IEEE-Press, 2011.](https://image.slidesharecdn.com/gridintegration-140608024623-phpapp02/85/Grid-Integration-Of-Large-Scale-112-320.jpg)
![113
[rep11] Renewable Energy Policy Network for the 21st Century: Renewables 2011 Global Status
Report, Report, July 2011.
[rvp08] C.C. Wu, et al.: Role and Value of Pumped Storage Units in an Ancillary Services Market
for Isolated Power Systems – Simulation in the Taiwan Power System, IEEE Transactions of
Industry Applications, 44(6), Nov/Dec 2008.
[sad11] Lawrence E. Jones: Strategies and Decision Support System for Integrating Variable
Resources in Control Centers for Reliable Grid Operations: Global Best Practices, Examples
of Excellence and Lessons Learned, Report, Alstom Grid Inc., 2011.
[sco12] J. Hill, et al.: System constraints on optimal dispatch schedule for battery storage systems,
IEEE PES Innovative Smart Grid Technologies 2012.
[sgc07] Webpage: http://www.sgcc.com.cn/dlkp/dlhb/kpzs/sbdssjbzs/61089.shtml, Accessed 11
March 2012.
[sgc11] State Grid Corporation of China: Promoting Wind Power Development in China, White Paper,
Apr 2011.
[sgc12] State Grid Corporation of China: http://www.sgcc.com.cn/ywlm/mediacenter/
corporatenews/04/245999.shtml, Article 2011, Accessed 29 March 2012.
[sge11] State Grid Energy Research Institute, Vestas Wind Energy Technology (China): Integrated
Solution Strategies for Coordinated Wind Power and Grid Development-International
Experiences and China Practices, Report, Oct 2011.
[sic12] Julie Hull, et al.: Staying in control: Cybersecurity and the Modern Electric Grid, IEEE Power
Energy Magazine, 10(1), p41-48, Jan/Feb 2012.
[sin06] Webpage: http://finance.sina.com.cn/roll/20061201/09091074144.shtml, Accessed 15 April
2012.
[sin12] Ivan M. Dudurych, et al.: Safety in Numbers: Online Security Analysis of Power Grids with
High Wind Penetration, IEEE Power Energy Magazine, 10(2), p62-70, Mar/Apr 2012.
[smp11] J. Smith, B. Parsons: Wind Integration: Much Has Changed in Two Years, IEEE Power Energy
Magazine, 9(6), p18-25, Nov/Dec 2011.
[sra12] North American Electric Reliability Corporation, Integration of Variable Generation Task
Force: Special Reliability Assessment: Interconnection Requirements for Variable Generation,
Report, Mar 2012.
[tea07] Mukhopadhyay S.: Towards electricity for all: transmission planning for the growth of India's
power system, IEEE Power Energy Magazine, 5(3), p71-78, May/June 2007.
[tec10] C. Quinn, D. Zimmerle, T.H. Bradley: The effect of communication architecture on the
availability, reliability, and economics of plug-in hybrid electric vehicle-to-grid ancillary
services, Journal of Power Sciences 195 (2010), p1500-1509.
[tem12] Taiwan Electrical and Mechanical Engineering Services (TEMES): www.temes.com.tw/
Item03_EN.htm, Accessed 23 July 2012.](https://image.slidesharecdn.com/gridintegration-140608024623-phpapp02/85/Grid-Integration-Of-Large-Scale-113-320.jpg)
![114 R e f e r e n c e s
[tgs12] Mark Reynolds, et al.: The Golden Spike: Advanced Power Electronics Enables Renewable
Development Across NERC Regions, IEEE Power Energy Magazine, 10(2), p71-78, Mar/
Apr 2012.
[tgy06] Webpage: http://www.sgcc.com.cn/ztzl/tgyzl/tgyzs/default.shtml, Accessed 15 April 2012.
[tie12] Webpage: http://www.3tier.com/en/, Accessed 29 March 2012.
[top12] Daniel E. Nordell: Terms of Protection: The Many Faces of Smart Grid Security, IEEE Power
Energy Magazine, 10(1), p18-23, Jan/Feb 2012.
[tpd11] State Grid Corporation of China: Typical Design of Wind Farm Electrical Systems. China
Electric Power Press, 2011, Book in Chinese.
[tre10] P. Denholm, E. Ela, B. Kirby, M. Milligan: The Role of Energy Storage with Renewable
Electricity Generation, U.S. National Renewable Energy Laboratory Technical Report NREL/
TP-6A2-47187, Report, 2010.
[trp11] Eamonn Lannoye, et al.: The Role of Power System Flexibility in Generation Planning, IEEE
PES General Meeting Power System Flexibility Panel, 2011.
[uei10] The Union of the Electricity Industry: Integrating Intermittent Renewable Sources in the EU
Electricity System by 2020: Challenges and Solutions, Report, 2010.
[vce03] G. Bathurst, G. Strbac: Value of Combining Energy Storage and Wind in Short-term Energy
and Balancing Markets, Electric Power Systems Research 67 (2003), p1-8.
[vsc10] Guangfu Tang: VSC-HVDC Based High Voltage DC Transmission Technology, Book, China
Electric Power Press, 2010, in Chinese.
[wei11] Liping Jiang, et al. Wind Energy in China: Status and Prospects, IEEE Power Energy
Magazine, 9(6), p36-46, Nov/Dec 2011.
[weo11] International Energy Agency: World Energy Outlook 2011 © OECD/IEA 2011.
[won11] F. Wong, C. Yixin: http://af.reuters.com/article/energyOilNews/idAFL3E7G5546 20110506,
Article 2011, Accessed 29 March 2012.
[wpa12] Webpage Wind Powering America: http://www.windpoweringamerica.gov/wind_ installed_
capacity.asp, Accessed 29 March 2012.
[yam11] M. Yamamoto, O. Ikki: Nation Survey Report of PV Power Applications in Japan, Report,
International Energy Agency, 17 June 2011.](https://image.slidesharecdn.com/gridintegration-140608024623-phpapp02/85/Grid-Integration-Of-Large-Scale-114-320.jpg)