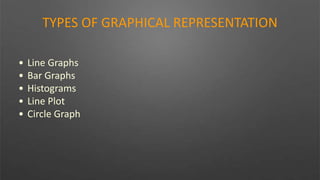
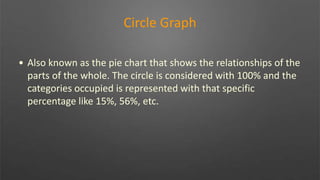
Graphical representation is a way to analyze numerical data by exhibiting the relationship between data, ideas, and concepts through diagrams. It has the objectives of making data easy to understand and allowing one to grasp difficult data visually. The main types of graphical representation are line graphs, bar graphs, histograms, line plots, and circle graphs, each of which displays different types of data in a way that facilitates comparison and understanding.