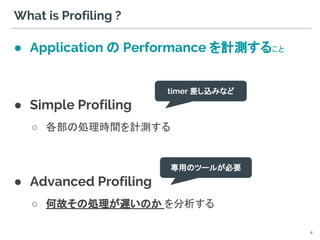
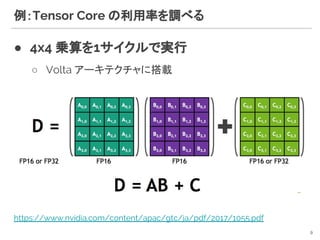
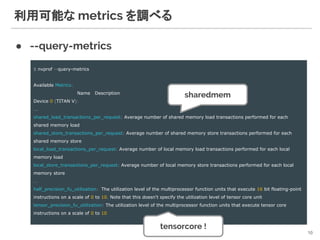
NVIDIA provides several tools for profiling GPU performance of computer vision applications, including nvprof, nvvp, and the next-generation Nsight Compute and Nsight Systems. Nvprof allows command-line profiling with different modes, while nvvp provides a GUI interface for visualizing profiling results. These tools help analyze kernel performance, identify bottlenecks like compute or memory limitations, and optimize applications. Tensorflow also includes a timeline tool for profiling graph execution.


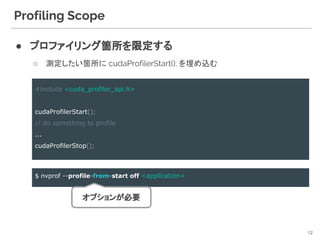
![● Command-line profiler
○ /usr/local/cuda/bin/nvprof
● Usage
nvprof
6
$ nvprof [npprof-options] <app> [arguments]
==17126== Profiling result:
Type Time(%) Time Calls Avg Min Max Name
GPU activities: 28.09% 9.6689ms 32 302.15us 231.69us 544.94us maxwell_scudnn_winograd_128x128_ldg1_ldg4_tile148n_nt
8.13% 2.7997ms 34 82.344us 42.145us 121.09us maxwell_scudnn_128x128_relu_interior_nn
7.46% 2.5673ms 72 35.657us 4.6720us 569.87us normalize_kernel(int, float*, float*, float*, int, int, int)
7.01% 2.4122ms 104 23.194us 1.7600us 243.82us copy_kernel(int, float*, int, int, float*, int, int)
6.96% 2.3956ms 116 20.651us 1.1840us 242.98us activate_array_kernel(float*, int, ACTIVATION)
6.46% 2.2237ms 75 29.649us 3.0400us 301.03us add_bias_kernel(float*, float*, int, int, int)
6.24% 2.1489ms 72 29.846us 3.3600us 299.91us scale_bias_kernel(float*, float*, int, int)
5.98% 2.0587ms 184 11.188us 1.4080us 112.64us fill_kernel(int, float, float*, int)
5.87% 2.0187ms 3 672.90us 28.960us 1.8676ms [CUDA memcpy DtoH]
5.16% 1.7760ms 4 444.00us 414.16us 516.91us maxwell_scudnn_128x128_relu_small_nn
5.10% 1.7553ms 32 54.854us 7.2320us 163.24us void cudnn::winograd::generateWinogradTilesKernel<int=0, float,
float>(cudnn::winograd::GenerateWinogradTilesParams<float, float>)](https://image.slidesharecdn.com/profilertoolscollectionslideshare1-181214113246/85/GPU-profiling-for-computer-vision-applications-6-320.jpg)
![4つのprofiling mode
● summary mode (default)
● trace mode
● event/metric summary mode
● event/metric trace mode
7
$ nvprof --print-gpu-trace --print-api-trace
$ nvprof --events <event-name> --metrics <metric-name>
$ nvprof --aggregate-mode off [event|metric]
$ nvprof <application>
GPUで発生する全てのアクティビティ
CUDA Runtime API + Driver API 呼出](https://image.slidesharecdn.com/profilertoolscollectionslideshare1-181214113246/85/GPU-profiling-for-computer-vision-applications-7-320.jpg)
![● summary mode (default)
nvprof
==17126== Profiling result:
Type Time(%) Time Calls Avg Min Max Name
GPU activities: 28.09% 9.6689ms 32 302.15us 231.69us 544.94us maxwell_scudnn_winograd_128x128_ldg1_ldg4_tile148n_nt
8.13% 2.7997ms 34 82.344us 42.145us 121.09us maxwell_scudnn_128x128_relu_interior_nn
7.46% 2.5673ms 72 35.657us 4.6720us 569.87us normalize_kernel(int, float*, float*, float*, int, int, int)
7.01% 2.4122ms 104 23.194us 1.7600us 243.82us copy_kernel(int, float*, int, int, float*, int, int)
6.96% 2.3956ms 116 20.651us 1.1840us 242.98us activate_array_kernel(float*, int, ACTIVATION)
6.46% 2.2237ms 75 29.649us 3.0400us 301.03us add_bias_kernel(float*, float*, int, int, int)
6.24% 2.1489ms 72 29.846us 3.3600us 299.91us scale_bias_kernel(float*, float*, int, int)
5.98% 2.0587ms 184 11.188us 1.4080us 112.64us fill_kernel(int, float, float*, int)
5.87% 2.0187ms 3 672.90us 28.960us 1.8676ms [CUDA memcpy DtoH]
5.16% 1.7760ms 4 444.00us 414.16us 516.91us maxwell_scudnn_128x128_relu_small_nn
5.10% 1.7553ms 32 54.854us 7.2320us 163.24us void cudnn::winograd::generateWinogradTilesKernel<int=0, float,
float>(cudnn::winograd::GenerateWinogradTilesParams<float, float>)
4.00% 1.3780ms 23 59.912us 18.272us 250.79us shortcut_kernel(int, int, int, int, int, int, int, int, int, int, float*, int, int, int,
float, float, float*)
1.36% 467.82us 1 467.82us 467.82us 467.82us maxwell_scudnn_128x64_relu_small_nn
0.86% 296.90us 1 296.90us 296.90us 296.90us maxwell_scudnn_128x32_relu_small_nn
0.48% 165.99us 2 82.994us 82.882us 83.106us maxwell_scudnn_128x64_relu_interior_nn
0.39% 134.98us 1 134.98us 134.98us 134.98us maxwell_scudnn_128x32_relu_interior_nn
0.26% 89.508us 43 2.0810us 1.7280us 9.3440us
cudnn::maxwell::gemm::computeOffsetsKernel(cudnn::maxwell::gemm::ComputeOffsetsParams)
0.17% 58.018us 2 29.009us 19.809us 38.209us upsample_kernel(unsigned long, float*, int, int, int, int, int, int, float, float*)
API calls: 90.08% 285.51ms 798 357.78us 3.4690us 282.40ms cudaLaunch
9.68% 30.674ms 3 10.225ms 1.6737ms 24.491ms cudaMemcpy
0.11% 363.03us 3540 102ns 86ns 1.5170us cudaSetupArgument
8](https://image.slidesharecdn.com/profilertoolscollectionslideshare1-181214113246/85/GPU-profiling-for-computer-vision-applications-8-320.jpg)

![Python 越しに CUDA API を呼ぶ場合は?
● 普通に nvprof にかける
● ctypes を使うことも
13
$ nvprof [npprof-options] python ...
Python Script
import ctypes
_cudart = ctypes.CDLL('libcudart.so')
ret = _cudart.cudaProfilerStart()
# call cuda-based methods
ret = _cudart.cudaProfilerStop()
https://docs.python.jp/3/library/ctypes.html
xxxlib.cpython-35m-x86_64-linux-gnu.so
libcuda…...so
CUDA を使った Python 拡張ライブラリ](https://image.slidesharecdn.com/profilertoolscollectionslideshare1-181214113246/85/GPU-profiling-for-computer-vision-applications-13-320.jpg)


![Catapult
● Chrome Performance tools*
○ https://github.com/catapult-project/catapult
○ Chrome / Go / Android で利用
○ Trace Event Format 詳細
■ https://docs.google.com/document/d/1CvAClvFfyA5R-PhYUmn5OOQtYMH4h6
I0nSsKchNAySU/preview
● Projects
○ Trace-viewer Javascript codebase that loads trace files and creates the UI
○ Telemetry
○ Performance Dashboard
○ Systrace
○ Web Page Replay
37
[*] https://docs.google.com/document/d/1QADiFe0ss7Ydq-LUNOPpIf6z4KXGuWs_ygxiJxoMZKo/edit](https://image.slidesharecdn.com/profilertoolscollectionslideshare1-181214113246/85/GPU-profiling-for-computer-vision-applications-37-320.jpg)


![[DL Hacks]Simple Online Realtime Tracking with a Deep Association Metric](https://cdn.slidesharecdn.com/ss_thumbnails/2019-04-01dlhacksdeepsortsugisaki-190412022858-thumbnail.jpg?width=640&height=640&fit=bounds)
![SSII2022 [OS3-02] Federated Learningの基礎と応用](https://cdn.slidesharecdn.com/ss_thumbnails/ssii2022-os3-02-220607020834-2b5f93ff-thumbnail.jpg?width=640&height=640&fit=bounds)
![[DL輪読会]A Higher-Dimensional Representation for Topologically Varying Neural R...](https://cdn.slidesharecdn.com/ss_thumbnails/ahigher-dimensionalrepresentationfortopologicallyvaryingneuralradiancefields1-210924021911-thumbnail.jpg?width=640&height=640&fit=bounds)