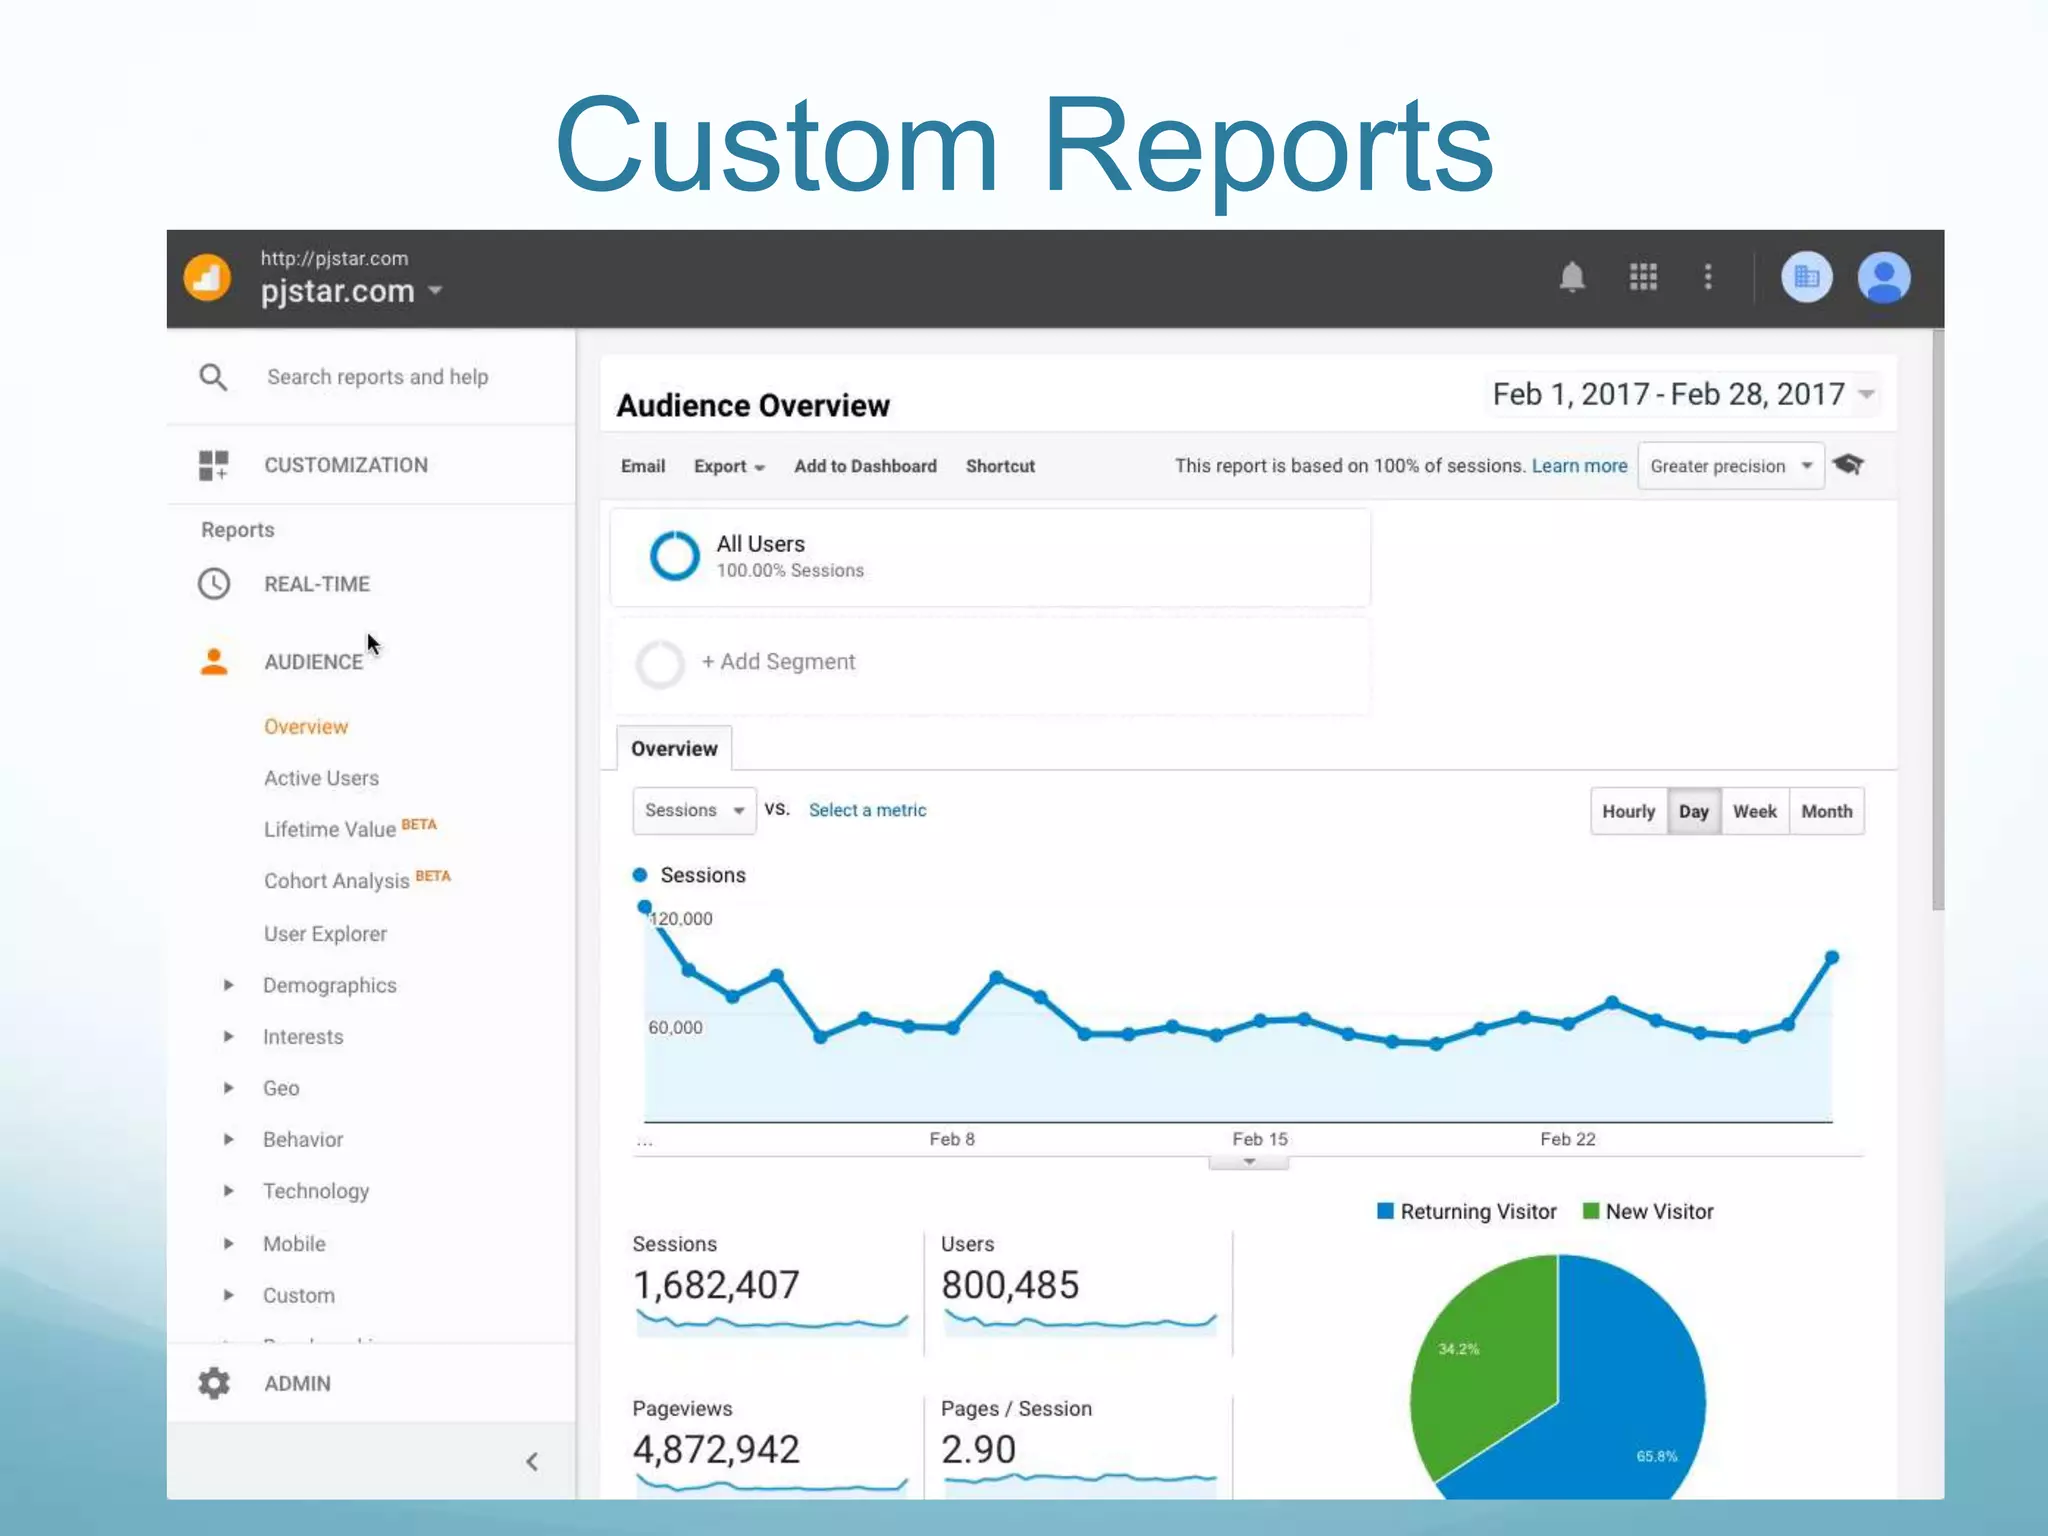
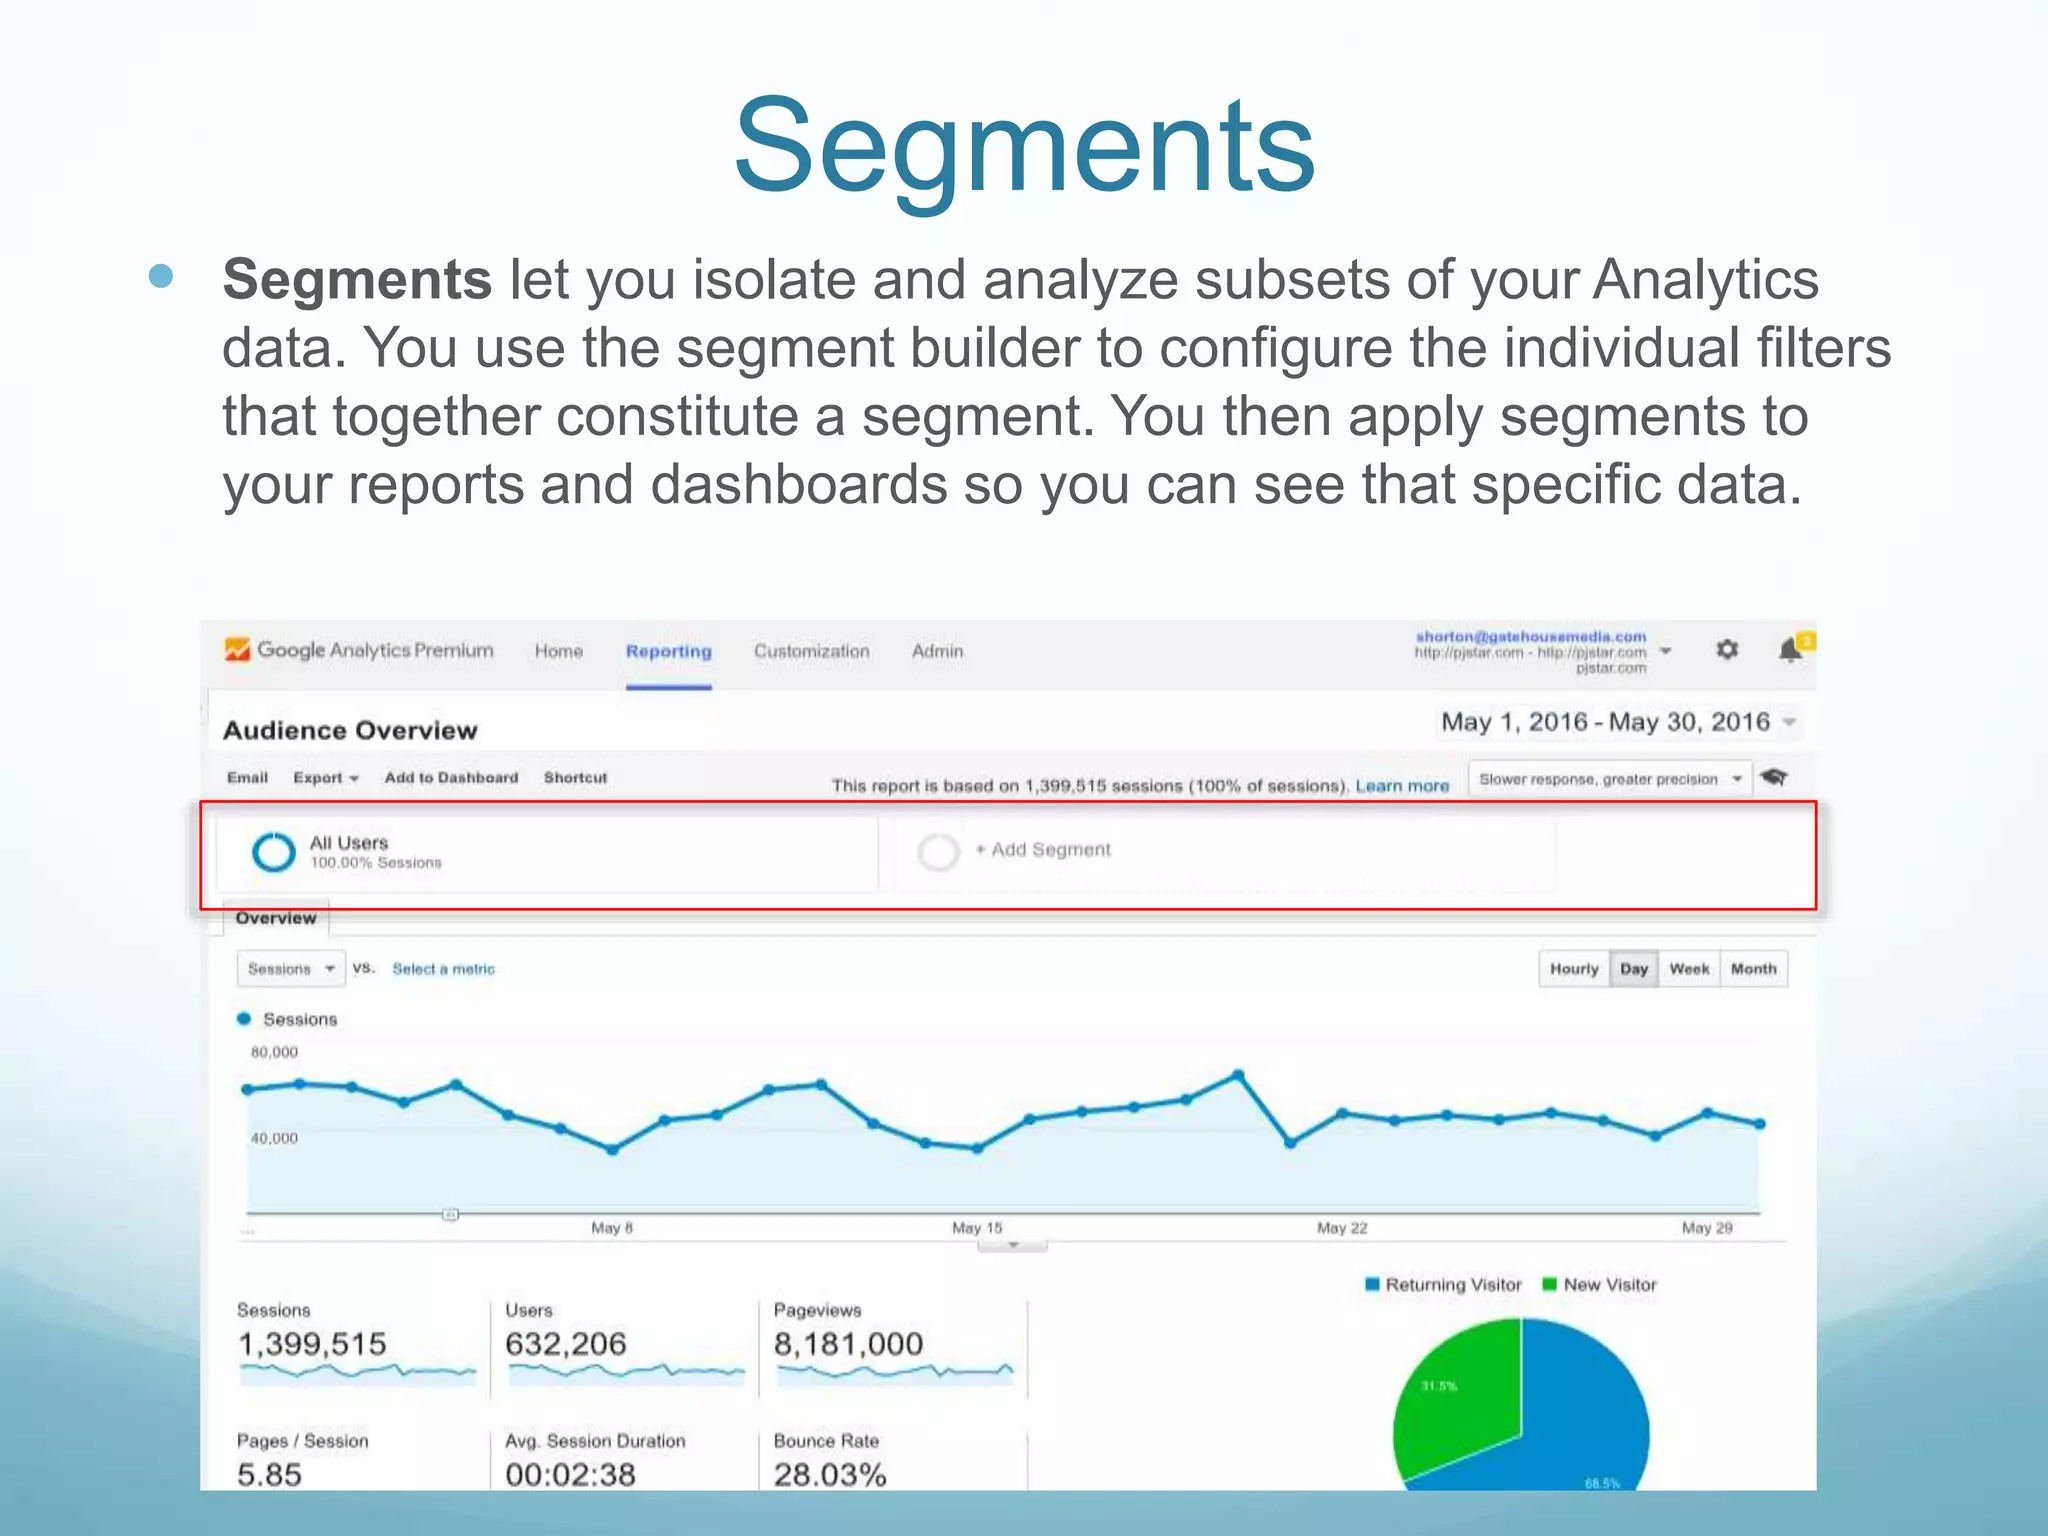
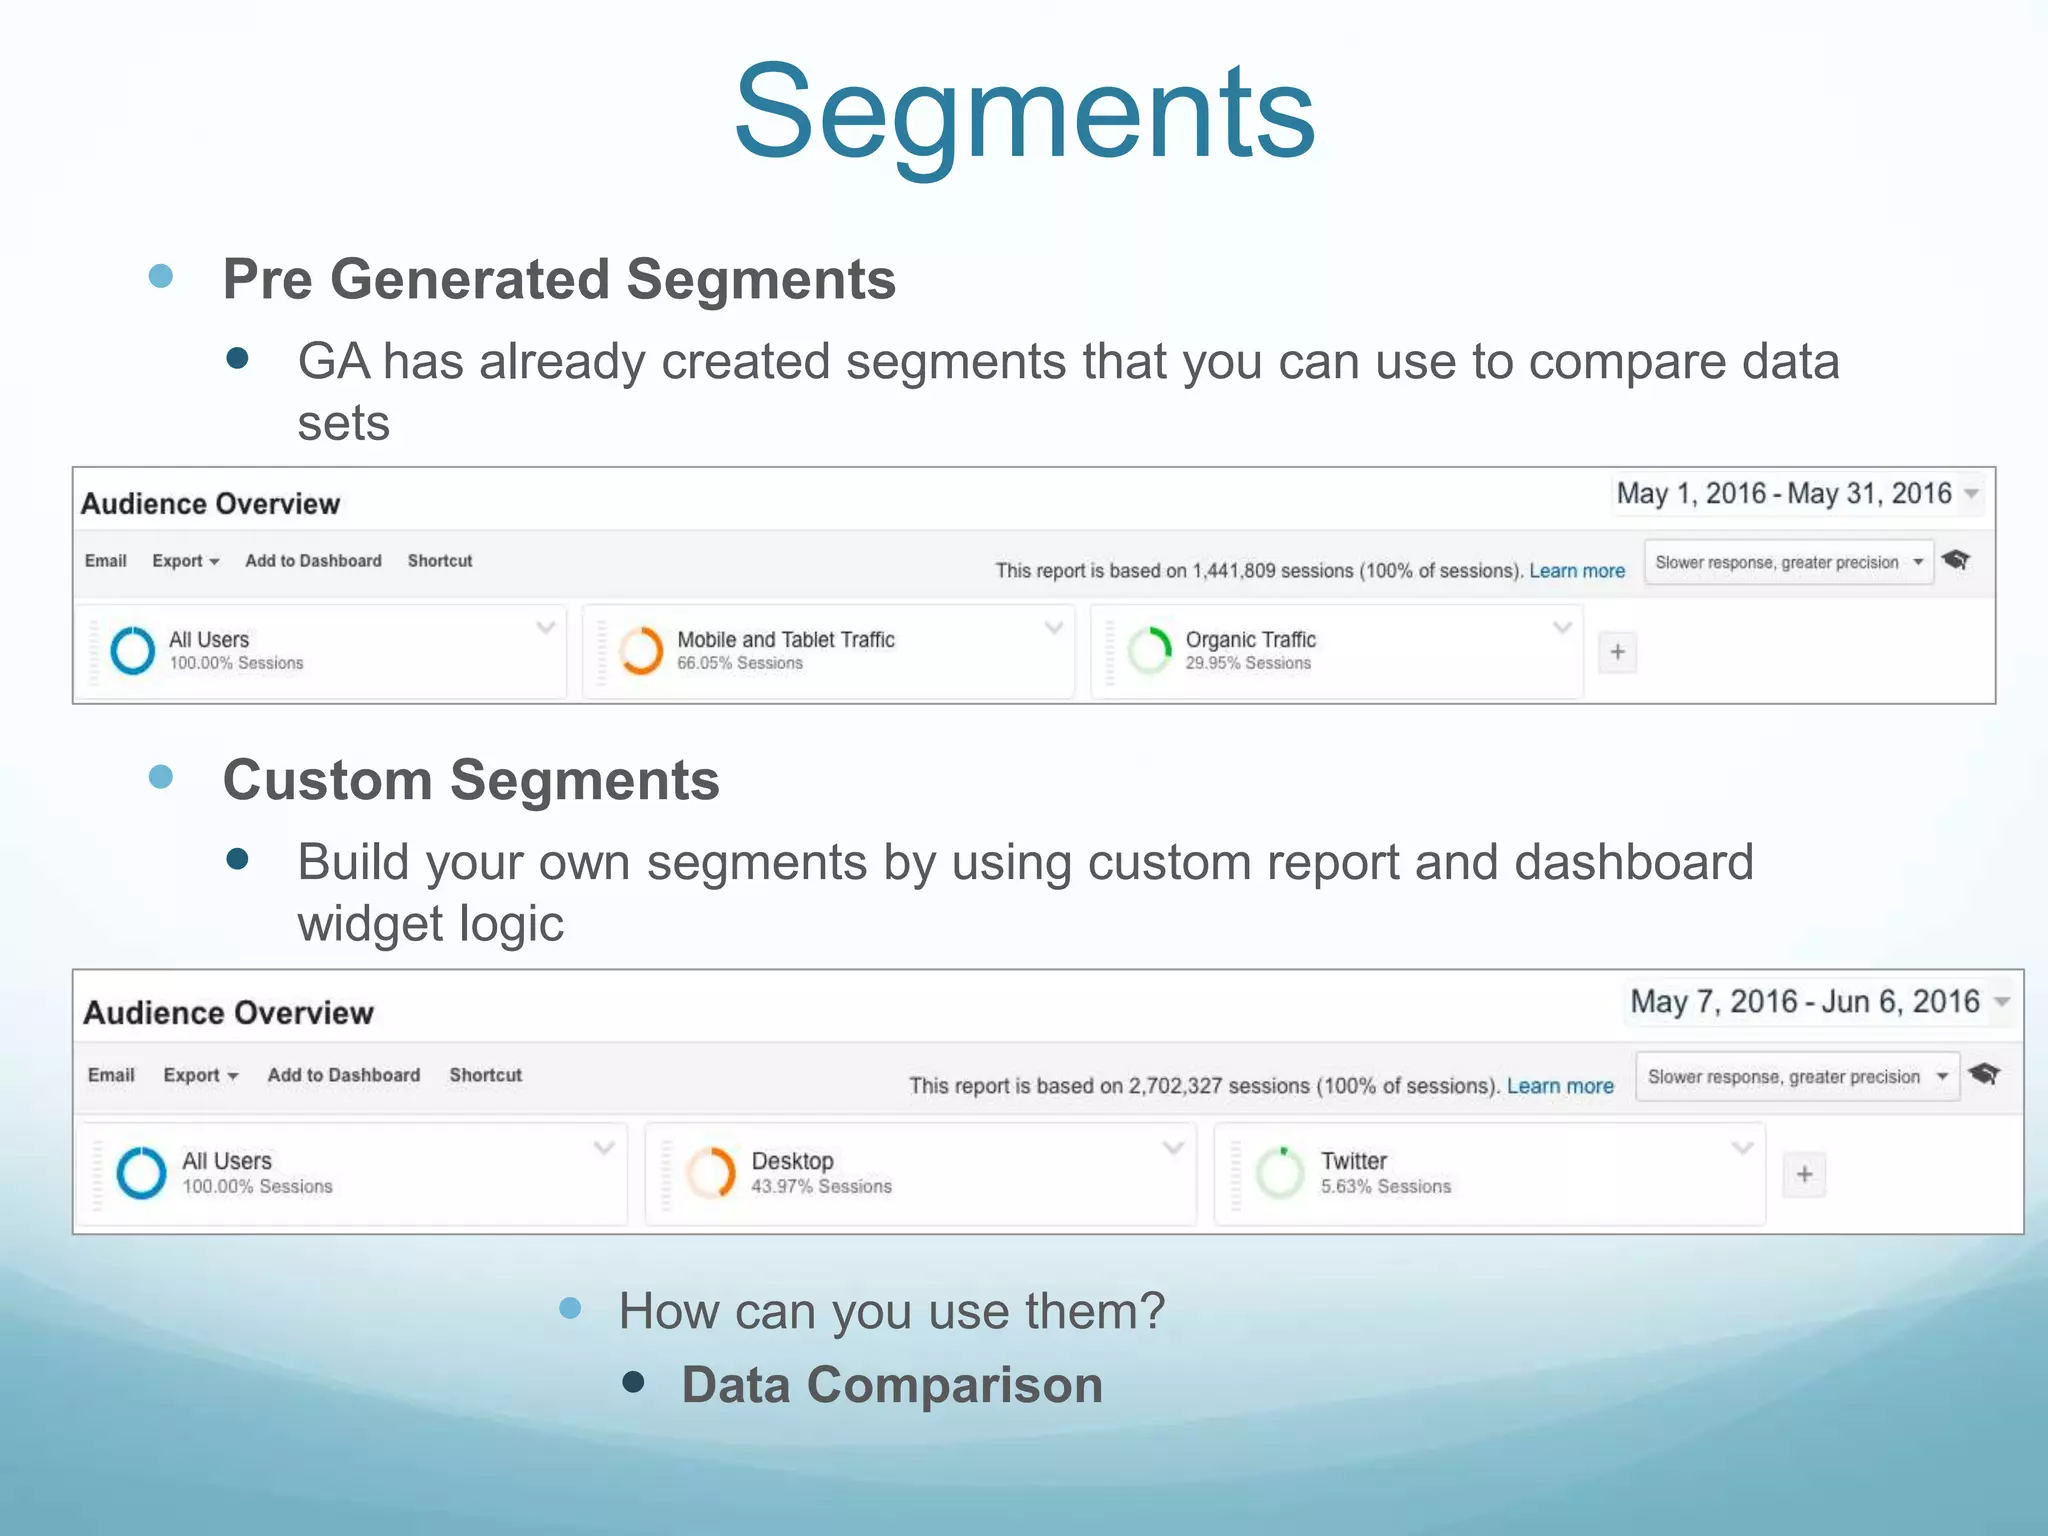
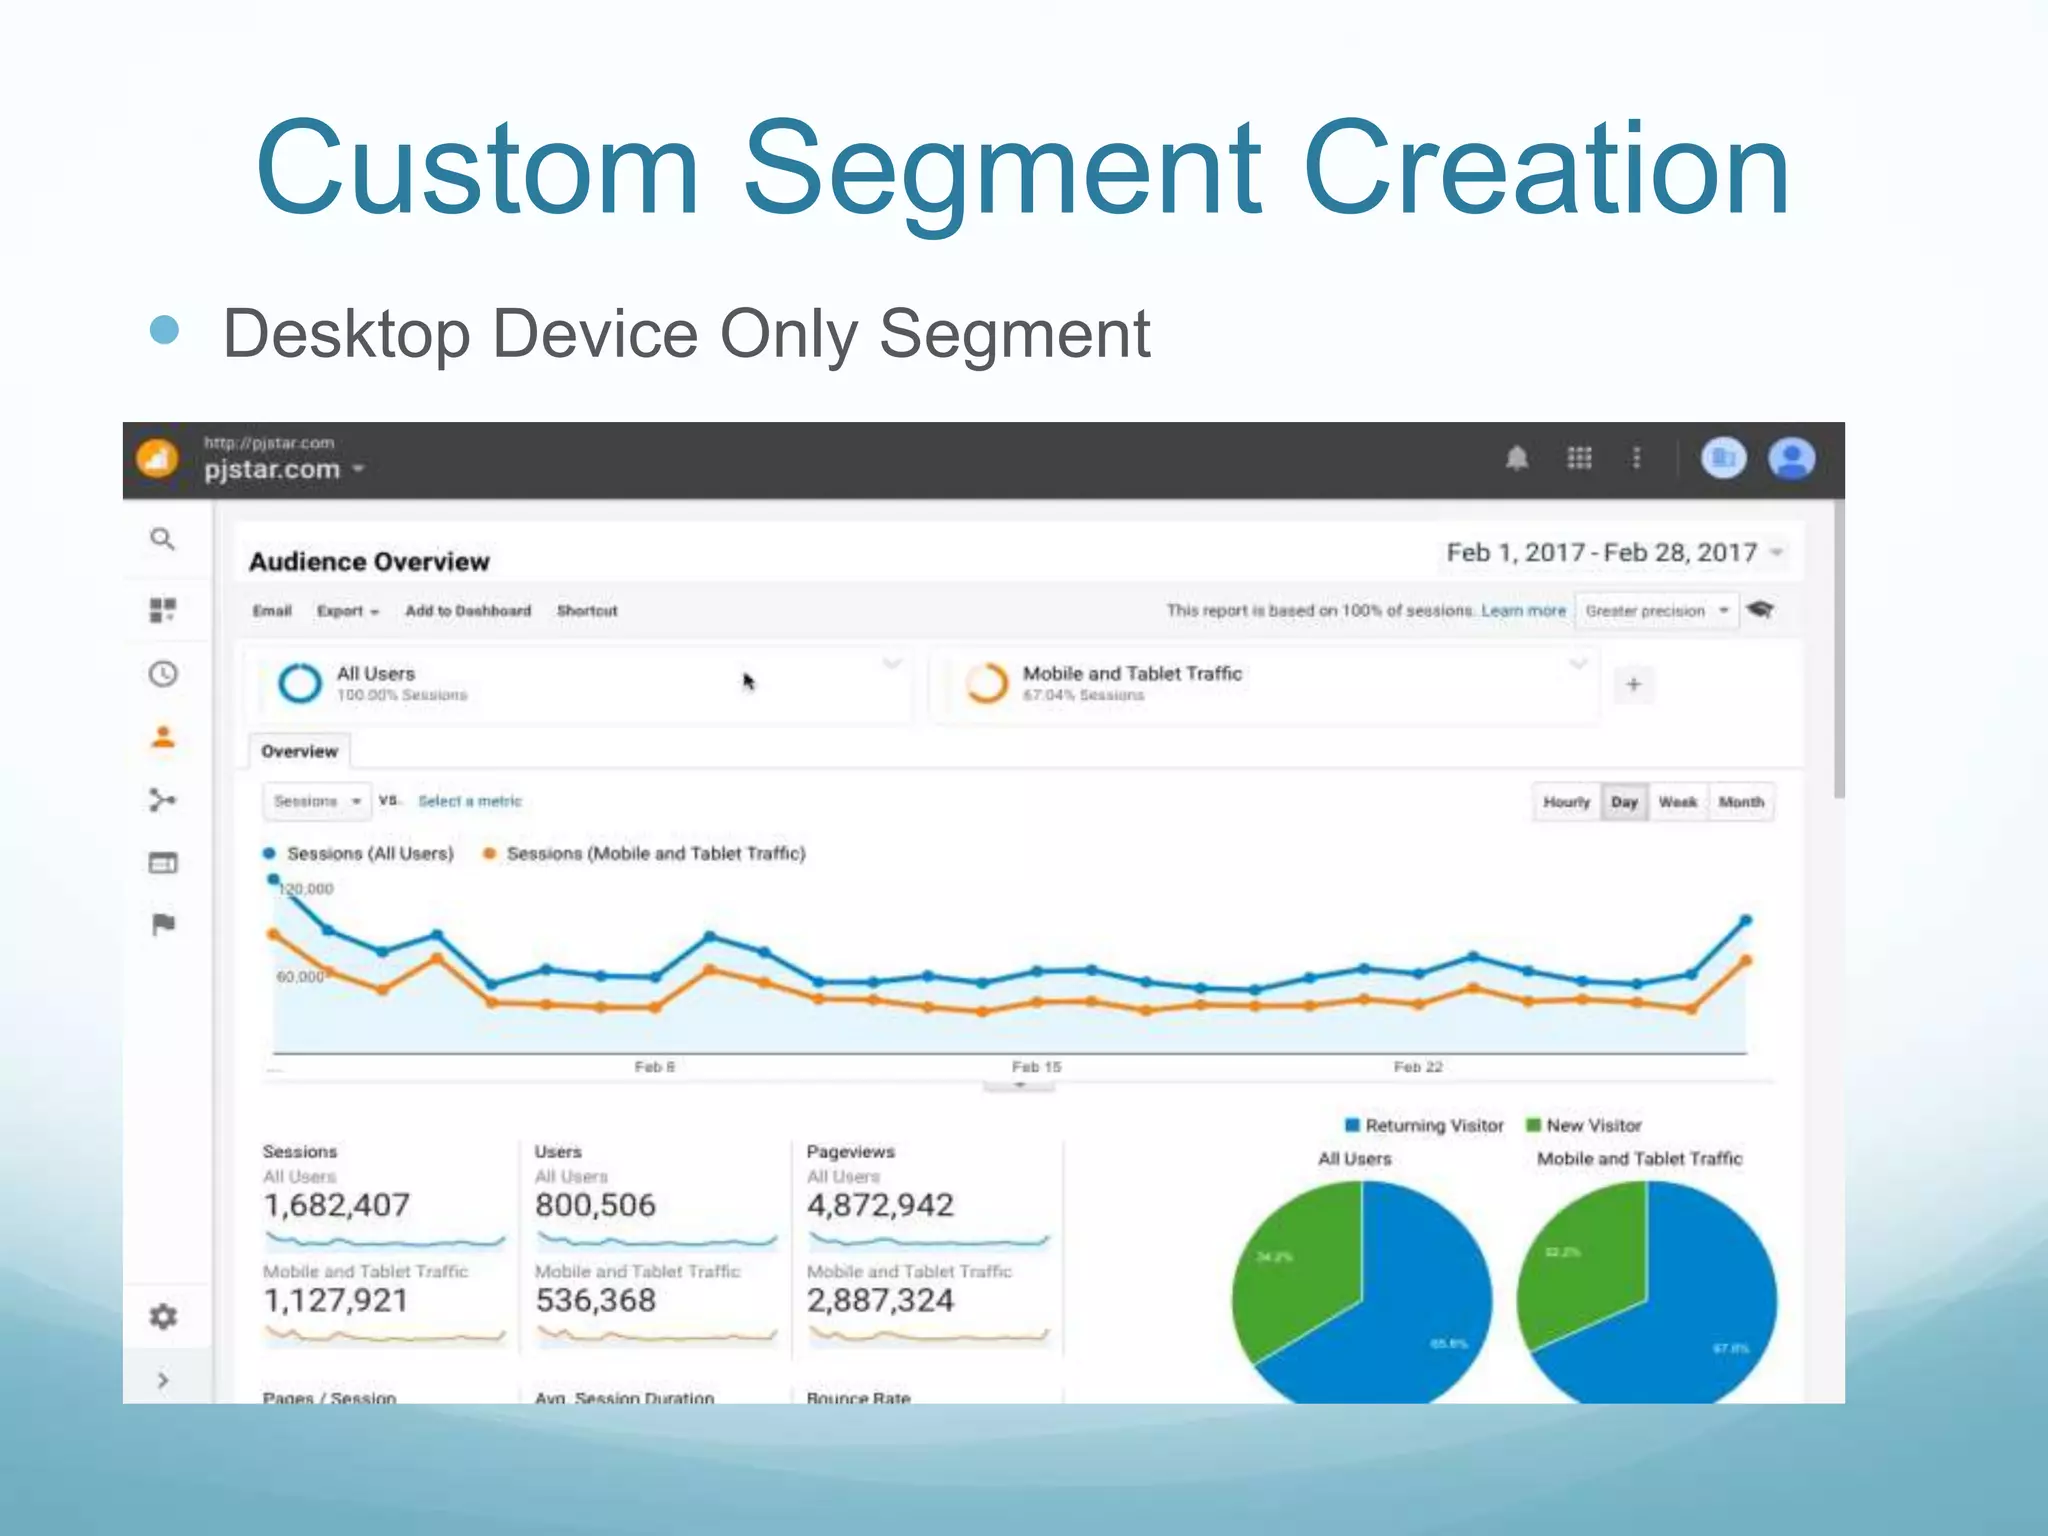
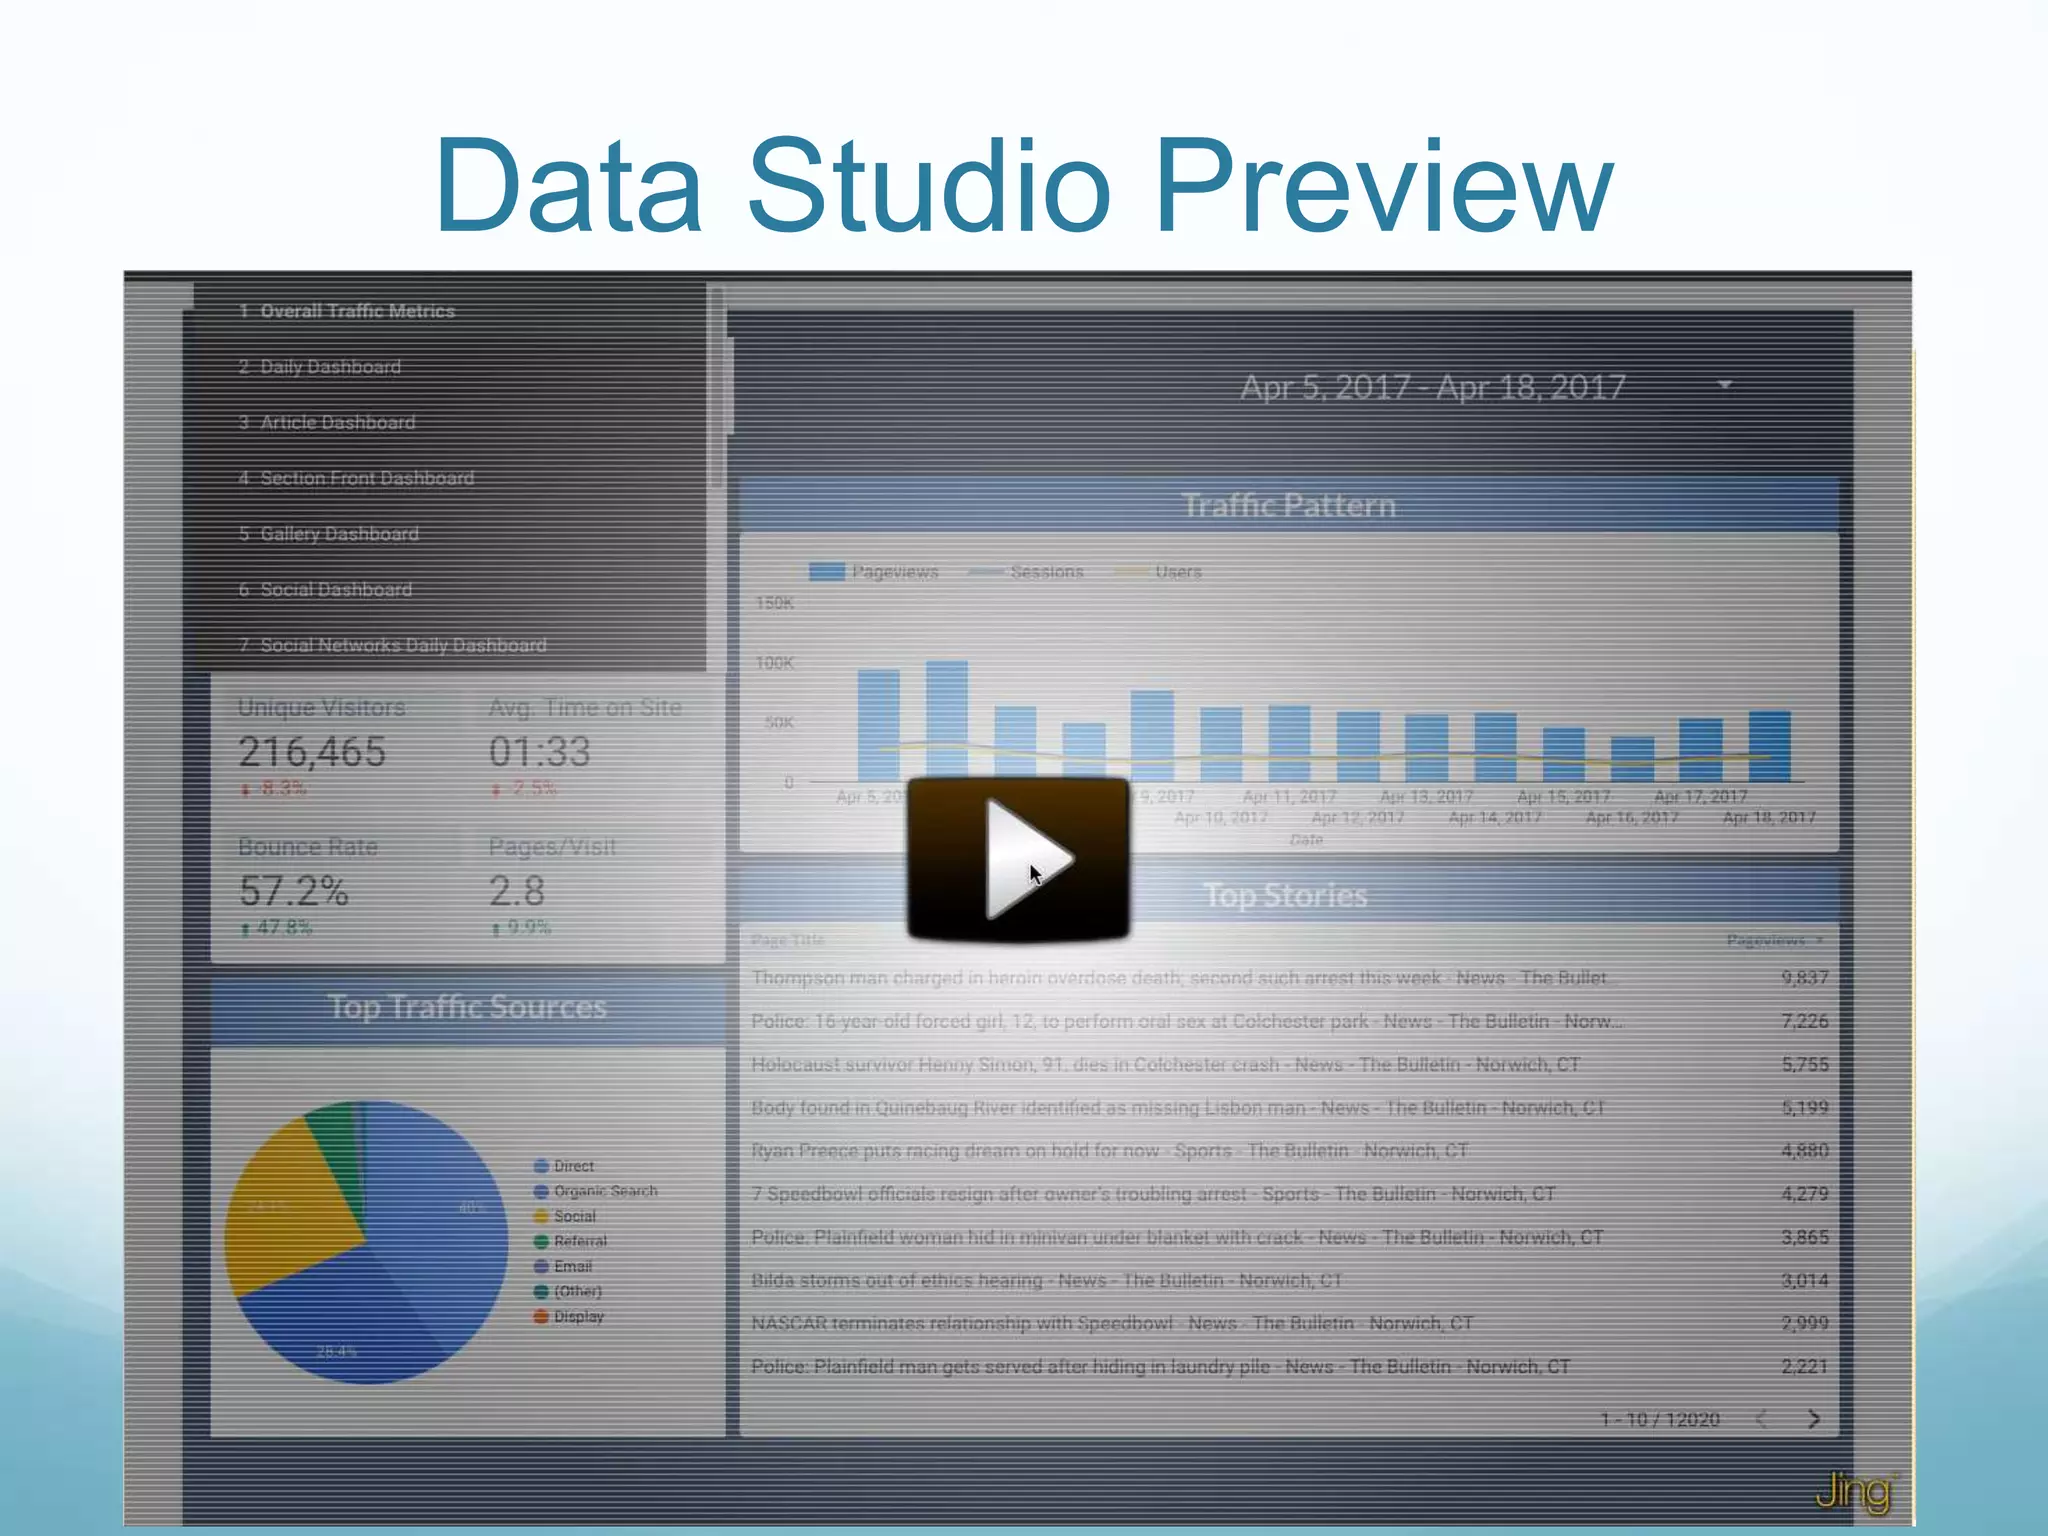
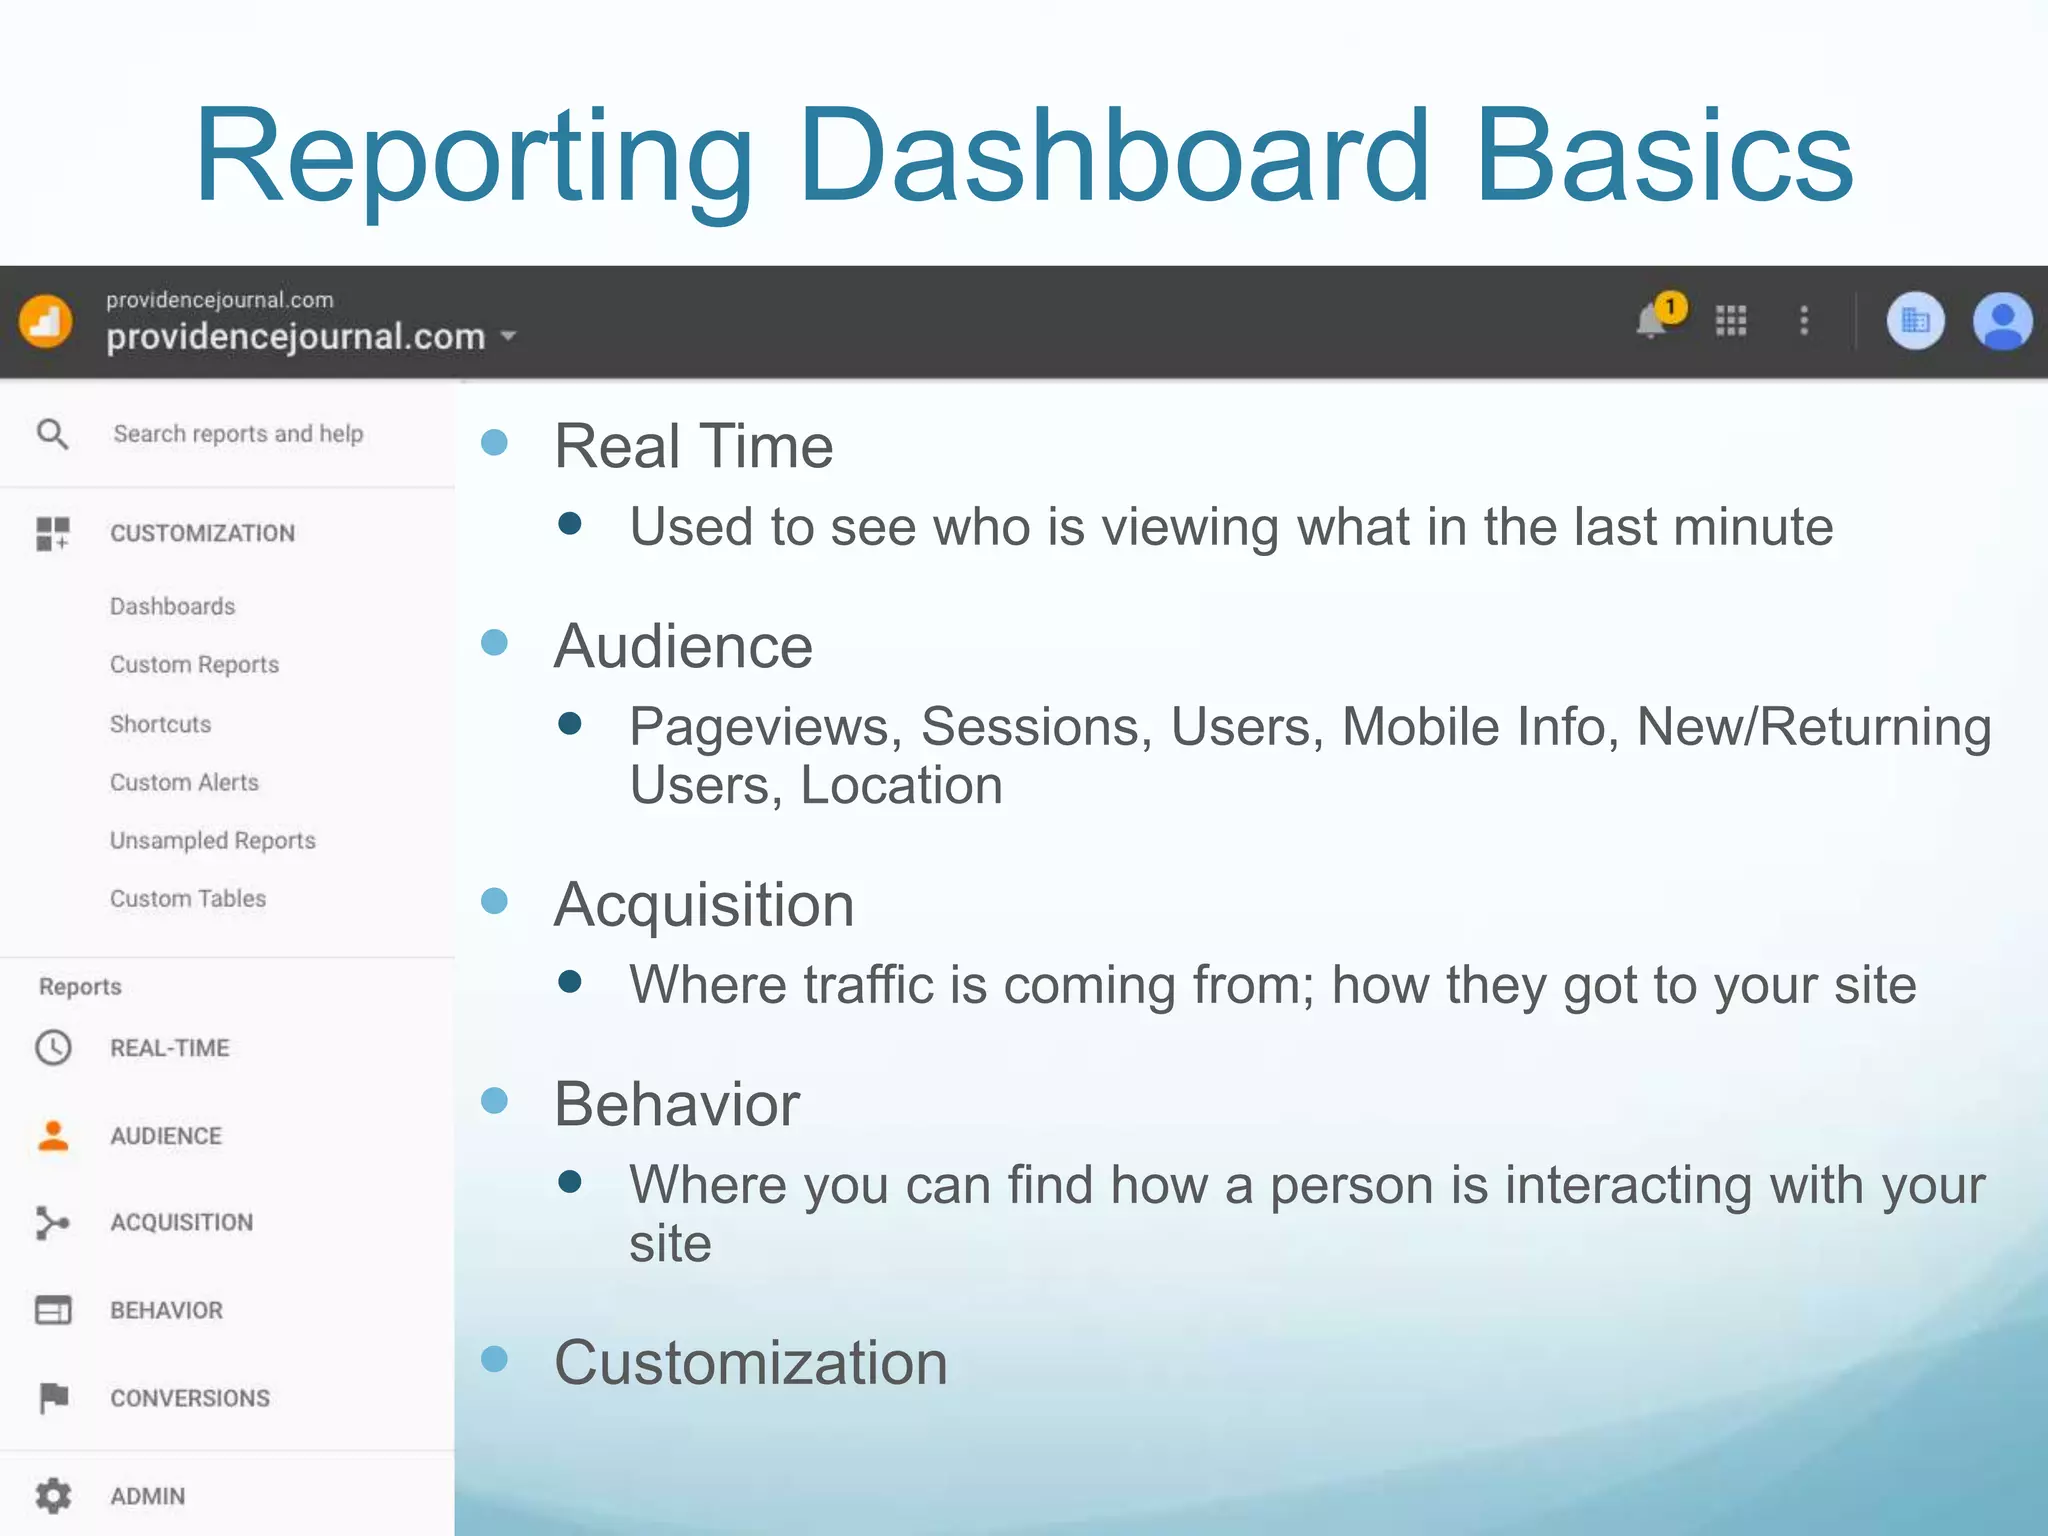
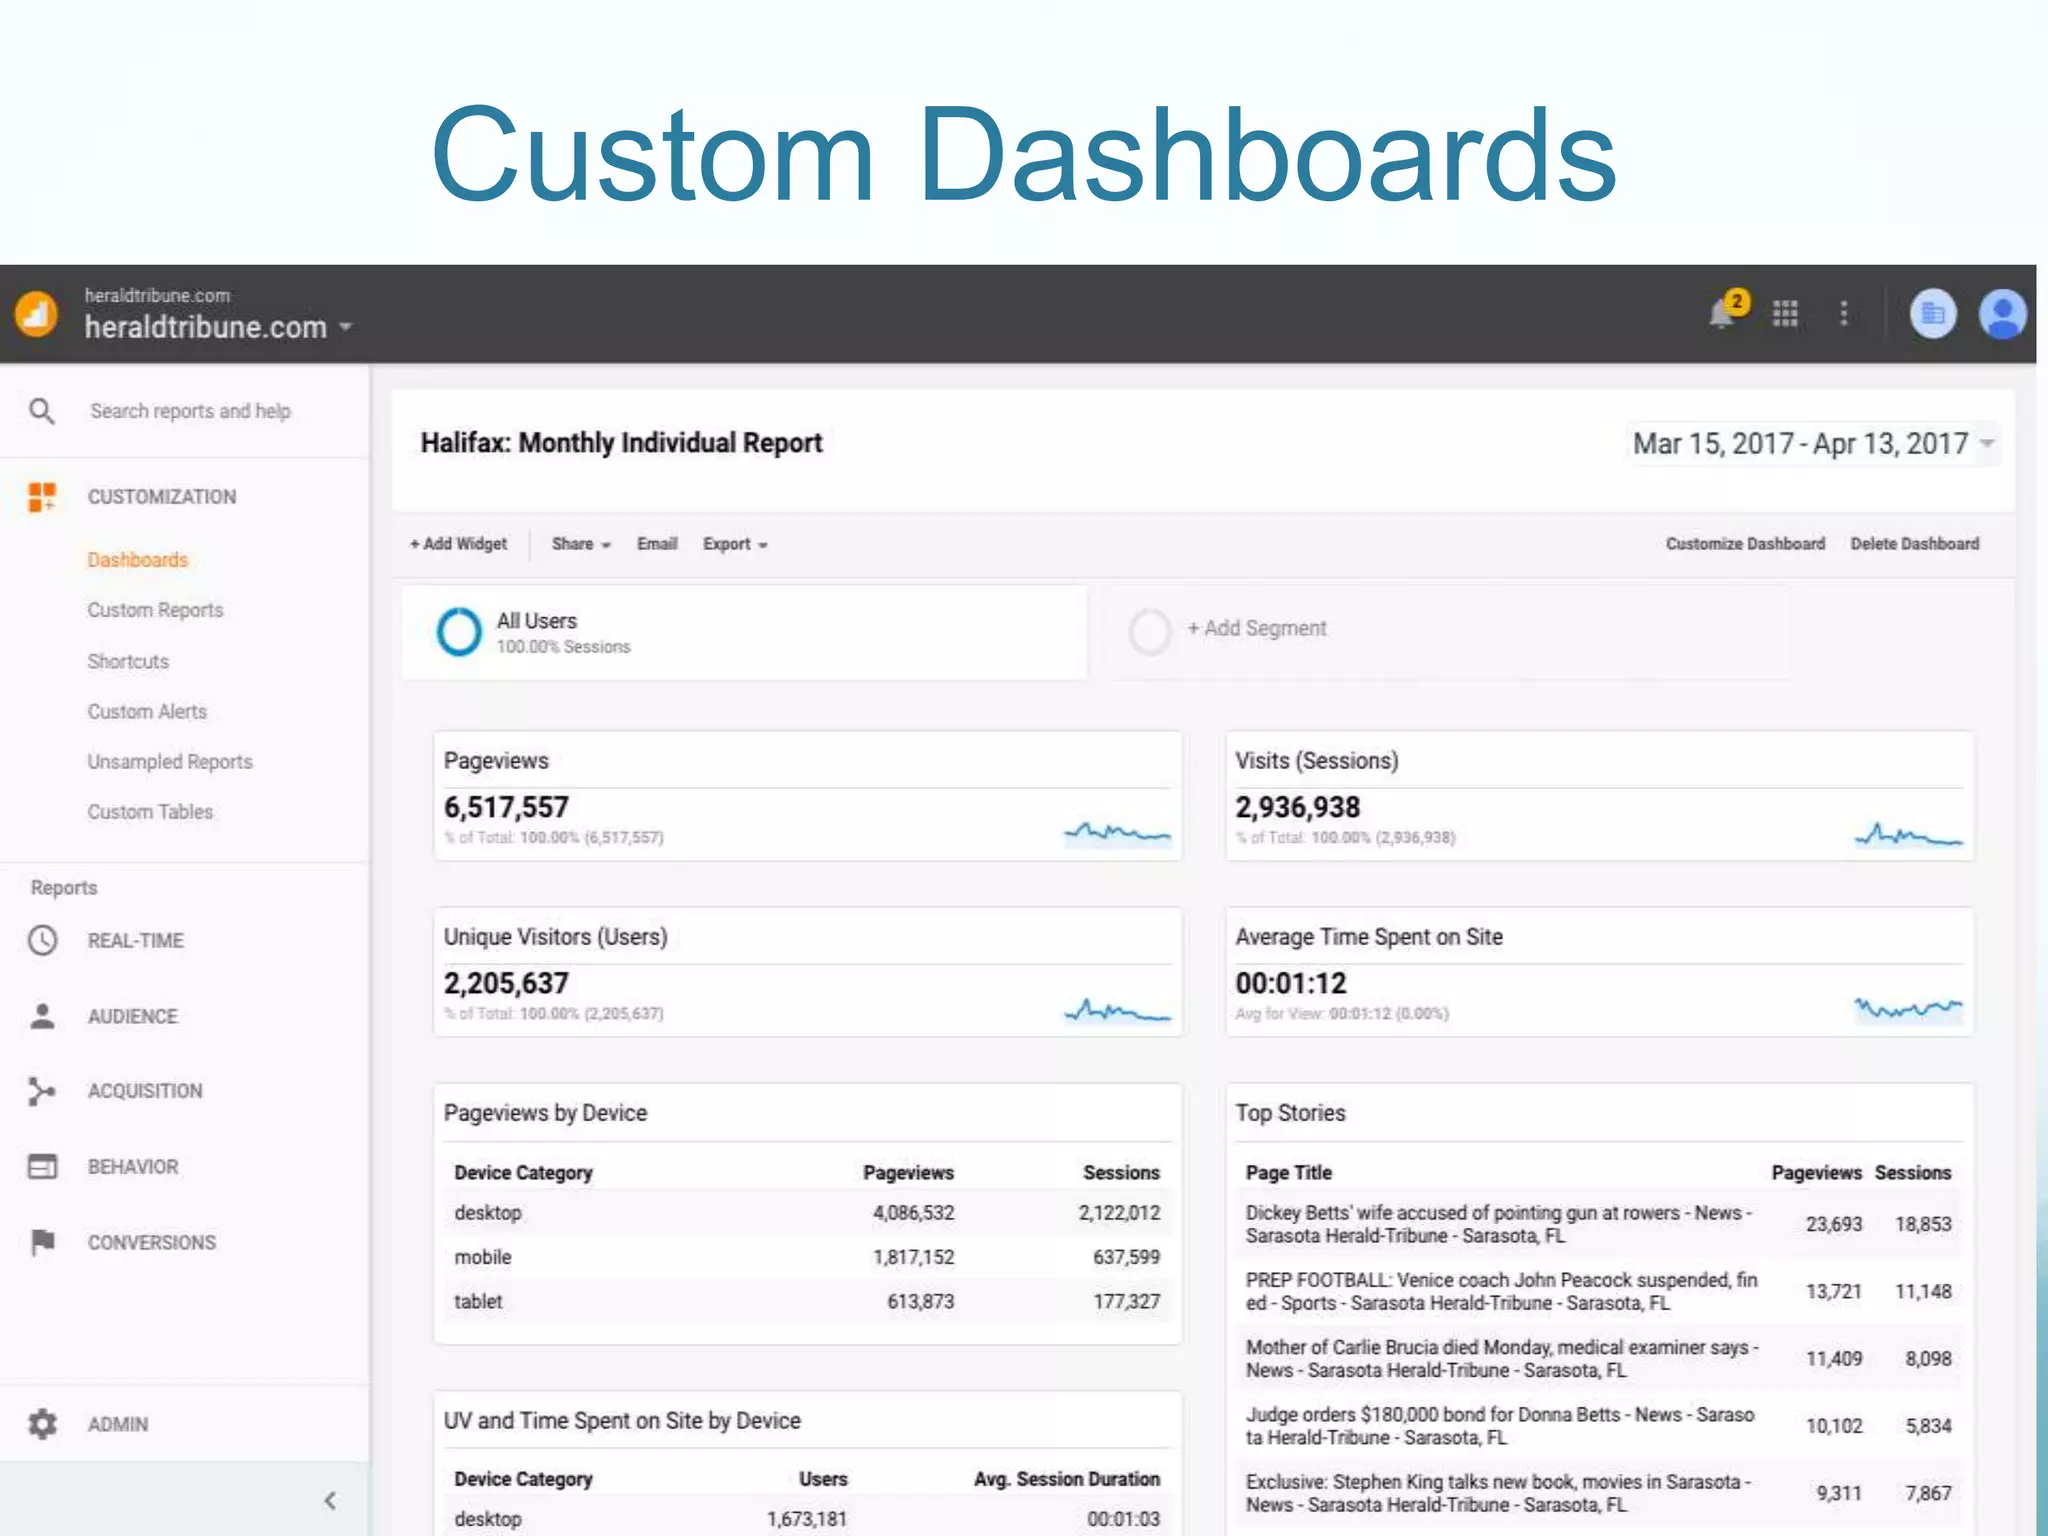
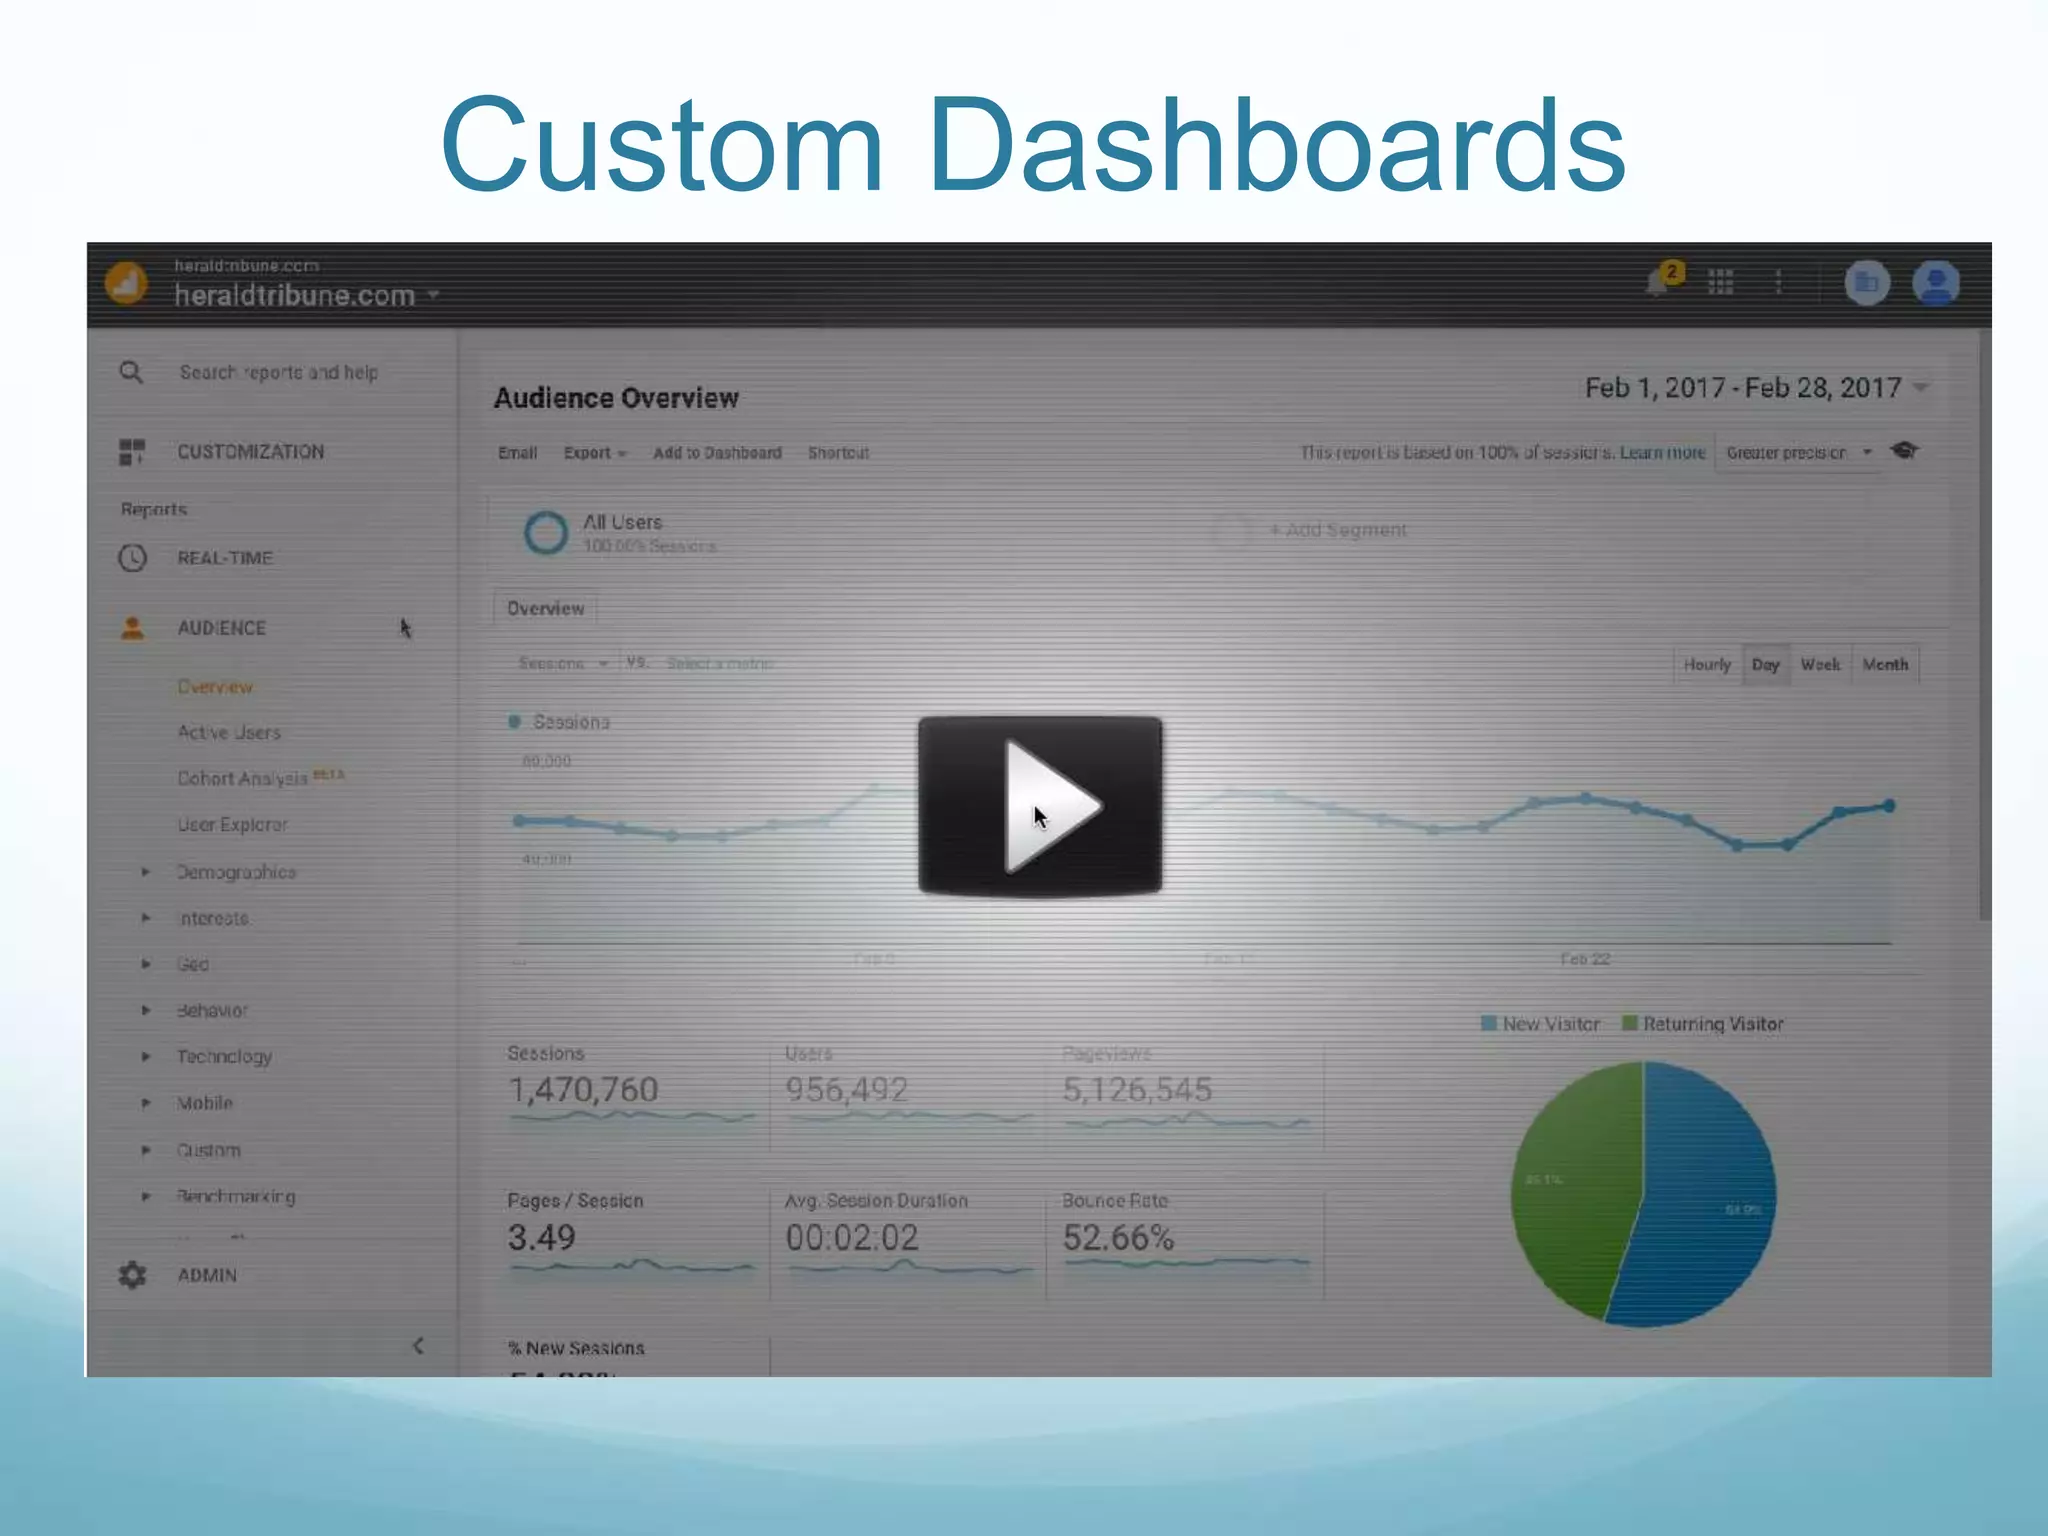
Sherri Horton gives a presentation on using Google Analytics to isolate and analyze data. She covers the basics of Google Analytics including key metrics like pageviews, sessions, and users. She then demonstrates how to create custom dashboards and reports to view data in different ways. Horton also explains how to use segments to compare data subsets and apply those segments to dashboards and reports. Finally, she provides a brief preview of using Google Data Studio for additional data visualization and analysis.
Winning SEO Using Schema Markup and Structured DataMarc Trimble
Schema microdata is applied to the content of a page to define exactly what it is and how it should be treated. Schema elements and attributes can be added directly to the HTML code of a web page to provide the search engines’ crawlers with additional information.
Schema is a type of micro data that makes it easier for search engines to interpret the information on your web pages more effectively. https://www.softprodigy.com/
This document discusses various on-page SEO techniques for optimizing individual web pages to rank higher in search engines. It covers optimizing meta titles, descriptions and keywords; using Google Analytics and Google Search Console to track performance; creating an XML sitemap; adding Open Graph tags for social sharing; including image alt text; using internal and external links; integrating social media sharing icons; testing page speed; and properly structuring H1, H2 and H3 heading tags. The goal is to provide all necessary information to search engines to understand content and properly index individual pages.
Schema plays a very important role in SEO. Schema or schema.org is a structured data vocabulary which defines entities, relationships & actions on the internet.
Schema makes it possible for search engines to understand the meaning behind subject matter on the web.
It gives a better user experience for internet users.
Google Analytics can be used to track website usage and understand user behavior. Key things learned in the session include:
- Setting up a Google Analytics account and adding the tracking code to website pages
- Understanding basic metrics like sessions, users, and pageviews from the dashboard
- Defining goals and funnels to track important user actions and conversions
- Using reports to analyze traffic sources, content, and visitor demographics
- Creating custom segments and comparisons to analyze specific user groups
The document provides an overview of the Winter '14 release from Salesforce. It highlights enhancements to Chatter such as archiving groups, increased post and comment character limits, and new rich link providers. Improvements to Sales Cloud include the new Salesforce Console for Sales and enhancements to the Salesforce for Outlook side panel like event association and send and add emails. The release also features new capabilities for Analytics like historical trending to analyze opportunity and custom object data over time, and the Analytics API. Force.com development enhancements include increased storage limits for sandboxes and changes to sandbox naming conventions.
Hey everyone! Have you ever wondered which analytics tool is the best?
Check out this comprehensive comparison of Hotjar vs Google Analytics from @webmaxy.
Check out this comprehensive comparison between #Hotjar and #GoogleAnalytics. It can help you make an informed decision about which tool to use for your website.
And don't forget to give @webmaxy a try too for a great analytics solution!
https://www.webmaxy.co/analyzer/hotjar-vs-google-analytics/
And get the free trial version today:
https://calendly.com/webmaxy/30min
#webmaxy #hotjar #googleanalytics #analytics #hotjarvsgoogleanalytics #googleanalyticsvshotjar #googleanalyticsalternatives #hotjaralternative #googlepageinsights #googleanalyticsforwebsite #googleanalyticsreport #googlewebanalytics #googleanalyticspricing #hotjarpricing #googleanalyticsheatmap #hotjarheatmap #googlesiteanalytics #googleanalyticstools #googleanalyticssignup #websiteanalytics #googleanalyticsfree #googleanalyticswebsitetraffic #googleanalyticsfeatures #hotjartracking #hotjarintegration #hotjaranalytics #googleanalyticsintegration #hotjarfeedback #hotjarandgoogleanalytics #hotjarintegrationwithgoogleanalytics
This document provides guidance on setting up Adobe SiteCatalyst to analyze search engine optimization (SEO) efforts. It discusses preparing SiteCatalyst by enabling search detection, e-commerce functionality, success events, and internal filters. It then describes how to create keyword, success event, e-commerce, and multi-channel reports to analyze SEO performance metrics like keyword rankings and conversions. The document is intended to help digital analytics professionals leverage SiteCatalyst's capabilities to establish a foundation for "smart SEO".
Web analytics is the measurement and analysis of internet data to understand and optimize website usage. It involves both on-site analytics, which measure visitor behavior on a website, and off-site analytics, which analyze a website's potential audience and online visibility regardless of ownership. Key performance indicators are metrics used to evaluate success, such as visits, pageviews, and conversion rates. Google Analytics is a commonly used tool that uses first-party cookies and JavaScript code to collect visitor data and provide reports on acquisition, behavior, and conversions.
Web analytics is measurement, collection, analysis and reporting of web data for purpose of understanding web usage. Web analytics not only used as tool to measure web traffic but can also be used as tool for business and market research and to assess and improve effectiveness of website
Google analytics is the free analytics tool used to which provides statistics for website. It helps to analyze the web traffic as well as different user interactions.
Digital marketing introduction - SEO for developersGunjan Srivastava
Digital marketing involves search engine optimization (SEO), paid advertisements, email marketing, and social media marketing to help websites rank higher in search engines and drive more traffic. SEO is the process of optimizing online content so search engines rank it highly for relevant keywords. Key factors for SEO include on-page elements like titles, meta descriptions and URLs, as well as off-page elements like backlinks. Analytics tools help track website traffic and performance.
Google Analytics 4 (GA4) is replacing Universal Analytics with a new data model focused on engagement. Key changes include:
- Combining app and website data with no property views;
- Using an event-based model instead of sessions for new metrics like scrolls and clicks;
- Automatically tracking certain interactions for privacy.
Reporting is also updated with new engagement metrics and exploration tools. OGMC is setting up working groups, migrating sites, and helping explain changes to ensure a smooth transition.
Google Analytics is a free web analytics service that provides statistics and analytical tools. It tracks website traffic sources, user behavior on the site, and conversions. To set up Google Analytics, sign up for an account and insert the tracking code on website pages. The dashboard provides an overview of key metrics like sessions, users, and engagement. Reports provide deeper insights into audiences, acquisitions, behavior, and conversions. Goals can be set up to track important actions or conversions.
This document summarizes Google Analytics, Google Webmaster Tools, and Google Website Optimizer. It discusses how these tools can help measure website usage, track goals and events, understand traffic sources, and optimize websites to improve performance. Key information provided includes setting up analytics tracking, tagging links, setting up conversion goals, and using Google Webmaster Tools to submit sitemaps and check for indexing errors.
Google Analytics with an Intro to Google Tag Manager for Austin WordPress MeetupRich Plakas
Google Analytics with an Intro to Google Tag Manager for Austin WordPress Meetup.
This was an intermediate session where we took a deeper look into Google Analytics. We also introduced Google Tag Manager as a better way to run tracking code on a website.
This document provides definitions for various terms related to web analytics and SiteCatalyst. It includes over 50 entries defining terms like account manager, acquisition, campaigns, channels, clicks-to-page, conversions, cookies, and more. Each entry is a concise definition of 1-3 sentences. The glossary is in alphabetical order and provides a helpful reference guide for understanding common analytics and SiteCatalyst terminology.
This presentation covers methods to set up Google Analytics on your website. It also includes basic terminologies / jargons / concepts that are used throughout Google Analytics
SynapseIndia gives an overview of Rich SnippetsSynapseIndia
This Video introduces rich snippets and their use for promotional practices to get better results with search engines. In this presentation, get to know about google rich snippets and hire SynapseIndia for effective SEO services,
Lunch and learn presentation given to the Social Media Association of Michigan on March 15, 2017 at TechTown Detroit. Basics of Google Analytics, as well as other data available in Google Search Console and Google Data Studio.
This document provides an introduction to Google Analytics for web developers. It discusses how Google Analytics can be used to track and understand visitor traffic, flows, and engagement on a website. It also describes how the Google Analytics tracking code works to collect anonymous visitor data and send it to Google's servers. Finally, it covers some key aspects of setting up and using Google Analytics, including dimensions, metrics, event tracking, and cross-device attribution.
Women in Communications Presentation: Marketing AnalyticsWebspec Design
You’re building your audience through emails, social media, and your website – but how do you know if you’re getting the biggest bang for your digital buck? Your time is precious, so you need to make sure you have the information to make the most prudent decisions for your social media marketing.
This two-hour workshop covered practical, efficient, and cost-effective methods to measure online communications. Hour one focused on website analytics using Google Analytics, Search Console, and Webmaster Tools. Hour two covered additional general analytics including email marketing and social media marketing.
Presented Wednesday, June 23, 2016 at a meeting of the Greater Des Moines Chapter of the Association for Women in Communications.
Authors:
Alex Karei, Marketing & Communications Director, Webspec Design
Lindsey LaMair, Digital Marketing Director, Webspec Design
www.webspecdesign.com
Google analytics for marketers beyond the basicsCharlie Kalech
Learn what lies beyond the default installation of Google Analytics.
Easily configure Custom Reports
Definitions, Samples & Instructions for Custom Dashboards, Widgets, Segments, Filters, Dimensions and Metrics.
Track on-site actions like Clicking Offsite or Playing a Video.
Compare Your Site to Others in Your Industry
Google analytics and google data studioBrian Pichman
This webinar introduces the basics of Google Analytics – from getting started and understanding how it works so you can get your website running with the powerful tools offered through Google Analytics. This webinar highlights the importance of using it for tracking of your website or marketing campaigns so you can make better informed decisions, understand your users, and use that data to provide a better digital experience. We will also explore how you can incorporate Google Data Studio with your Analytics for amazing interactive reports that are sure to impress any board meeting.
State of Artificial intelligence Report 2023kuntobimo2016
Artificial intelligence (AI) is a multidisciplinary field of science and engineering whose goal is to create intelligent machines.
We believe that AI will be a force multiplier on technological progress in our increasingly digital, data-driven world. This is because everything around us today, ranging from culture to consumer products, is a product of intelligence.
The State of AI Report is now in its sixth year. Consider this report as a compilation of the most interesting things we’ve seen with a goal of triggering an informed conversation about the state of AI and its implication for the future.
We consider the following key dimensions in our report:
Research: Technology breakthroughs and their capabilities.
Industry: Areas of commercial application for AI and its business impact.
Politics: Regulation of AI, its economic implications and the evolving geopolitics of AI.
Safety: Identifying and mitigating catastrophic risks that highly-capable future AI systems could pose to us.
Predictions: What we believe will happen in the next 12 months and a 2022 performance review to keep us honest.
More Related Content
Similar to Google Analytics: Isolating and Analyzing the Data
The document provides an overview of the Winter '14 release from Salesforce. It highlights enhancements to Chatter such as archiving groups, increased post and comment character limits, and new rich link providers. Improvements to Sales Cloud include the new Salesforce Console for Sales and enhancements to the Salesforce for Outlook side panel like event association and send and add emails. The release also features new capabilities for Analytics like historical trending to analyze opportunity and custom object data over time, and the Analytics API. Force.com development enhancements include increased storage limits for sandboxes and changes to sandbox naming conventions.
Hey everyone! Have you ever wondered which analytics tool is the best?
Check out this comprehensive comparison of Hotjar vs Google Analytics from @webmaxy.
Check out this comprehensive comparison between #Hotjar and #GoogleAnalytics. It can help you make an informed decision about which tool to use for your website.
And don't forget to give @webmaxy a try too for a great analytics solution!
https://www.webmaxy.co/analyzer/hotjar-vs-google-analytics/
And get the free trial version today:
https://calendly.com/webmaxy/30min
#webmaxy #hotjar #googleanalytics #analytics #hotjarvsgoogleanalytics #googleanalyticsvshotjar #googleanalyticsalternatives #hotjaralternative #googlepageinsights #googleanalyticsforwebsite #googleanalyticsreport #googlewebanalytics #googleanalyticspricing #hotjarpricing #googleanalyticsheatmap #hotjarheatmap #googlesiteanalytics #googleanalyticstools #googleanalyticssignup #websiteanalytics #googleanalyticsfree #googleanalyticswebsitetraffic #googleanalyticsfeatures #hotjartracking #hotjarintegration #hotjaranalytics #googleanalyticsintegration #hotjarfeedback #hotjarandgoogleanalytics #hotjarintegrationwithgoogleanalytics
This document provides guidance on setting up Adobe SiteCatalyst to analyze search engine optimization (SEO) efforts. It discusses preparing SiteCatalyst by enabling search detection, e-commerce functionality, success events, and internal filters. It then describes how to create keyword, success event, e-commerce, and multi-channel reports to analyze SEO performance metrics like keyword rankings and conversions. The document is intended to help digital analytics professionals leverage SiteCatalyst's capabilities to establish a foundation for "smart SEO".
Web analytics is the measurement and analysis of internet data to understand and optimize website usage. It involves both on-site analytics, which measure visitor behavior on a website, and off-site analytics, which analyze a website's potential audience and online visibility regardless of ownership. Key performance indicators are metrics used to evaluate success, such as visits, pageviews, and conversion rates. Google Analytics is a commonly used tool that uses first-party cookies and JavaScript code to collect visitor data and provide reports on acquisition, behavior, and conversions.
Web analytics is measurement, collection, analysis and reporting of web data for purpose of understanding web usage. Web analytics not only used as tool to measure web traffic but can also be used as tool for business and market research and to assess and improve effectiveness of website
Google analytics is the free analytics tool used to which provides statistics for website. It helps to analyze the web traffic as well as different user interactions.
Digital marketing introduction - SEO for developersGunjan Srivastava
Digital marketing involves search engine optimization (SEO), paid advertisements, email marketing, and social media marketing to help websites rank higher in search engines and drive more traffic. SEO is the process of optimizing online content so search engines rank it highly for relevant keywords. Key factors for SEO include on-page elements like titles, meta descriptions and URLs, as well as off-page elements like backlinks. Analytics tools help track website traffic and performance.
Google Analytics 4 (GA4) is replacing Universal Analytics with a new data model focused on engagement. Key changes include:
- Combining app and website data with no property views;
- Using an event-based model instead of sessions for new metrics like scrolls and clicks;
- Automatically tracking certain interactions for privacy.
Reporting is also updated with new engagement metrics and exploration tools. OGMC is setting up working groups, migrating sites, and helping explain changes to ensure a smooth transition.
Google Analytics is a free web analytics service that provides statistics and analytical tools. It tracks website traffic sources, user behavior on the site, and conversions. To set up Google Analytics, sign up for an account and insert the tracking code on website pages. The dashboard provides an overview of key metrics like sessions, users, and engagement. Reports provide deeper insights into audiences, acquisitions, behavior, and conversions. Goals can be set up to track important actions or conversions.
This document summarizes Google Analytics, Google Webmaster Tools, and Google Website Optimizer. It discusses how these tools can help measure website usage, track goals and events, understand traffic sources, and optimize websites to improve performance. Key information provided includes setting up analytics tracking, tagging links, setting up conversion goals, and using Google Webmaster Tools to submit sitemaps and check for indexing errors.
Google Analytics with an Intro to Google Tag Manager for Austin WordPress MeetupRich Plakas
Google Analytics with an Intro to Google Tag Manager for Austin WordPress Meetup.
This was an intermediate session where we took a deeper look into Google Analytics. We also introduced Google Tag Manager as a better way to run tracking code on a website.
This document provides definitions for various terms related to web analytics and SiteCatalyst. It includes over 50 entries defining terms like account manager, acquisition, campaigns, channels, clicks-to-page, conversions, cookies, and more. Each entry is a concise definition of 1-3 sentences. The glossary is in alphabetical order and provides a helpful reference guide for understanding common analytics and SiteCatalyst terminology.
This presentation covers methods to set up Google Analytics on your website. It also includes basic terminologies / jargons / concepts that are used throughout Google Analytics
SynapseIndia gives an overview of Rich SnippetsSynapseIndia
This Video introduces rich snippets and their use for promotional practices to get better results with search engines. In this presentation, get to know about google rich snippets and hire SynapseIndia for effective SEO services,
Lunch and learn presentation given to the Social Media Association of Michigan on March 15, 2017 at TechTown Detroit. Basics of Google Analytics, as well as other data available in Google Search Console and Google Data Studio.
This document provides an introduction to Google Analytics for web developers. It discusses how Google Analytics can be used to track and understand visitor traffic, flows, and engagement on a website. It also describes how the Google Analytics tracking code works to collect anonymous visitor data and send it to Google's servers. Finally, it covers some key aspects of setting up and using Google Analytics, including dimensions, metrics, event tracking, and cross-device attribution.
Women in Communications Presentation: Marketing AnalyticsWebspec Design
You’re building your audience through emails, social media, and your website – but how do you know if you’re getting the biggest bang for your digital buck? Your time is precious, so you need to make sure you have the information to make the most prudent decisions for your social media marketing.
This two-hour workshop covered practical, efficient, and cost-effective methods to measure online communications. Hour one focused on website analytics using Google Analytics, Search Console, and Webmaster Tools. Hour two covered additional general analytics including email marketing and social media marketing.
Presented Wednesday, June 23, 2016 at a meeting of the Greater Des Moines Chapter of the Association for Women in Communications.
Authors:
Alex Karei, Marketing & Communications Director, Webspec Design
Lindsey LaMair, Digital Marketing Director, Webspec Design
www.webspecdesign.com
Google analytics for marketers beyond the basicsCharlie Kalech
Learn what lies beyond the default installation of Google Analytics.
Easily configure Custom Reports
Definitions, Samples & Instructions for Custom Dashboards, Widgets, Segments, Filters, Dimensions and Metrics.
Track on-site actions like Clicking Offsite or Playing a Video.
Compare Your Site to Others in Your Industry
Google analytics and google data studioBrian Pichman
This webinar introduces the basics of Google Analytics – from getting started and understanding how it works so you can get your website running with the powerful tools offered through Google Analytics. This webinar highlights the importance of using it for tracking of your website or marketing campaigns so you can make better informed decisions, understand your users, and use that data to provide a better digital experience. We will also explore how you can incorporate Google Data Studio with your Analytics for amazing interactive reports that are sure to impress any board meeting.
Similar to Google Analytics: Isolating and Analyzing the Data (20)
State of Artificial intelligence Report 2023kuntobimo2016
Artificial intelligence (AI) is a multidisciplinary field of science and engineering whose goal is to create intelligent machines.
We believe that AI will be a force multiplier on technological progress in our increasingly digital, data-driven world. This is because everything around us today, ranging from culture to consumer products, is a product of intelligence.
The State of AI Report is now in its sixth year. Consider this report as a compilation of the most interesting things we’ve seen with a goal of triggering an informed conversation about the state of AI and its implication for the future.
We consider the following key dimensions in our report:
Research: Technology breakthroughs and their capabilities.
Industry: Areas of commercial application for AI and its business impact.
Politics: Regulation of AI, its economic implications and the evolving geopolitics of AI.
Safety: Identifying and mitigating catastrophic risks that highly-capable future AI systems could pose to us.
Predictions: What we believe will happen in the next 12 months and a 2022 performance review to keep us honest.
STATATHON: Unleashing the Power of Statistics in a 48-Hour Knowledge Extravag...sameer shah
"Join us for STATATHON, a dynamic 2-day event dedicated to exploring statistical knowledge and its real-world applications. From theory to practice, participants engage in intensive learning sessions, workshops, and challenges, fostering a deeper understanding of statistical methodologies and their significance in various fields."
06-04-2024 - NYC Tech Week - Discussion on Vector Databases, Unstructured Data and AI
Round table discussion of vector databases, unstructured data, ai, big data, real-time, robots and Milvus.
A lively discussion with NJ Gen AI Meetup Lead, Prasad and Procure.FYI's Co-Found
ViewShift: Hassle-free Dynamic Policy Enforcement for Every Data LakeWalaa Eldin Moustafa
Dynamic policy enforcement is becoming an increasingly important topic in today’s world where data privacy and compliance is a top priority for companies, individuals, and regulators alike. In these slides, we discuss how LinkedIn implements a powerful dynamic policy enforcement engine, called ViewShift, and integrates it within its data lake. We show the query engine architecture and how catalog implementations can automatically route table resolutions to compliance-enforcing SQL views. Such views have a set of very interesting properties: (1) They are auto-generated from declarative data annotations. (2) They respect user-level consent and preferences (3) They are context-aware, encoding a different set of transformations for different use cases (4) They are portable; while the SQL logic is only implemented in one SQL dialect, it is accessible in all engines.
#SQL #Views #Privacy #Compliance #DataLake
2. About Me
Data Analyst & SEO Manager for GateHouse Media
Over 400 digital newspaper sites and growing
Experience doing SEO, Social Media, Content
Marketing and Analysis for publication, e-commerce
and lead gen companies
7 years in the Digital Marketing Industry
Google Analytics Certified
3. Session Overview
Google Analytics
The Basics
Creating Custom Dashboards
Building Custom Reports
Using Segments to isolate and compare data sets
Data Studio Preview
Questions
4. GA: The Basics
Pageviews: An instance of a page being loaded (or reloaded) in a
browser.
Sessions: Visits; period of time a user is active on your site or
app. By default, if a use is inactive for 30 minutes or more, any
future activity is attributed to a new session. Users that leave your
site and return within 30 minutes are counted as part of the original
session.
Users: Unique Visitors; The unique browsers that visit your
website or mobile app.
Bounce Rate: The rate at which someone visits your site/app and
leaves.
Avg. Session Duration: The average time a user spent on your
website or app.
5. Reporting Dashboard Basics
Real Time
Used to see who is viewing what in the last minute
Audience
Pageviews, Sessions, Users, Mobile Info, New/Returning
Users, Location
Acquisition
Where traffic is coming from; how they got to your site
Behavior
Where you can find how a person is interacting with your
site
Customization
11. Segments
Segments let you isolate and analyze subsets of your Analytics
data. You use the segment builder to configure the individual filters
that together constitute a segment. You then apply segments to
your reports and dashboards so you can see that specific data.
12. Segments
Pre Generated Segments
GA has already created segments that you can use to compare data
sets
Custom Segments
Build your own segments by using custom report and dashboard
widget logic
How can you use them?
Data Comparison
16. When to Use What
Use your custom dashboards everyday for basic level
reporting
Use custom reports when you need to apply complicated
filters to the data
Also to do page level reporting at a larger scale
Top 100 stories, etc.
Time based reporting
Best hour of the day for article traffic
Use segments when you need to compare session or user
based metrics/data such as device categories (mobile,
desktop) or traffic sources (direct, organic, social) or
demographics (age, gender, etc)
Use segments with your dashboards for quick reporting!
Now that we know about the metrics we are looking for, let’s quickly look at the left rail of your dashboard. This is where we will go to locate our means of finding our metrics → We are going to briefly go over Real Time, Audience, Acquisition and Behavior.
We will also show you how to set up a personal dashboard, next, so you can find information from these tabs quickly.
Real – Time is used to see who is viewing what in the last minute on your site;
Audience is where you will find your major metrics – pageviews, sessions, users, device info, and other demographics like age, location and gender
Acquisition is where you will find where your users are coming from and how they arrived at your site; social network? Google? Directly?
Behavior is where you can find how a person is interacting with your site; what content do they read the most? Did you make a design change that is leading people to bounce from your site or leave your site quicker than normal? Maybe theres an intrusive ad causing users to leave from a certain page. This is where you’d find the answers to those questions.
And Customization we are going to go over in the next few slides.
Here is a screenshot of a Dashboard I made for our one of our sites. It includes most of the top metrics a newsroom needs to report on each month: Pageviews, Visits, Unique Visitors, Average Time Spent on Site, Pageviews by device, Time spent on each device, Top stories and below the fold are bounce rate and Social Referral data. You can customize each of these boxes and widgets to show metrics and dimensions you want.
I don’t show it in this video but there is a spot within the Custom Dash underneath the title that says EMAIL – you can schedule your dashboard to go out in daily, weekly or monthly time frames. If you hate analytics you can essentially create your dashboard, set up your emails and never log in again.
A lot of editors like this option
Just a little about the Top stories regex string we used in the widget last slide.
This is an example of a story URL for one of our gatehouse sites. We have the site, section, date, then the story title. This is consistent for all story pages.
To query all story pages for an aggregate total we need to create a string of code to form a regular expression that follows that pattern.
In the Regex string, you see the red matches the ‘news’ section of the URL or the section front name. It includes all of our top level section front names so we can get site wide data. If we want to know just about sports articles, we could remove all the other section front names and leave sports only.
The blue pulls in only ‘d’ or dates with 8 characters.
The green bulls in any character a-z lowercase, A-Z uppercase, numbers 0-9 and any special characters.
>>Finding the patterns in your URL structures is easier than creating a regex string to pull them in, especially if you have no development experience but these two links can be really helpful.
Ok so moving on to Custom Reports!
Basically, what we have done with our dashboards is create mini custom reports.
Im going to show you how to create a Social Referral Report so you can See which articles are getting the most pageviews from Social Sharing
Other custom reports you can make are:
> Device Category to see Mobile Tablet and Desktop Traffic
> Google News Referral Traffic
> Section Front Traffic
> Author Reports with the implementation of Custom Dimensions -- this is something you’ll need a developer for or Google Tag Manager
> Pageviews by Day, Week or Month- - even Month of the Year
> 404 Reports so you can site any redirect or removal issues with your site
There are really endless possibilities for these reports. I recommend going to the Google Analytics help center and reading up on the different metrics and dimensions that can be combined.
This is a more complicated report I created for our New England Sales & Marketing department. They wanted to know where most of our readers were located in the region. They wanted site level reporting, Regional Reporting, City Reporting and a map if possible. Tall order but possible.
To build this report, we are going to go into the backend and look at the guts of the thing instead of creating from scratch. Herewe have 3 different tabs within one report. First is Site Metrics. We choose our standard metric set. Hostname or full site stats will be included as our Dimension along with City and Region, in case you want to see individual geographical stats.
Then lets apply our filters - We only want our New England sites so I choose their sitenames and build a Regex with their hostnames. Each hostname is separated with a Pipe which means OR in Regular Expressions.
> Then we want to strip out any 3rd party URLs that might get caught up in the report.
Next we’ll move to the 2nd tab “City Metrics”. This is basically the same as the first tab except we want the Dimension to be CITY.
Next we want the City Map in the 3rd tab. Again, the same as the first tab in terms of metrics and filters. But this time we want a Map Overlay. We only want the US with a dimension of Region. Click Save.
> Now we are looking at all of the data our marking reps need for the entire region down to the individual site or city we are targeting.
This is just an example of the power of custom reports and how nitty gritty you can get with this data.
Moving on to segments -
> Segments let you isolate and analyze subsets of your Analytics data. You use the segment builder to configure the individual filters that together constitute a segment. You then apply segments to your reports and dashboards so you can see that specific data.
>The red box is where we will be spending the rest of the session. These are where your segments live - where we create, apply and remove any kind of segmentation.
> When you click [Choose segment from List] you will see a bunch of pre-generated segments. In most cases, these will serve your purpose. This has device segments so you can compare mobile vs desktop vs tablet traffic, they also have mobile and tablet traffic combined, marketing channel traffic segments, and more.
>We can also create custom segments for specific sets of data from a particular traffic channel - like only Facebook traffic vs. Twitter traffic for instance.
> Segments are a great way to compare 2 or more sets of data in one view. Segments carry with your dash as you click through different parts of GA as well. So if you apply a segment to the Audience overview, you can then go to Acquisition and compare data that way without having to re-create or re-apply any segments.
So now I am going to show you how what the segment creator looks like and where you can find any pre-generated segments or custom segments you create.
Click Add Segment. Then System in that drop down. Here you will find all of your pre-generated segments. If you hover over them, you can see the filter patterns that are being applied to each segment. So like we did with the dashboard widgets and custom reports, we are using filtering and different rules to get to different data sets.
Select Mobile and Tablet Traffic. There are also other segments that are available like Direct Traffic or Tablet only traffic, or table and desktop traffic combined.
>Once you have selected the segment you want just click “Apply”
>Then you will have your ALL User traffic which is all over you data vs. Mobile and Tablet only traffic. From this screen you can really see what portion of the data is made up of mobile or tablet traffic out of your overall traffic numbers.
> These segments carry over to other sections of the reporting dashboard. So if we were to go to Acquisition Channels, we can see how much of each type of traffic comes from which channel without having to re-do your segments.
You may have noticed on the last slide that there is no desktop device only segment in the pre-generated selection. I’m not sure why - it seems like an obvious choice to create that but alas, they did not. So this is one you may want to create right now while we’re going through it together because I imagine you’ll need it at some point or another.
> Click the plus sign to add additional segments.
> Here we will click New Segment. There are many fields for every segment you might want to make, from Demographic specifics, to Technology like OS or Browser or Device Category to Behavior like how many sessions a user has had or date of first session or traffic sources like direct or organic, and then the more advanced sections where you can create your own super customized segments.
>For this one, we are going to make a Desktop Device Only Segment. So go back to Technology and look for Device Category. We can this to Exactly Match: Desktop. Click Save.
The most practical use for segments when you are compiling reports as opposed to digging through data is by applying your segments to your custom dashboards. Instead of creating a desktop dashboard and a separate mobile dashboard, you can ultimately have them both on one report by applying both segments.
Just hop into your custom dash and apply which segments you want. Some widgets may be redundant if you made any with device type filters but that’s an easy fix. or you can leave them. Its all about customization and making GA work for you. This is just one way the make your reporting both more robust and easier.
Pro Tip: The segments do stay with the report if you schedule to send it out. This could help cut down on email waste too!
So just to summarize both webinars---
> Use your Custom Dashboards everyday for basic level reporting
> Use Custom Reports when you need to apply complicated filters to the data [give example]
> Also to do page level reporting at a larger scale
> Top 100 stories, etc.
> Time based reporting
> Best hour of the day for article traffic
> Use Segments when you need to compare session or user based metrics such as device categories (mobile, desktop) or traffic sources (direct, organic, social) or demographics (age, gender, etc)
> Use Segments with your Dashboards for quick reporting!
Data Studio is the newest product launch from Google. I have been using it to develop cleaner and easier to read reports for our editors and newsrooms. The dashboards and custom reports we went over this session are the building blocks for this report you are viewing now.