Download to read offline
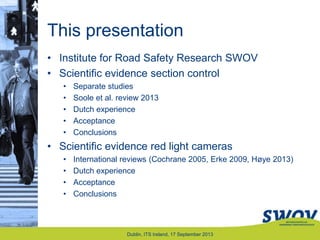


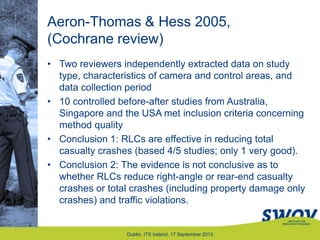
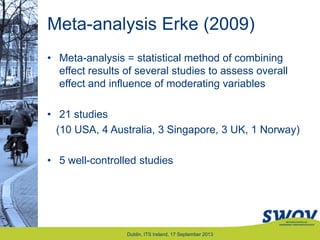
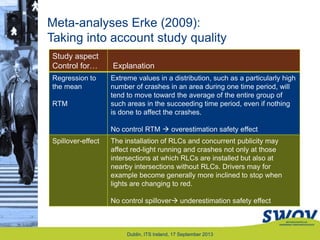
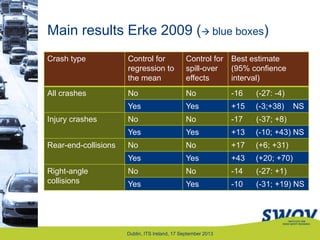
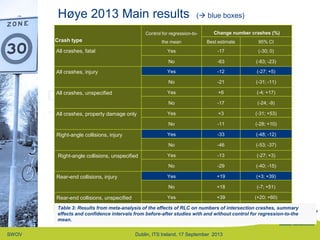

The presentation discusses the scientific evidence on the effects of section control and red light cameras on road safety, highlighting various studies from several countries that demonstrate significant reductions in speed and crashes. It covers the effectiveness, acceptance, and cost-benefit analysis of these enforcement measures, including a comprehensive review of relevant literature. Additionally, it emphasizes the importance of scientific rigor in evaluating the outcomes of such systems for improving road safety.