Downloaded 252 times


![Data Syndrome: Agile Data Science 2.0
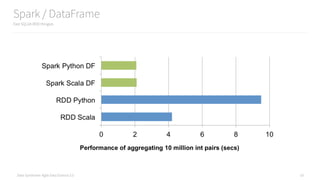
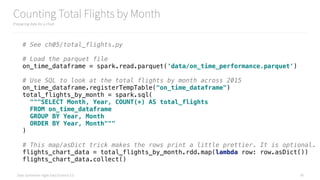
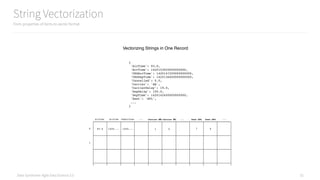
Creating Objects from CSV using a function
How to create objects from CSV using a function instead of a lambda
26
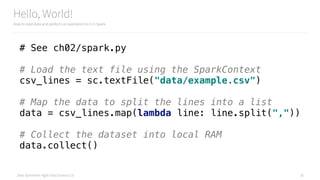
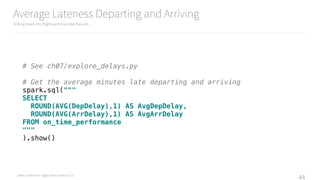
# See ch02/groupby.py
csv_lines = sc.textFile("data/example.csv")
# Turn the CSV lines into objects
def csv_to_record(line):
parts = line.split(",")
record = {
"name": parts[0],
"company": parts[1],
"title": parts[2]
}
return record
# Apply the function to every record
records = csv_lines.map(csv_to_record)
# Inspect the first item in the dataset
records.first()](https://image.slidesharecdn.com/introductiontopyspark-170216005456/85/Introduction-to-PySpark-26-320.jpg)
![Data Syndrome: Agile Data Science 2.0
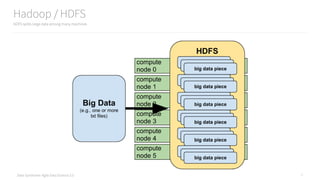
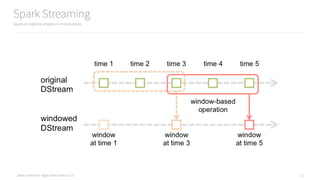
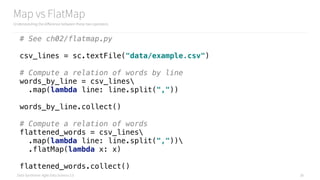
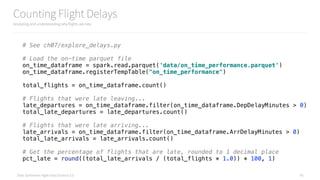
Using a GroupBy to Count Jobs
Count things using the groupBy API
27
# Group the records by the name of the person
grouped_records = records.groupBy(lambda x: x["name"])
# Show the first group
grouped_records.first()
# Count the groups
job_counts = grouped_records.map(
lambda x: {
"name": x[0],
"job_count": len(x[1])
}
)
job_counts.first()
job_counts.collect()](https://image.slidesharecdn.com/introductiontopyspark-170216005456/85/Introduction-to-PySpark-27-320.jpg)
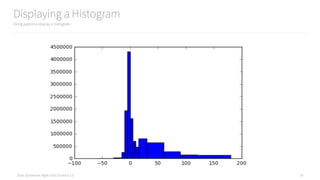
![Data Syndrome: Agile Data Science 2.0
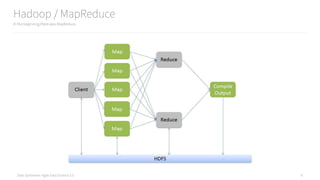
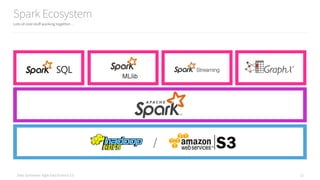
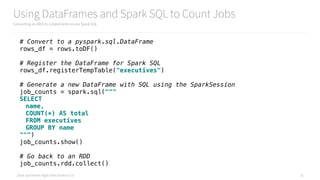
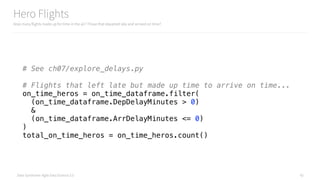
Map vs FlatMap
Understanding the difference between these two operators
29
words_by_line.collect()
[['Russell Jurney', 'Relato', 'CEO'],
['Florian Liebert', 'Mesosphere', 'CEO'],
['Don Brown', 'Rocana', 'CIO'],
['Steve Jobs', 'Apple', 'CEO'],
['Donald Trump', 'The Trump Organization', 'CEO'],
['Russell Jurney', 'Data Syndrome', 'Principal Consultant']]
flattened_words.collect()
['Russell Jurney',
'Relato',
'CEO',
'Florian Liebert',
'Mesosphere',
'CEO',
'Don Brown',
'Rocana',
'CIO',
'Steve Jobs',
'Apple',
'CEO',
'Donald Trump',
'The Trump Organization',
'CEO',
'Russell Jurney',
'Data Syndrome',
'Principal Consultant']](https://image.slidesharecdn.com/introductiontopyspark-170216005456/85/Introduction-to-PySpark-29-320.jpg)
![Data Syndrome: Agile Data Science 2.0
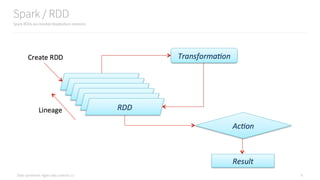
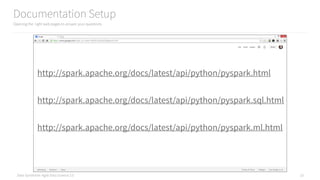
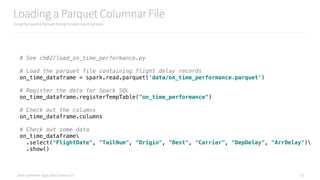
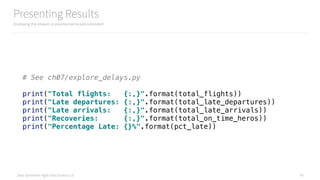
Using DataFrames and Spark SQL to Count Jobs
Converting an RDD to a DataFrame to use Spark SQL
30
# See ch02/sql.py
csv_lines = sc.textFile("data/example.csv")
from pyspark.sql import Row
# Convert the CSV into a pyspark.sql.Row
def csv_to_row(line):
parts = line.split(",")
row = Row(
name=parts[0],
company=parts[1],
title=parts[2]
)
return row
# Apply the function to get rows in an RDD
rows = csv_lines.map(csv_to_row)](https://image.slidesharecdn.com/introductiontopyspark-170216005456/85/Introduction-to-PySpark-30-320.jpg)

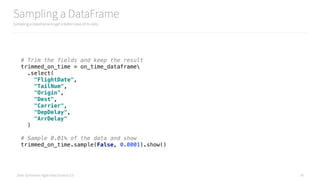
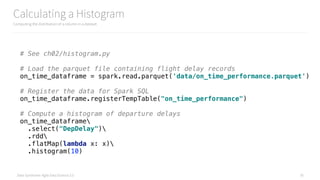
![Data Syndrome: Agile Data Science 2.0
Displaying a Histogram
Using pyplot to display a histogram
36
import numpy as np
import matplotlib.mlab as mlab
import matplotlib.pyplot as plt
# Function to plot a histogram using pyplot
def create_hist(rdd_histogram_data):
"""Given an RDD.histogram, plot a pyplot histogram"""
heights = np.array(rdd_histogram_data[1])
full_bins = rdd_histogram_data[0]
mid_point_bins = full_bins[:-1]
widths = [abs(i - j) for i, j in zip(full_bins[:-1], full_bins[1:])]
bar = plt.bar(mid_point_bins, heights, width=widths, color='b')
return bar
# Compute a histogram of departure delays
departure_delay_histogram = on_time_dataframe
.select("DepDelay")
.rdd
.flatMap(lambda x: x)
.histogram(10, [-60,-30,-15,-10,-5,0,5,10,15,30,60,90,120,180])
create_hist(departure_delay_histogram)](https://image.slidesharecdn.com/introductiontopyspark-170216005456/85/Introduction-to-PySpark-36-320.jpg)
![Data Syndrome: Agile Data Science 2.0
Preparing Complex Records for Storage
Getting data ready for storage in a document or key/value store
40
# See ch05/extract_airplanes.py
# Load the parquet file
on_time_dataframe = spark.read.parquet('data/on_time_performance.parquet')
on_time_dataframe.registerTempTable("on_time_performance")
# Filter down to the fields we need to identify and link to a flight
flights = on_time_dataframe.rdd.map(lambda x:
(x.Carrier, x.FlightDate, x.FlightNum, x.Origin, x.Dest, x.TailNum)
)
# Group flights by tail number, sorted by date, then flight number, then origin/dest
flights_per_airplane = flights
.map(lambda nameTuple: (nameTuple[5], [nameTuple[0:5]]))
.reduceByKey(lambda a, b: a + b)
.map(lambda tuple:
{
'TailNum': tuple[0],
'Flights': sorted(tuple[1], key=lambda x: (x[1], x[2], x[3], x[4]))
}
)
flights_per_airplane.first()](https://image.slidesharecdn.com/introductiontopyspark-170216005456/85/Introduction-to-PySpark-40-320.jpg)
![Data Syndrome: Agile Data Science 2.0
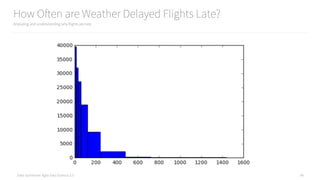
How Often are Weather Delayed Flights Late?
Analyzing and understanding why flights are late
47
# Eyeball the first to define our buckets
weather_delay_histogram = on_time_dataframe
.select("WeatherDelay")
.rdd
.flatMap(lambda x: x)
.histogram([1, 5, 10, 15, 30, 60, 120, 240, 480, 720, 24*60.0])
print(weather_delay_histogram)
create_hist(weather_delay_histogram)](https://image.slidesharecdn.com/introductiontopyspark-170216005456/85/Introduction-to-PySpark-47-320.jpg)
![Data Syndrome: Agile Data Science 2.0
Preparing Histogram Data for d3.js
Analyzing and understanding why flights are late
49
# Transform the data into something easily consumed by d3
def histogram_to_publishable(histogram):
record = {'key': 1, 'data': []}
for label, value in zip(histogram[0], histogram[1]):
record['data'].append(
{
'label': label,
'value': value
}
)
return record
# Recompute the weather histogram with a filter for on-time flights
weather_delay_histogram = on_time_dataframe
.filter(
(on_time_dataframe.WeatherDelay != None)
&
(on_time_dataframe.WeatherDelay > 0)
)
.select("WeatherDelay")
.rdd
.flatMap(lambda x: x)
.histogram([0, 15, 30, 60, 120, 240, 480, 720, 24*60.0])
print(weather_delay_histogram)
record = histogram_to_publishable(weather_delay_histogram)](https://image.slidesharecdn.com/introductiontopyspark-170216005456/85/Introduction-to-PySpark-49-320.jpg)

![Data Syndrome: Agile Data Science 2.0 53
scikit-learn was 166. Spark MLlib is very powerful!
ch08/train_spark_mllib_model.py
190 Line Model
# !/usr/bin/env python
import sys, os, re
# Pass date and base path to main() from airflow
def main(base_path):
# Default to "."
try: base_path
except NameError: base_path = "."
if not base_path:
base_path = "."
APP_NAME = "train_spark_mllib_model.py"
# If there is no SparkSession, create the environment
try:
sc and spark
except NameError as e:
import findspark
findspark.init()
import pyspark
import pyspark.sql
sc = pyspark.SparkContext()
spark = pyspark.sql.SparkSession(sc).builder.appName(APP_NAME).getOrCreate()
#
# {
# "ArrDelay":5.0,"CRSArrTime":"2015-12-31T03:20:00.000-08:00","CRSDepTime":"2015-12-31T03:05:00.000-08:00",
# "Carrier":"WN","DayOfMonth":31,"DayOfWeek":4,"DayOfYear":365,"DepDelay":14.0,"Dest":"SAN","Distance":368.0,
# "FlightDate":"2015-12-30T16:00:00.000-08:00","FlightNum":"6109","Origin":"TUS"
# }
#
from pyspark.sql.types import StringType, IntegerType, FloatType, DoubleType, DateType, TimestampType
from pyspark.sql.types import StructType, StructField
from pyspark.sql.functions import udf
schema = StructType([
StructField("ArrDelay", DoubleType(), True), # "ArrDelay":5.0
StructField("CRSArrTime", TimestampType(), True), # "CRSArrTime":"2015-12-31T03:20:00.000-08:00"
StructField("CRSDepTime", TimestampType(), True), # "CRSDepTime":"2015-12-31T03:05:00.000-08:00"
StructField("Carrier", StringType(), True), # "Carrier":"WN"
StructField("DayOfMonth", IntegerType(), True), # "DayOfMonth":31
StructField("DayOfWeek", IntegerType(), True), # "DayOfWeek":4
StructField("DayOfYear", IntegerType(), True), # "DayOfYear":365
StructField("DepDelay", DoubleType(), True), # "DepDelay":14.0
StructField("Dest", StringType(), True), # "Dest":"SAN"
StructField("Distance", DoubleType(), True), # "Distance":368.0
StructField("FlightDate", DateType(), True), # "FlightDate":"2015-12-30T16:00:00.000-08:00"
StructField("FlightNum", StringType(), True), # "FlightNum":"6109"
StructField("Origin", StringType(), True), # "Origin":"TUS"
])
input_path = "{}/data/simple_flight_delay_features.jsonl.bz2".format(
base_path
)
features = spark.read.json(input_path, schema=schema)
features.first()
#
# Check for nulls in features before using Spark ML
#
null_counts = [(column, features.where(features[column].isNull()).count()) for column in features.columns]
cols_with_nulls = filter(lambda x: x[1] > 0, null_counts)
print(list(cols_with_nulls))
#
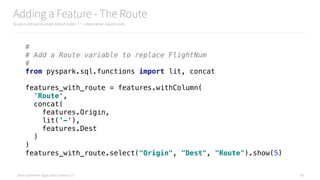
# Add a Route variable to replace FlightNum
#
from pyspark.sql.functions import lit, concat
features_with_route = features.withColumn(
'Route',
concat(
features.Origin,
lit('-'),
features.Dest
)
)
features_with_route.show(6)
#
# Use pysmark.ml.feature.Bucketizer to bucketize ArrDelay into on-time, slightly late, very late (0, 1, 2)
#
from pyspark.ml.feature import Bucketizer
# Setup the Bucketizer
splits = [-float("inf"), -15.0, 0, 30.0, float("inf")]
arrival_bucketizer = Bucketizer(
splits=splits,
inputCol="ArrDelay",
outputCol="ArrDelayBucket"
)
# Save the bucketizer
arrival_bucketizer_path = "{}/models/arrival_bucketizer_2.0.bin".format(base_path)
arrival_bucketizer.write().overwrite().save(arrival_bucketizer_path)
# Apply the bucketizer
ml_bucketized_features = arrival_bucketizer.transform(features_with_route)
ml_bucketized_features.select("ArrDelay", "ArrDelayBucket").show()
#
# Extract features tools in with pyspark.ml.feature
#
from pyspark.ml.feature import StringIndexer, VectorAssembler
# Turn category fields into indexes
for column in ["Carrier", "Origin", "Dest", "Route"]:
string_indexer = StringIndexer(
inputCol=column,
outputCol=column + "_index"
)
string_indexer_model = string_indexer.fit(ml_bucketized_features)
ml_bucketized_features = string_indexer_model.transform(ml_bucketized_features)
# Drop the original column
ml_bucketized_features = ml_bucketized_features.drop(column)
# Save the pipeline model
string_indexer_output_path = "{}/models/string_indexer_model_{}.bin".format(
base_path,
column
)
string_indexer_model.write().overwrite().save(string_indexer_output_path)
# Combine continuous, numeric fields with indexes of nominal ones
# ...into one feature vector
numeric_columns = [
"DepDelay", "Distance",
"DayOfMonth", "DayOfWeek",
"DayOfYear"]
index_columns = ["Carrier_index", "Origin_index",
"Dest_index", "Route_index"]
vector_assembler = VectorAssembler(
inputCols=numeric_columns + index_columns,
outputCol="Features_vec"
)
final_vectorized_features = vector_assembler.transform(ml_bucketized_features)
# Save the numeric vector assembler
vector_assembler_path = "{}/models/numeric_vector_assembler.bin".format(base_path)
vector_assembler.write().overwrite().save(vector_assembler_path)
# Drop the index columns
for column in index_columns:
final_vectorized_features = final_vectorized_features.drop(column)
# Inspect the finalized features
final_vectorized_features.show()
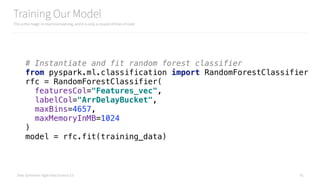
# Instantiate and fit random forest classifier on all the data
from pyspark.ml.classification import RandomForestClassifier
rfc = RandomForestClassifier(
featuresCol="Features_vec",
labelCol="ArrDelayBucket",
predictionCol="Prediction",
maxBins=4657,
maxMemoryInMB=1024
)
model = rfc.fit(final_vectorized_features)
# Save the new model over the old one
model_output_path = "{}/models/spark_random_forest_classifier.flight_delays.5.0.bin".format(
base_path
)
model.write().overwrite().save(model_output_path)
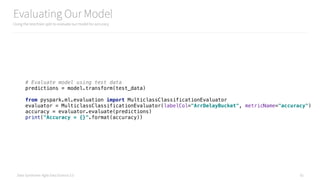
# Evaluate model using test data
predictions = model.transform(final_vectorized_features)
from pyspark.ml.evaluation import MulticlassClassificationEvaluator
evaluator = MulticlassClassificationEvaluator(
predictionCol="Prediction",
labelCol="ArrDelayBucket",
metricName="accuracy"
)
accuracy = evaluator.evaluate(predictions)
print("Accuracy = {}".format(accuracy))
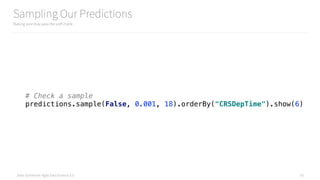
# Check the distribution of predictions
predictions.groupBy("Prediction").count().show()
# Check a sample
predictions.sample(False, 0.001, 18).orderBy("CRSDepTime").show(6)
if __name__ == "__main__":
main(sys.argv[1])](https://image.slidesharecdn.com/introductiontopyspark-170216005456/85/Introduction-to-PySpark-53-320.jpg)
![Data Syndrome: Agile Data Science 2.0
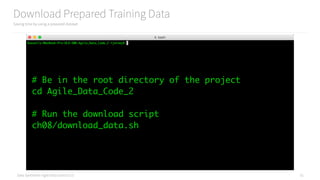
Loading Our Training Data
Loading our data as a DataFrame to use the Spark ML APIs
54
from pyspark.sql.types import StringType, IntegerType, FloatType, DoubleType, DateType, TimestampType
from pyspark.sql.types import StructType, StructField
from pyspark.sql.functions import udf
schema = StructType([
StructField("ArrDelay", DoubleType(), True), # "ArrDelay":5.0
StructField("CRSArrTime", TimestampType(), True), # "CRSArrTime":"2015-12-31T03:20:00.000-08:00"
StructField("CRSDepTime", TimestampType(), True), # "CRSDepTime":"2015-12-31T03:05:00.000-08:00"
StructField("Carrier", StringType(), True), # "Carrier":"WN"
StructField("DayOfMonth", IntegerType(), True), # "DayOfMonth":31
StructField("DayOfWeek", IntegerType(), True), # "DayOfWeek":4
StructField("DayOfYear", IntegerType(), True), # "DayOfYear":365
StructField("DepDelay", DoubleType(), True), # "DepDelay":14.0
StructField("Dest", StringType(), True), # "Dest":"SAN"
StructField("Distance", DoubleType(), True), # "Distance":368.0
StructField("FlightDate", DateType(), True), # "FlightDate":"2015-12-30T16:00:00.000-08:00"
StructField("FlightNum", StringType(), True), # "FlightNum":"6109"
StructField("Origin", StringType(), True), # "Origin":"TUS"
])
features = spark.read.json(
"data/simple_flight_delay_features.jsonl.bz2",
schema=schema
)
features.first()](https://image.slidesharecdn.com/introductiontopyspark-170216005456/85/Introduction-to-PySpark-54-320.jpg)
![Data Syndrome: Agile Data Science 2.0
Checking the Data for Nulls
Nulls will cause problems hereafter, so detect and address them first
55
#
# Check for nulls in features before using Spark ML
#
null_counts = [(column, features.where(features[column].isNull()).count()) for column in features.columns]
cols_with_nulls = filter(lambda x: x[1] > 0, null_counts)
print(list(cols_with_nulls))](https://image.slidesharecdn.com/introductiontopyspark-170216005456/85/Introduction-to-PySpark-55-320.jpg)
![Data Syndrome: Agile Data Science 2.0
Bucketizing ArrDelay into ArrDelayBucket
We can’t classify a continuous variable, so we must bucketize it to make it nominal/categorical
57
#
# Use pysmark.ml.feature.Bucketizer to bucketize ArrDelay
#
from pyspark.ml.feature import Bucketizer
splits = [-float("inf"), -15.0, 0, 30.0, float("inf")]
bucketizer = Bucketizer(
splits=splits,
inputCol="ArrDelay",
outputCol="ArrDelayBucket"
)
ml_bucketized_features = bucketizer.transform(features_with_route)
# Check the buckets out
ml_bucketized_features.select("ArrDelay", "ArrDelayBucket").show()](https://image.slidesharecdn.com/introductiontopyspark-170216005456/85/Introduction-to-PySpark-57-320.jpg)
![Data Syndrome: Agile Data Science 2.0
Indexing String Columns into Numeric Columns
Nominal/categorical/string columns need to be made numeric before we can vectorize them
58
#
# Extract features tools in with pyspark.ml.feature
#
from pyspark.ml.feature import StringIndexer, VectorAssembler
# Turn category fields into categoric feature vectors, then drop intermediate fields
for column in ["Carrier", "DayOfMonth", "DayOfWeek", "DayOfYear",
"Origin", "Dest", "Route"]:
string_indexer = StringIndexer(
inputCol=column,
outputCol=column + "_index"
)
ml_bucketized_features = string_indexer.fit(ml_bucketized_features)
.transform(ml_bucketized_features)
# Check out the indexes
ml_bucketized_features.show(6)](https://image.slidesharecdn.com/introductiontopyspark-170216005456/85/Introduction-to-PySpark-58-320.jpg)
![Data Syndrome: Agile Data Science 2.0
Combining Numeric and Indexed Fields into One Vector
Our classifier needs a single field, so we combine all our numeric fields into one feature vector
59
# Handle continuous, numeric fields by combining them into one feature vector
numeric_columns = ["DepDelay", "Distance"]
index_columns = ["Carrier_index", "DayOfMonth_index",
"DayOfWeek_index", "DayOfYear_index", "Origin_index",
"Origin_index", "Dest_index", "Route_index"]
vector_assembler = VectorAssembler(
inputCols=numeric_columns + index_columns,
outputCol="Features_vec"
)
final_vectorized_features = vector_assembler.transform(ml_bucketized_features)
# Drop the index columns
for column in index_columns:
final_vectorized_features = final_vectorized_features.drop(column)
# Check out the features
final_vectorized_features.show()](https://image.slidesharecdn.com/introductiontopyspark-170216005456/85/Introduction-to-PySpark-59-320.jpg)
![Data Syndrome: Agile Data Science 2.0
Splitting our Data in a Test/Train Split
We need to split our data to evaluate the performance of our classifier
60
#
# Cross validate, train and evaluate classifier
#
# Test/train split
training_data, test_data = final_vectorized_features.randomSplit([0.7, 0.3])](https://image.slidesharecdn.com/introductiontopyspark-170216005456/85/Introduction-to-PySpark-60-320.jpg)
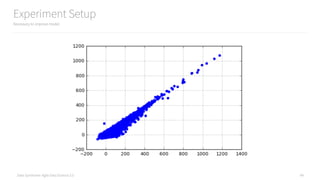
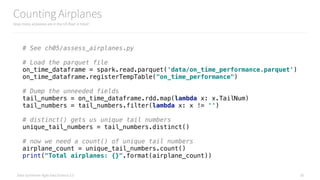
![Data Syndrome: Agile Data Science 2.0 65
155 additional lines to setup an experiment
and add 3 new features to improvement the model
ch09/improve_spark_mllib_model.py
345 L.O.C.
# !/usr/bin/env python
import sys, os, re
import json
import datetime, iso8601
from tabulate import tabulate
# Pass date and base path to main() from airflow
def main(base_path):
APP_NAME = "train_spark_mllib_model.py"
# If there is no SparkSession, create the environment
try:
sc and spark
except NameError as e:
import findspark
findspark.init()
import pyspark
import pyspark.sql
sc = pyspark.SparkContext()
spark = pyspark.sql.SparkSession(sc).builder.appName(APP_NAME).getOrCreate()
#
# {
# "ArrDelay":5.0,"CRSArrTime":"2015-12-31T03:20:00.000-08:00","CRSDepTime":"2015-12-31T03:05:00.000-08:00",
# "Carrier":"WN","DayOfMonth":31,"DayOfWeek":4,"DayOfYear":365,"DepDelay":14.0,"Dest":"SAN","Distance":368.0,
# "FlightDate":"2015-12-30T16:00:00.000-08:00","FlightNum":"6109","Origin":"TUS"
# }
#
from pyspark.sql.types import StringType, IntegerType, FloatType, DoubleType, DateType, TimestampType
from pyspark.sql.types import StructType, StructField
from pyspark.sql.functions import udf
schema = StructType([
StructField("ArrDelay", DoubleType(), True), # "ArrDelay":5.0
StructField("CRSArrTime", TimestampType(), True), # "CRSArrTime":"2015-12-31T03:20:00.000-08:00"
StructField("CRSDepTime", TimestampType(), True), # "CRSDepTime":"2015-12-31T03:05:00.000-08:00"
StructField("Carrier", StringType(), True), # "Carrier":"WN"
StructField("DayOfMonth", IntegerType(), True), # "DayOfMonth":31
StructField("DayOfWeek", IntegerType(), True), # "DayOfWeek":4
StructField("DayOfYear", IntegerType(), True), # "DayOfYear":365
StructField("DepDelay", DoubleType(), True), # "DepDelay":14.0
StructField("Dest", StringType(), True), # "Dest":"SAN"
StructField("Distance", DoubleType(), True), # "Distance":368.0
StructField("FlightDate", DateType(), True), # "FlightDate":"2015-12-30T16:00:00.000-08:00"
StructField("FlightNum", StringType(), True), # "FlightNum":"6109"
StructField("Origin", StringType(), True), # "Origin":"TUS"
])
input_path = "{}/data/simple_flight_delay_features.json".format(
base_path
)
features = spark.read.json(input_path, schema=schema)
features.first()
#
# Add a Route variable to replace FlightNum
#
from pyspark.sql.functions import lit, concat
features_with_route = features.withColumn(
'Route',
concat(
features.Origin,
lit('-'),
features.Dest
)
)
features_with_route.show(6)
#
# Add the hour of day of scheduled arrival/departure
#
from pyspark.sql.functions import hour
features_with_hour = features_with_route.withColumn(
"CRSDepHourOfDay",
hour(features.CRSDepTime)
)
features_with_hour = features_with_hour.withColumn(
"CRSArrHourOfDay",
hour(features.CRSArrTime)
)
features_with_hour.select("CRSDepTime", "CRSDepHourOfDay", "CRSArrTime", "CRSArrHourOfDay").show()
#
# Use pysmark.ml.feature.Bucketizer to bucketize ArrDelay into on-time, slightly late, very late (0, 1, 2)
#
from pyspark.ml.feature import Bucketizer
# Setup the Bucketizer
splits = [-float("inf"), -15.0, 0, 30.0, float("inf")]
arrival_bucketizer = Bucketizer(
splits=splits,
inputCol="ArrDelay",
outputCol="ArrDelayBucket"
)
# Save the model
arrival_bucketizer_path = "{}/models/arrival_bucketizer_2.0.bin".format(base_path)
arrival_bucketizer.write().overwrite().save(arrival_bucketizer_path)
# Apply the model
ml_bucketized_features = arrival_bucketizer.transform(features_with_hour)
ml_bucketized_features.select("ArrDelay", "ArrDelayBucket").show()
#
# Extract features tools in with pyspark.ml.feature
#
from pyspark.ml.feature import StringIndexer, VectorAssembler
# Turn category fields into indexes
for column in ["Carrier", "Origin", "Dest", "Route"]:
string_indexer = StringIndexer(
inputCol=column,
outputCol=column + "_index"
)
string_indexer_model = string_indexer.fit(ml_bucketized_features)
ml_bucketized_features = string_indexer_model.transform(ml_bucketized_features)
# Save the pipeline model
string_indexer_output_path = "{}/models/string_indexer_model_3.0.{}.bin".format(
base_path,
column
)
string_indexer_model.write().overwrite().save(string_indexer_output_path)
# Combine continuous, numeric fields with indexes of nominal ones
# ...into one feature vector
numeric_columns = [
"DepDelay", "Distance",
"DayOfMonth", "DayOfWeek",
"DayOfYear", "CRSDepHourOfDay",
"CRSArrHourOfDay"]
index_columns = ["Carrier_index", "Origin_index",
"Dest_index", "Route_index"]
vector_assembler = VectorAssembler(
inputCols=numeric_columns + index_columns,
outputCol="Features_vec"
)
final_vectorized_features = vector_assembler.transform(ml_bucketized_features)
# Save the numeric vector assembler
vector_assembler_path = "{}/models/numeric_vector_assembler_3.0.bin".format(base_path)
vector_assembler.write().overwrite().save(vector_assembler_path)
# Drop the index columns
for column in index_columns:
final_vectorized_features = final_vectorized_features.drop(column)
# Inspect the finalized features
final_vectorized_features.show()
#
# Cross validate, train and evaluate classifier: loop 5 times for 4 metrics
#
from collections import defaultdict
scores = defaultdict(list)
feature_importances = defaultdict(list)
metric_names = ["accuracy", "weightedPrecision", "weightedRecall", "f1"]
split_count = 3
for i in range(1, split_count + 1):
print("nRun {} out of {} of test/train splits in cross validation...".format(
i,
split_count,
)
)
# Test/train split
training_data, test_data = final_vectorized_features.randomSplit([0.8, 0.2])
# Instantiate and fit random forest classifier on all the data
from pyspark.ml.classification import RandomForestClassifier
rfc = RandomForestClassifier(
featuresCol="Features_vec",
labelCol="ArrDelayBucket",
predictionCol="Prediction",
maxBins=4657,
)
model = rfc.fit(training_data)
# Save the new model over the old one
model_output_path = "{}/models/spark_random_forest_classifier.flight_delays.baseline.bin".format(
base_path
)
model.write().overwrite().save(model_output_path)
# Evaluate model using test data
predictions = model.transform(test_data)
# Evaluate this split's results for each metric
from pyspark.ml.evaluation import MulticlassClassificationEvaluator
for metric_name in metric_names:
evaluator = MulticlassClassificationEvaluator(
labelCol="ArrDelayBucket",
predictionCol="Prediction",
metricName=metric_name
)
score = evaluator.evaluate(predictions)
scores[metric_name].append(score)
print("{} = {}".format(metric_name, score))
#
# Collect feature importances
#
feature_names = vector_assembler.getInputCols()
feature_importance_list = model.featureImportances
for feature_name, feature_importance in zip(feature_names, feature_importance_list):
feature_importances[feature_name].append(feature_importance)
#
# Evaluate average and STD of each metric and print a table
#
import numpy as np
score_averages = defaultdict(float)
# Compute the table data
average_stds = [] # ha
for metric_name in metric_names:
metric_scores = scores[metric_name]
average_accuracy = sum(metric_scores) / len(metric_scores)
score_averages[metric_name] = average_accuracy
std_accuracy = np.std(metric_scores)
average_stds.append((metric_name, average_accuracy, std_accuracy))
# Print the table
print("nExperiment Log")
print("--------------")
print(tabulate(average_stds, headers=["Metric", "Average", "STD"]))
#
# Persist the score to a sccore log that exists between runs
#
import pickle
# Load the score log or initialize an empty one
try:
score_log_filename = "{}/models/score_log.pickle".format(base_path)
score_log = pickle.load(open(score_log_filename, "rb"))
if not isinstance(score_log, list):
score_log = []
except IOError:
score_log = []
# Compute the existing score log entry
score_log_entry = {metric_name: score_averages[metric_name] for metric_name in metric_names}
# Compute and display the change in score for each metric
try:
last_log = score_log[-1]
except (IndexError, TypeError, AttributeError):
last_log = score_log_entry
experiment_report = []
for metric_name in metric_names:
run_delta = score_log_entry[metric_name] - last_log[metric_name]
experiment_report.append((metric_name, run_delta))
print("nExperiment Report")
print("-----------------")
print(tabulate(experiment_report, headers=["Metric", "Score"]))
# Append the existing average scores to the log
score_log.append(score_log_entry)
# Persist the log for next run
pickle.dump(score_log, open(score_log_filename, "wb"))
#
# Analyze and report feature importance changes
#
# Compute averages for each feature
feature_importance_entry = defaultdict(float)
for feature_name, value_list in feature_importances.items():
average_importance = sum(value_list) / len(value_list)
feature_importance_entry[feature_name] = average_importance
# Sort the feature importances in descending order and print
import operator
sorted_feature_importances = sorted(
feature_importance_entry.items(),
key=operator.itemgetter(1),
reverse=True
)
print("nFeature Importances")
print("-------------------")
print(tabulate(sorted_feature_importances, headers=['Name', 'Importance']))
#
# Compare this run's feature importances with the previous run's
#
# Load the feature importance log or initialize an empty one
try:
feature_log_filename = "{}/models/feature_log.pickle".format(base_path)
feature_log = pickle.load(open(feature_log_filename, "rb"))
if not isinstance(feature_log, list):
feature_log = []
except IOError:
feature_log = []
# Compute and display the change in score for each feature
try:
last_feature_log = feature_log[-1]
except (IndexError, TypeError, AttributeError):
last_feature_log = defaultdict(float)
for feature_name, importance in feature_importance_entry.items():
last_feature_log[feature_name] = importance
# Compute the deltas
feature_deltas = {}
for feature_name in feature_importances.keys():
run_delta = feature_importance_entry[feature_name] - last_feature_log[feature_name]
feature_deltas[feature_name] = run_delta
# Sort feature deltas, biggest change first
import operator
sorted_feature_deltas = sorted(
feature_deltas.items(),
key=operator.itemgetter(1),
reverse=True
)
# Display sorted feature deltas
print("nFeature Importance Delta Report")
print("-------------------------------")
print(tabulate(sorted_feature_deltas, headers=["Feature", "Delta"]))
# Append the existing average deltas to the log
feature_log.append(feature_importance_entry)
# Persist the log for next run
pickle.dump(feature_log, open(feature_log_filename, "wb"))
if __name__ == "__main__":
main(sys.argv[1])](https://image.slidesharecdn.com/introductiontopyspark-170216005456/85/Introduction-to-PySpark-65-320.jpg)


The document is an introduction to using PySpark for analytics, authored by Russell Jurney, a seasoned data scientist. It covers core concepts of Spark, including its ecosystem, data processing using RDDs and DataFrames, real-time analytics, and visualizations, alongside various examples from an airline dataset. Additionally, it highlights resources for further learning and tools like Vagrant and AWS for setting up the development environment.