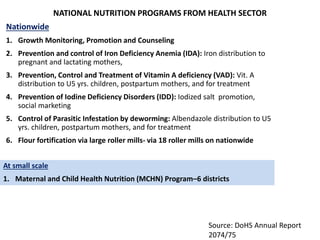
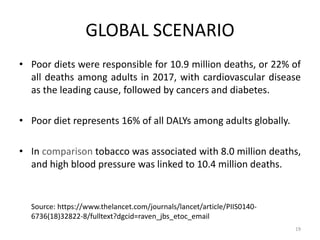
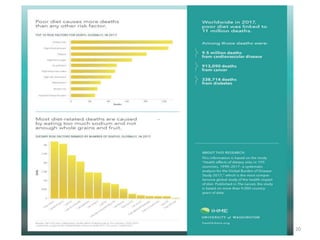
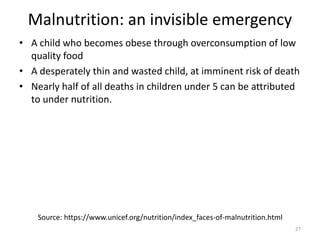
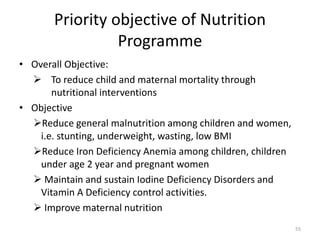
The document discusses the significance of nutrition, outlining its role in health and the consequences of poor nutrition, including various forms of malnutrition. It highlights global and national trends in nutrition, historical initiatives in Nepal, and the Sustainable Development Goals related to nutrition intervention. The national response to malnutrition in Nepal involves comprehensive programs aimed at reducing child and maternal mortality through improved nutritional strategies.


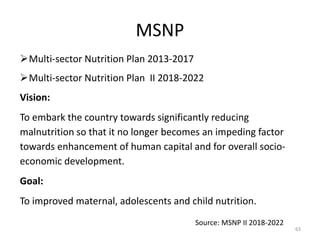
![Constitution of Nepal 2015
• wf/f#^ vfB ;DaGwLxs
-!_ k|To]s gful/snfO{vfB ;DaGwL xs x'g]5 .
-@_ k|To]s gful/snfO{vfBj:t'sf]cefjdf hLjghf]lvddf kg]{ cj:yfaf6
;'/lIftx'g]xs x'g]5 .
• wf/f-#(_ afnaflnsfsf]xs
-@_ k|To]s afnaflnsfnfO{kl/jf/ tyf /fHoaf6 lzIff,:jf:Yo, kfng
kf]if0f,plrt :ofxf/, v]ns"b, dgf]/~hg tyf ;jf{ËL0fJolQmTjljsf;sf]
xs x'g]5.
53](https://image.slidesharecdn.com/nutritionfinal-200124081202/85/Nutrition-final-52-320.jpg)
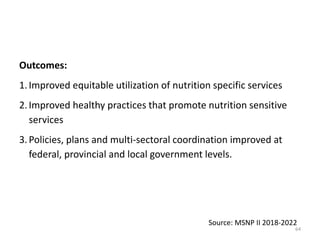
![k|hgg :jf:Yosf]clwsf/;DaGwdf Joj:yfug{ag]sf]
ljw]os
• k|;"lt labfsf] clwsf/ -bkmf !#_ M (* lbg tnaL ljbf tyf ck'u ePdf
:jf:YosdL{sf]k/fdz{adf]lhdyk Psdlxgftna;lxtsf]k|;'ltljbf
• ;/sf/L, u}/ ;/sf/L jf lghL ;+3 ;+:yfn] cfkmgf] sfo{nosf sfo{/t
dlxnfnfO{ lzz' hGd]sf] b'O{ jif{;Dd sfo{fno ;dodf cfdfsf] b'w v'jfpgsf
nflu cfjZosJoj:yfldnfpg'kg]{5.
• ;/sf/L, u}/ ;/sf/L jf lghL ;+3 ;+:yfdf sfo{/t k'?if sd{r/Lsf] kTgL ;'Ts]/L
x'g] ePdf To:tf] sd{rf/Ln] ;'Ts]/L x'g' cl3 jf kl5 kfl/>lds ;lxtsf] kGw|
lbgk|;'lt:ofxf/ljbfkfpg]5.
54](https://image.slidesharecdn.com/nutritionfinal-200124081202/85/Nutrition-final-53-320.jpg)
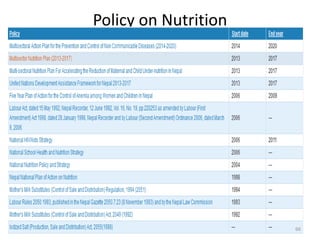
![Nepal Health Sector Strategy (NHSS
2015-2020)
• NHSS emphasizes the better implementation of the
nutrition interventions included in MSNP and other
plan, policies and strategies.
• NHSS Target by 2020
• Goal 2: Reduce under-five mortality to below 28%
(undernutrition contributes to for 45% of U5 mortality)
• Goal 5: Reduce stunting among children under 5 to at
least below 31%.
• Goal 6: Reduce prevalence of chronic energy deficiency
or thinness among women aged 15-49 years, [BMI less
than 18.5] to below 12%
58](https://image.slidesharecdn.com/nutritionfinal-200124081202/85/Nutrition-final-57-320.jpg)