Download as PDF, PPTX
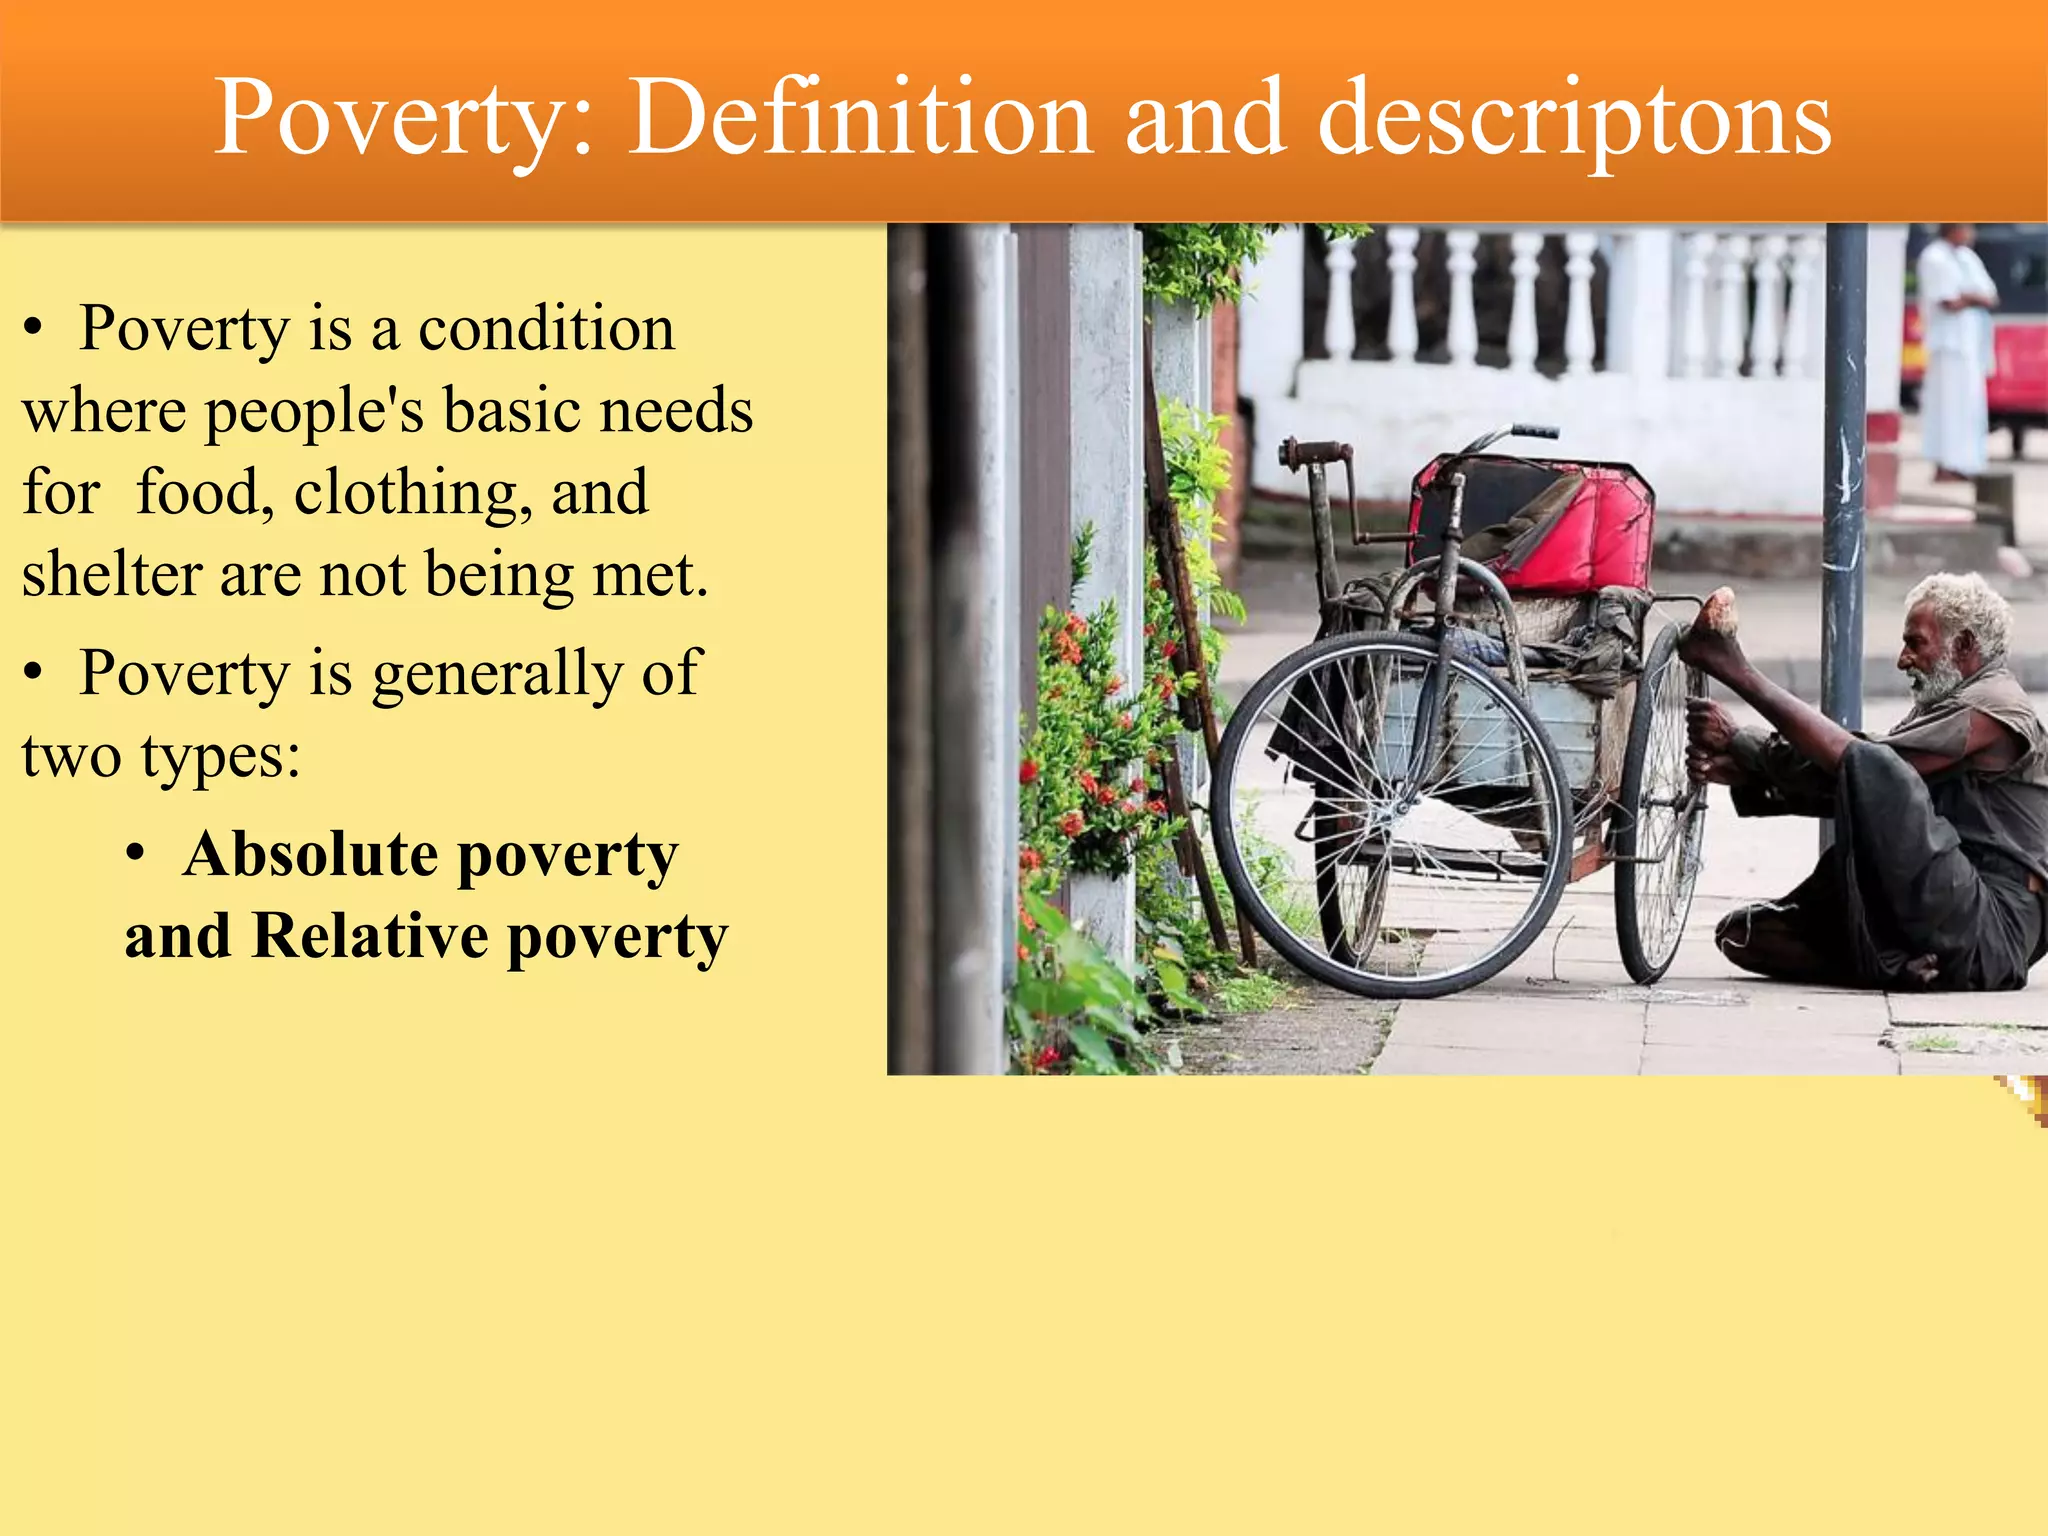

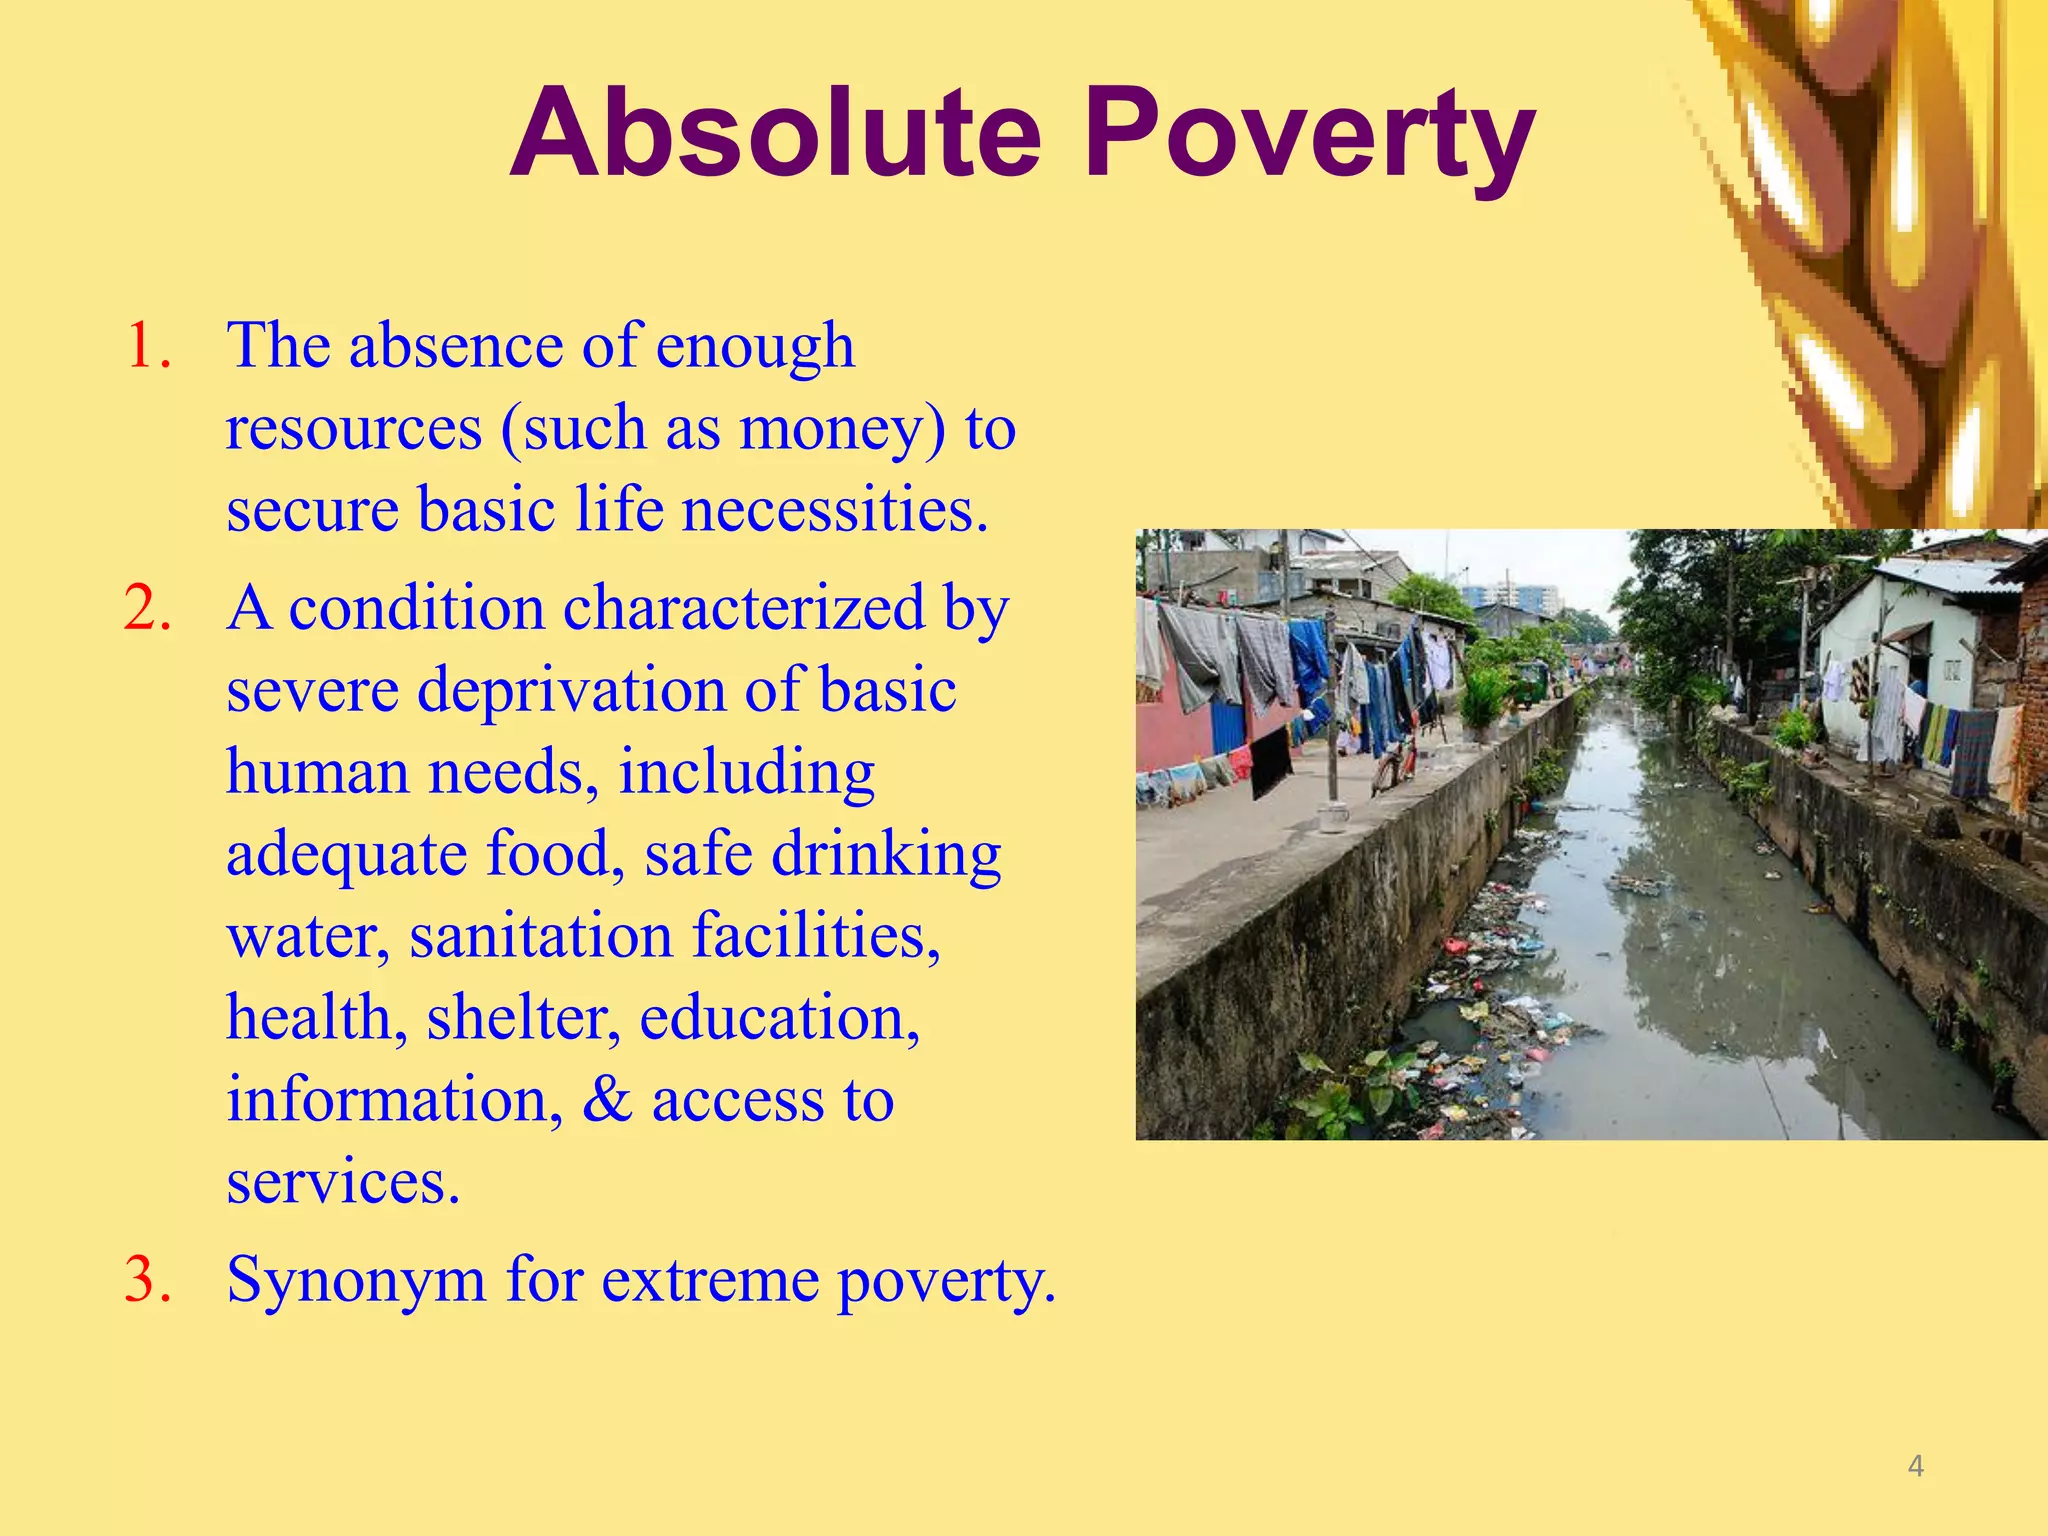


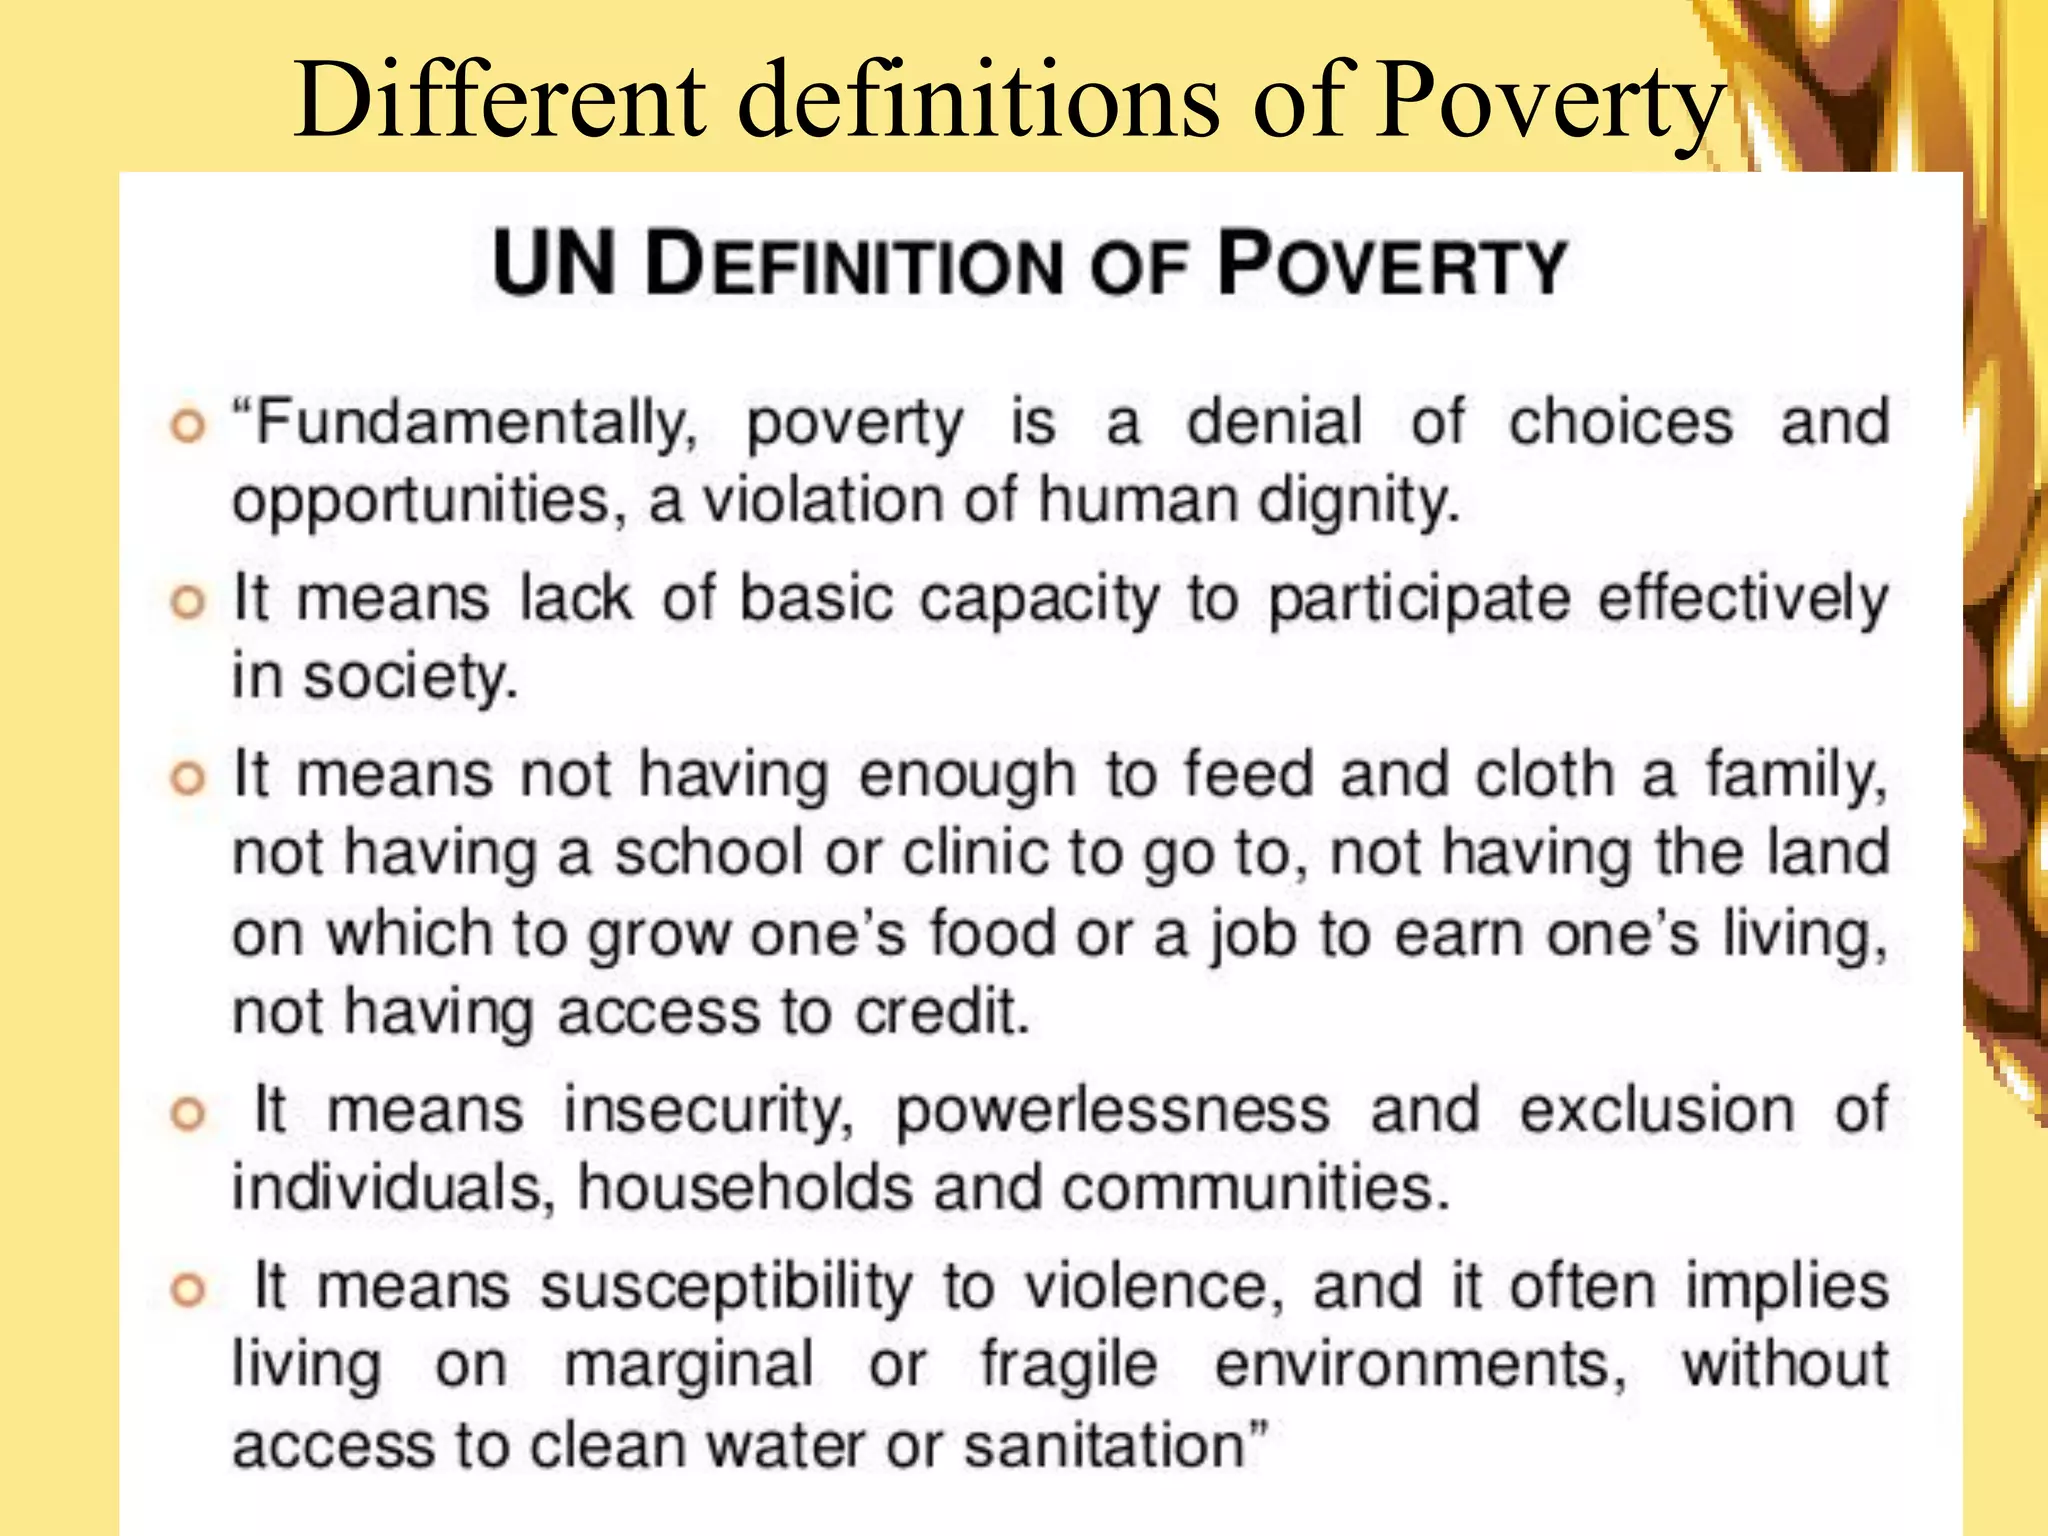


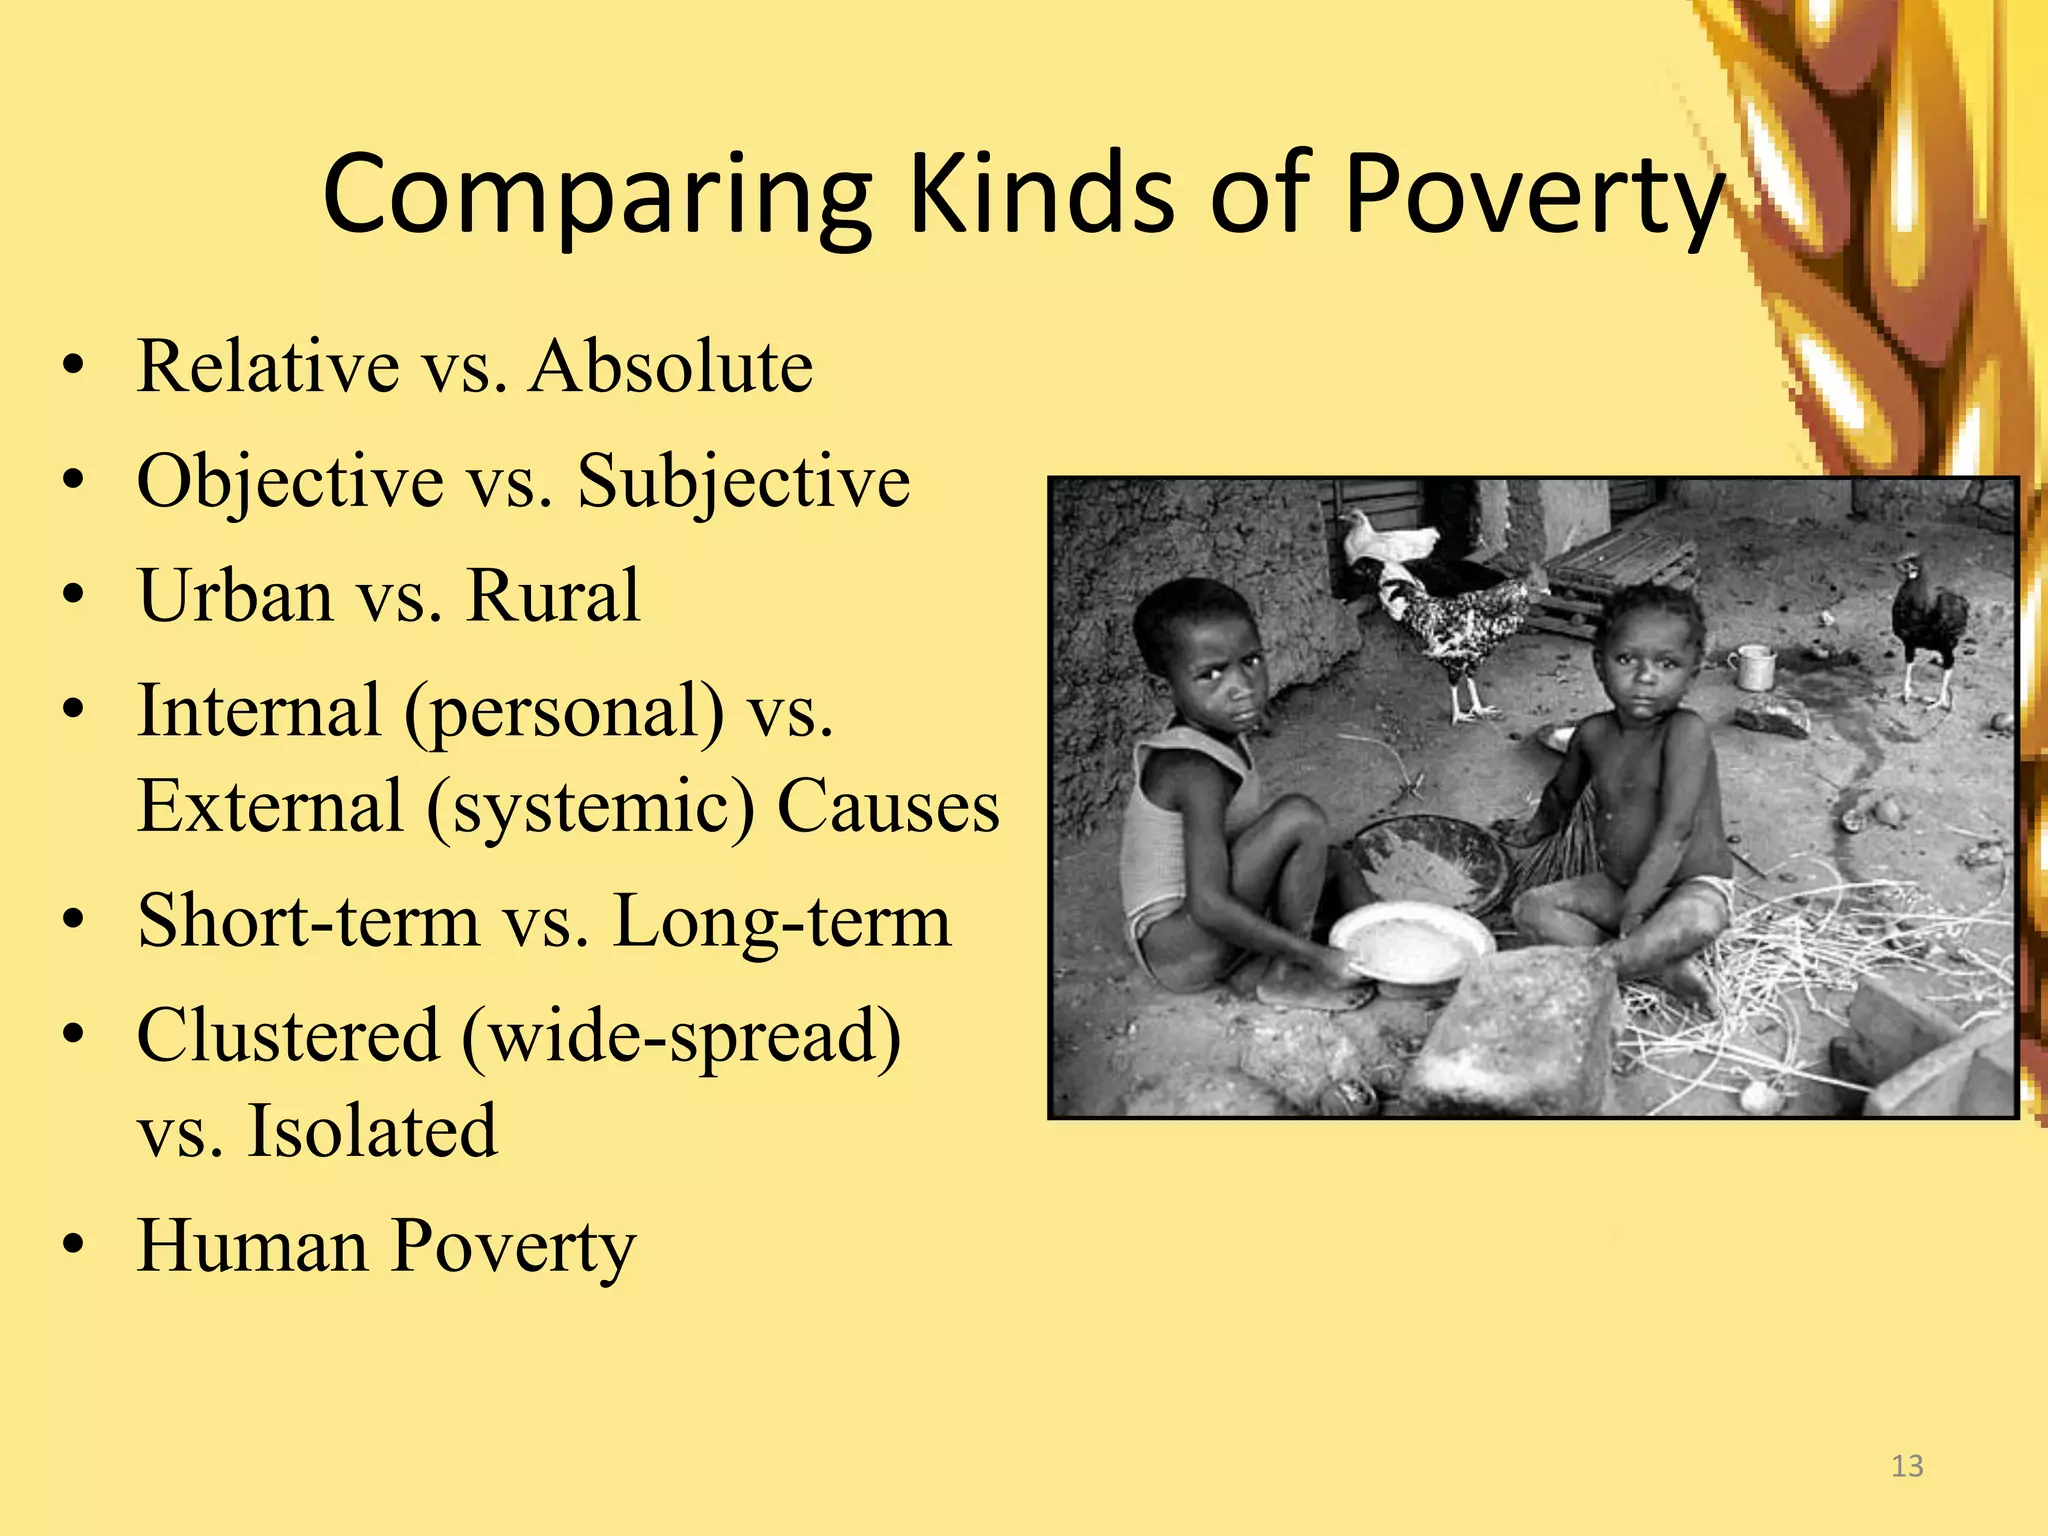

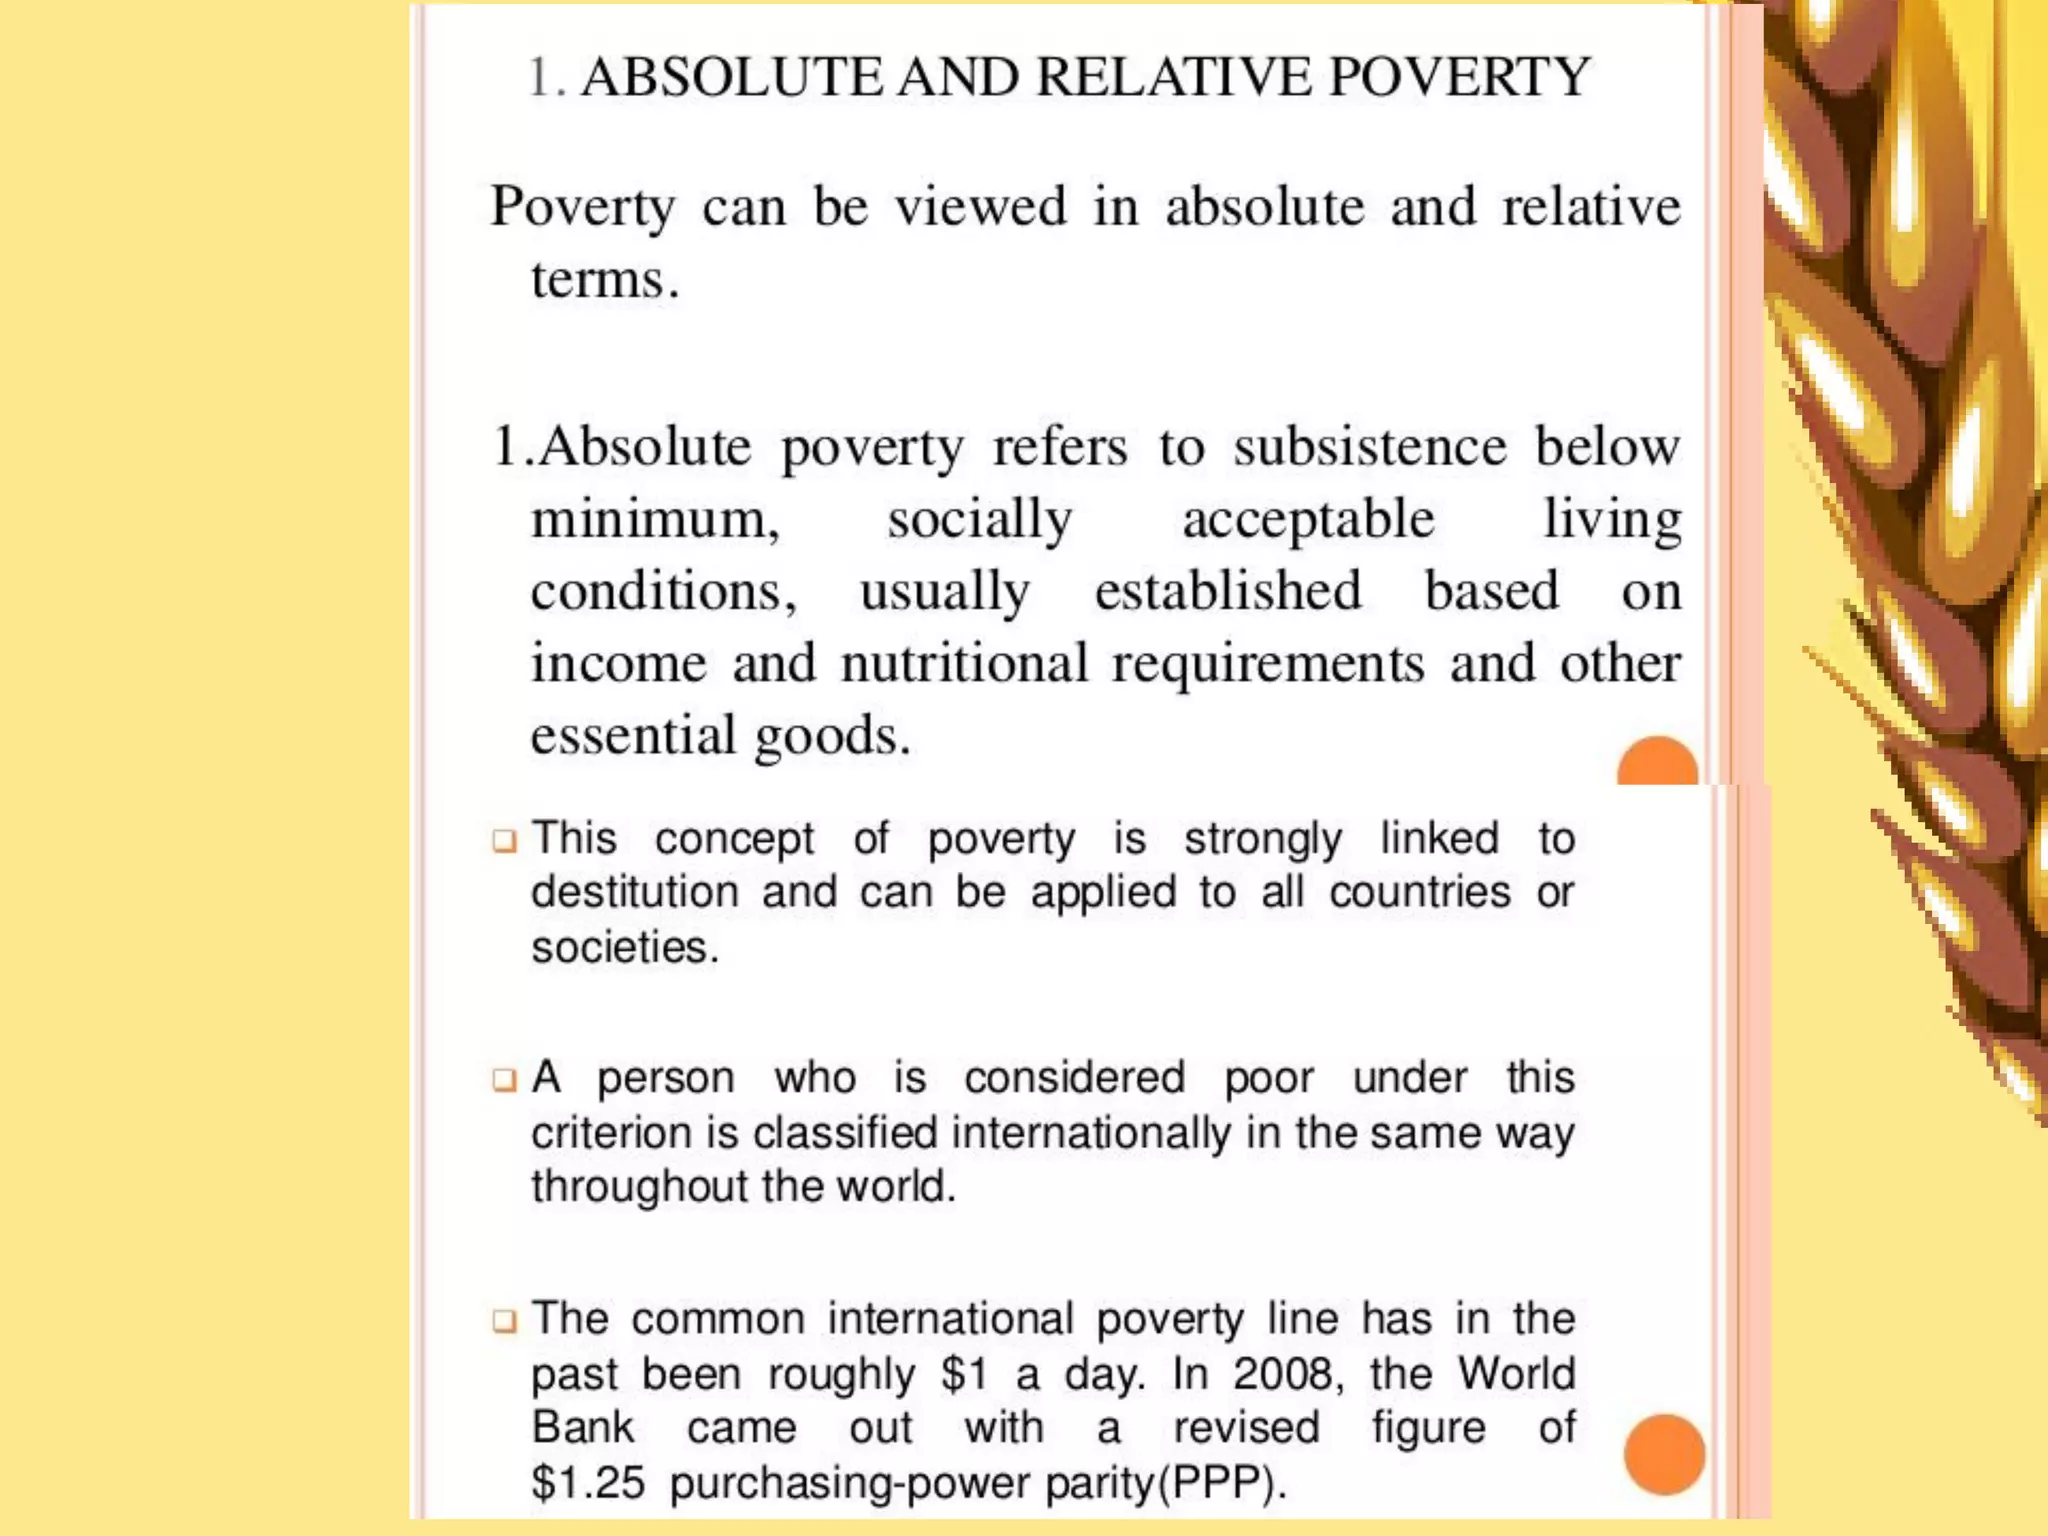
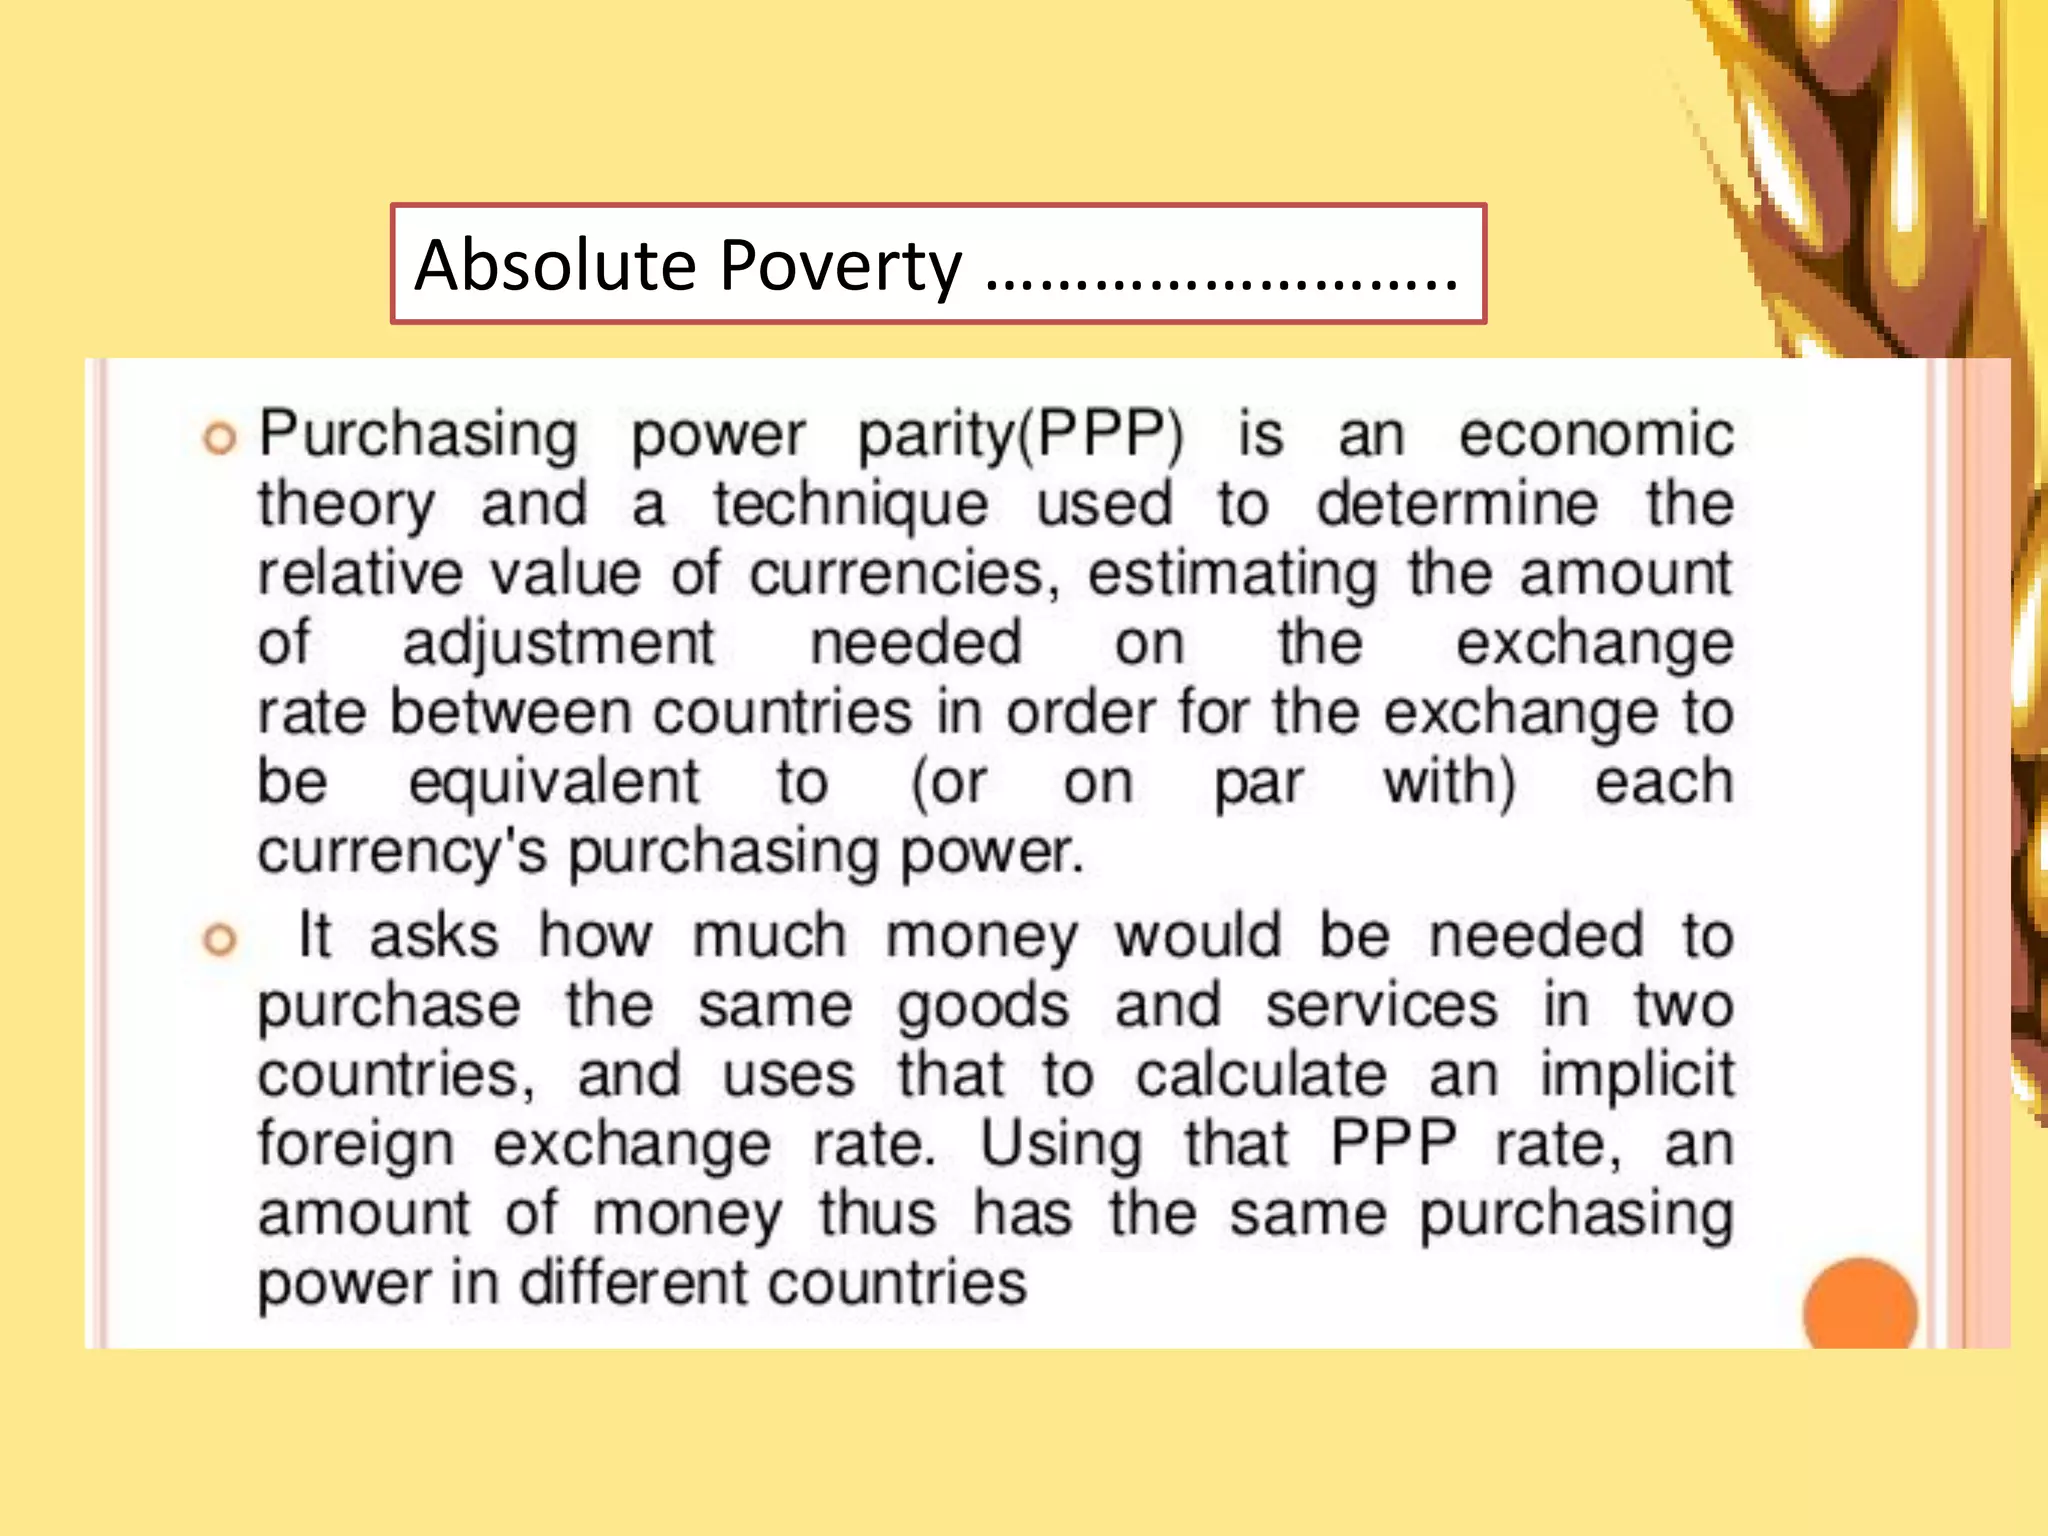
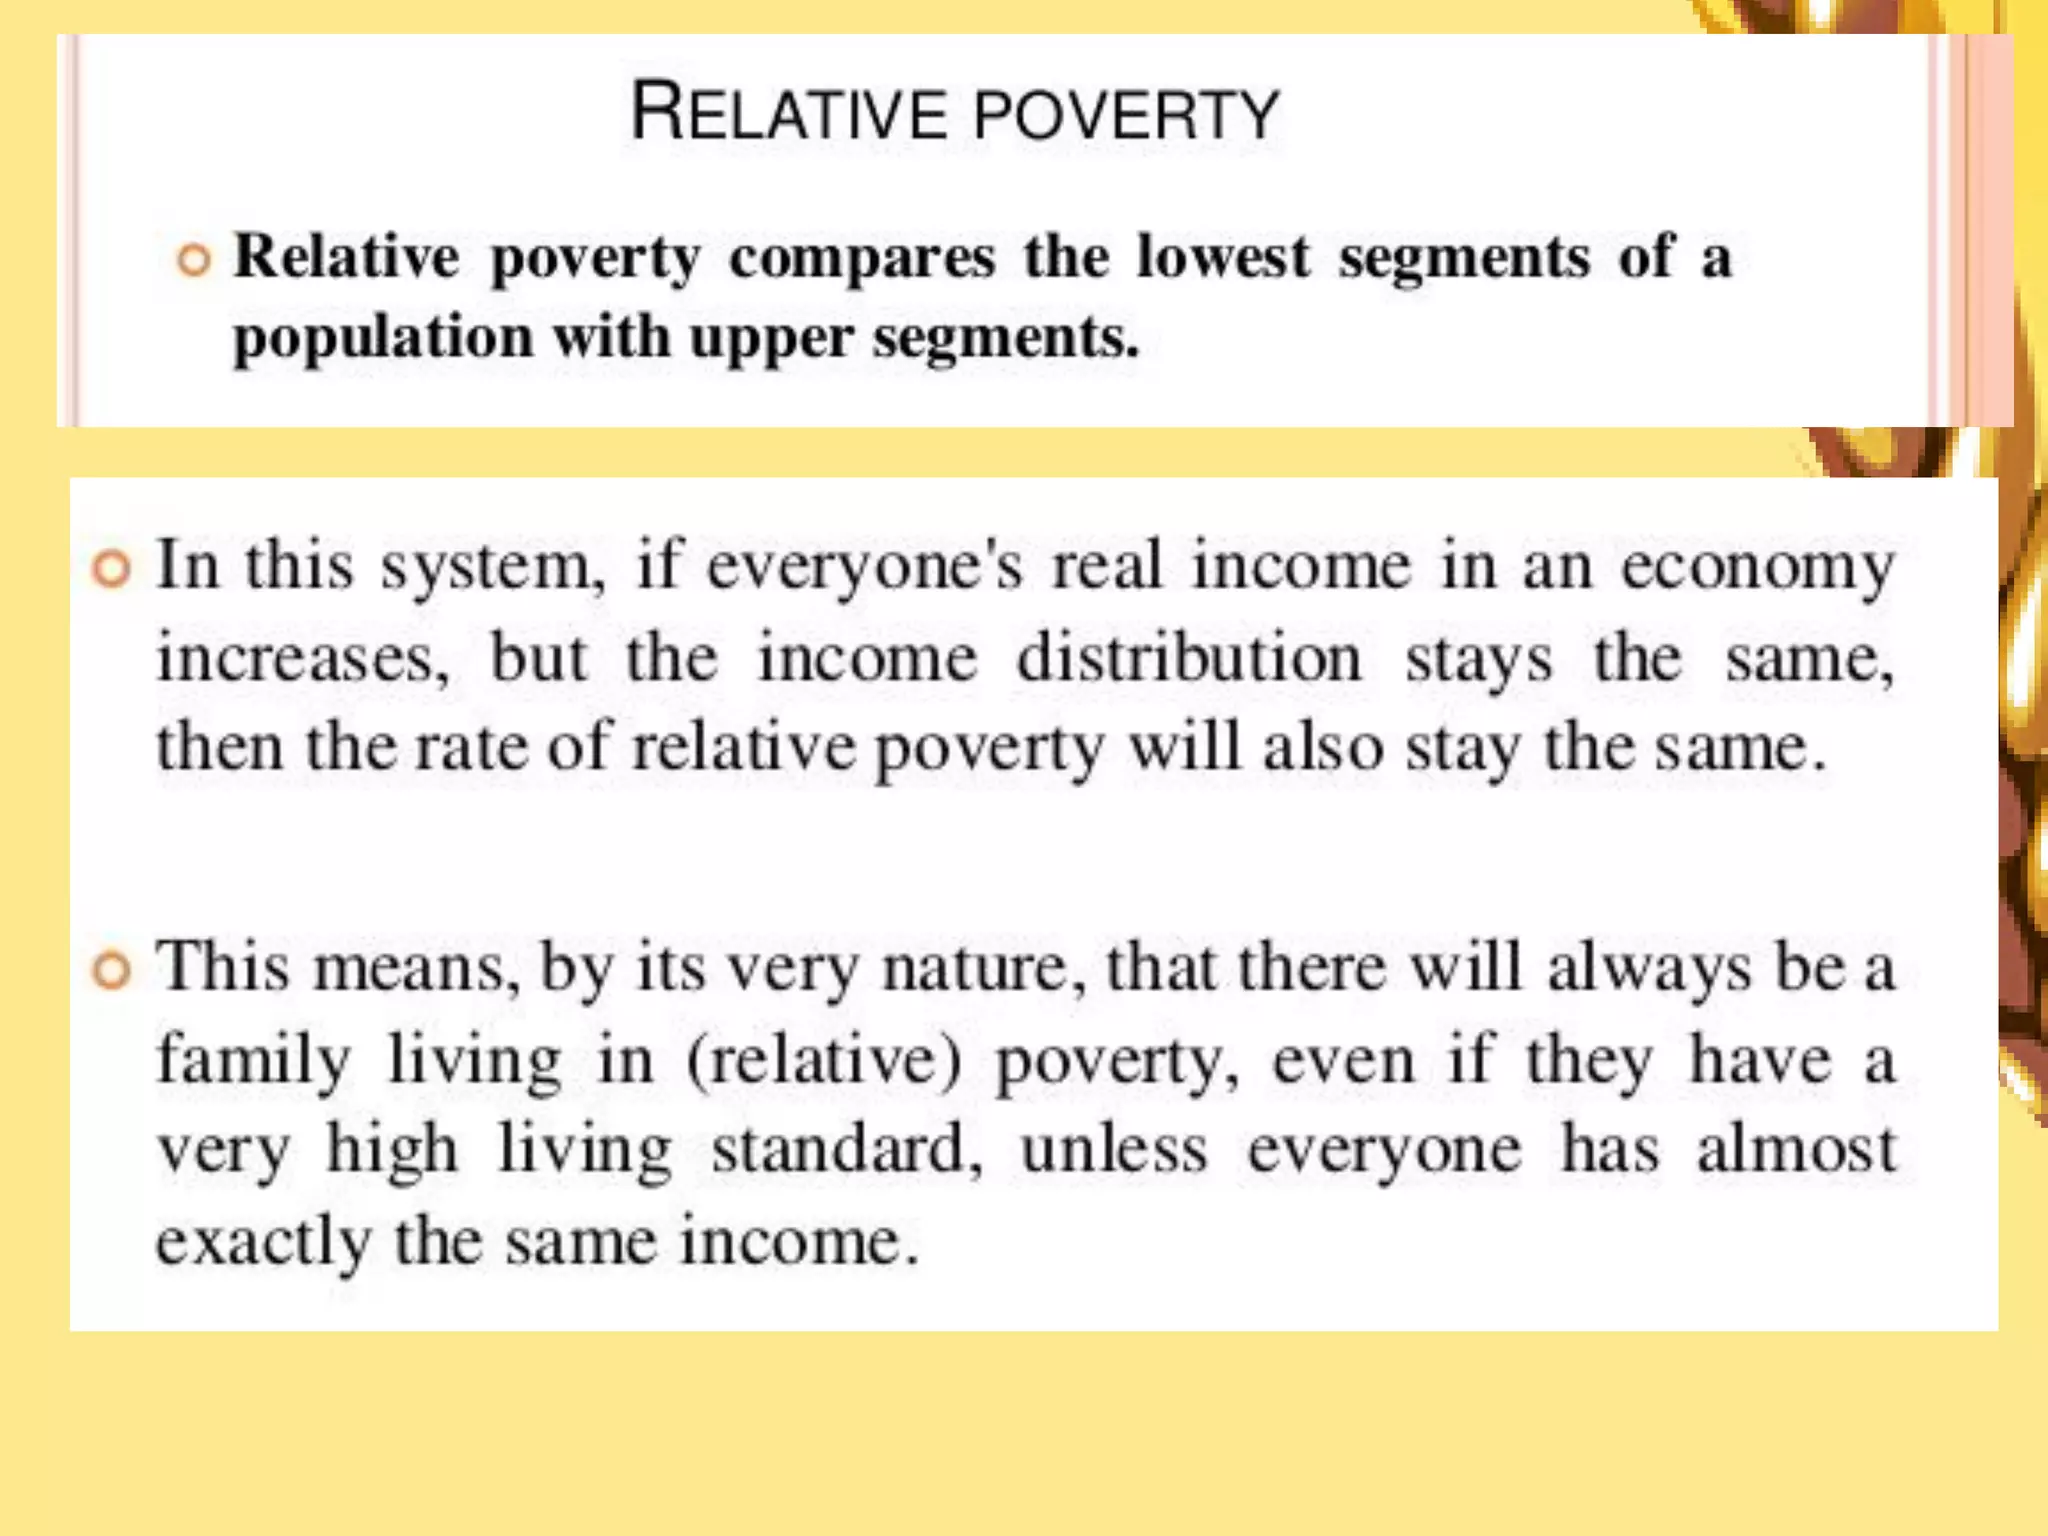
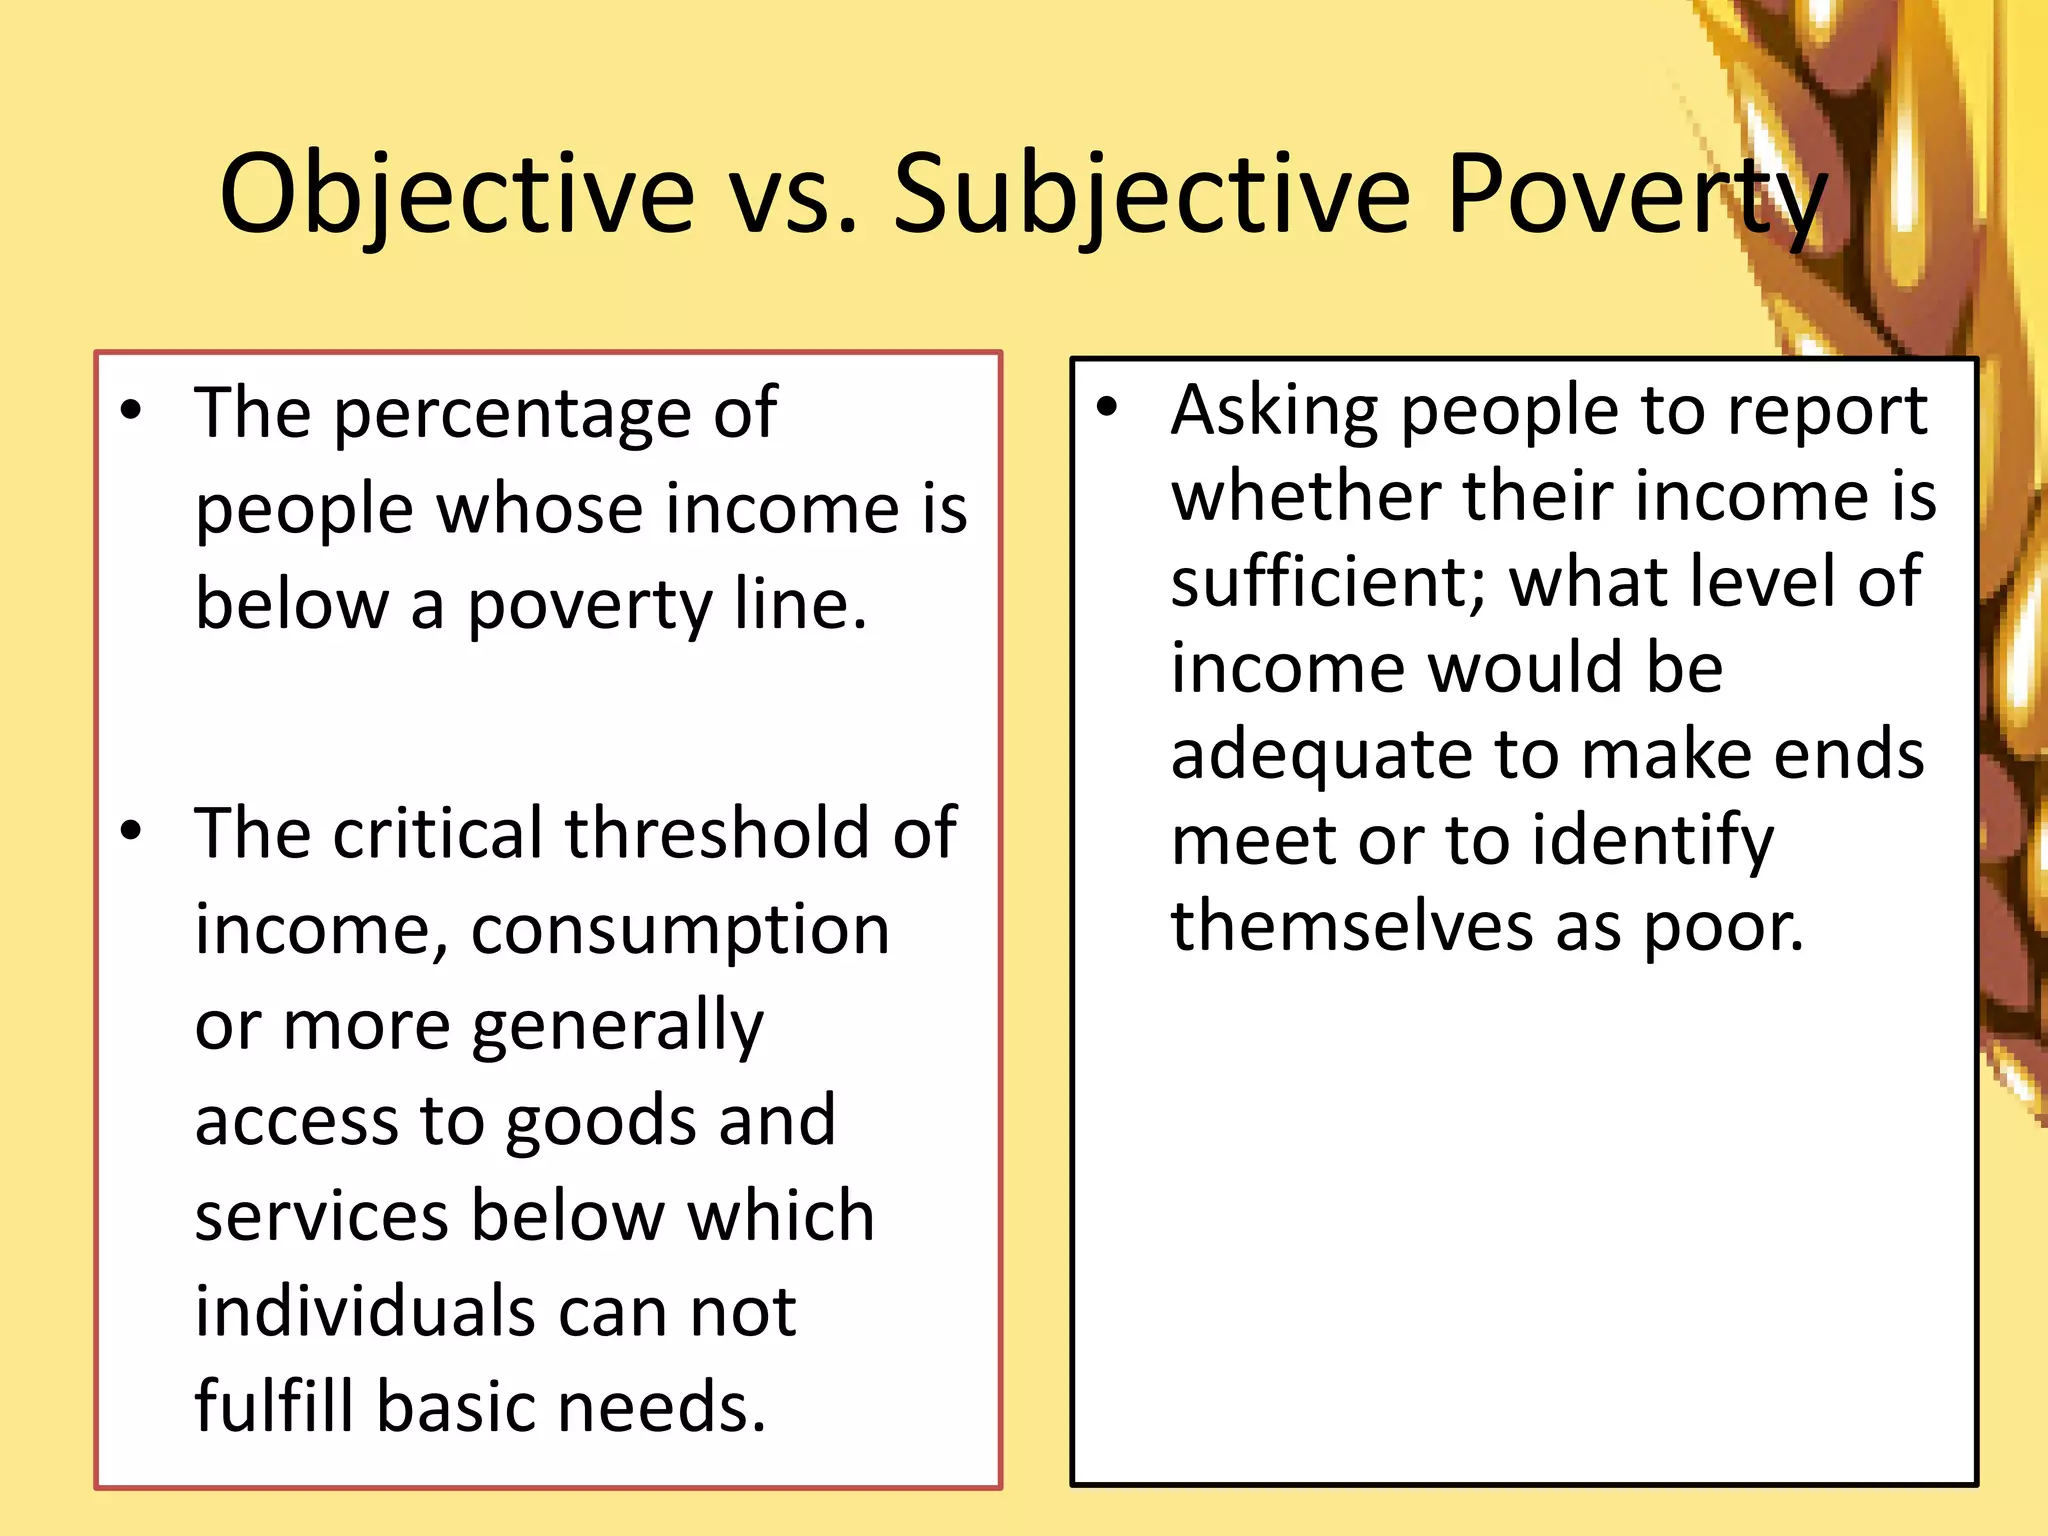
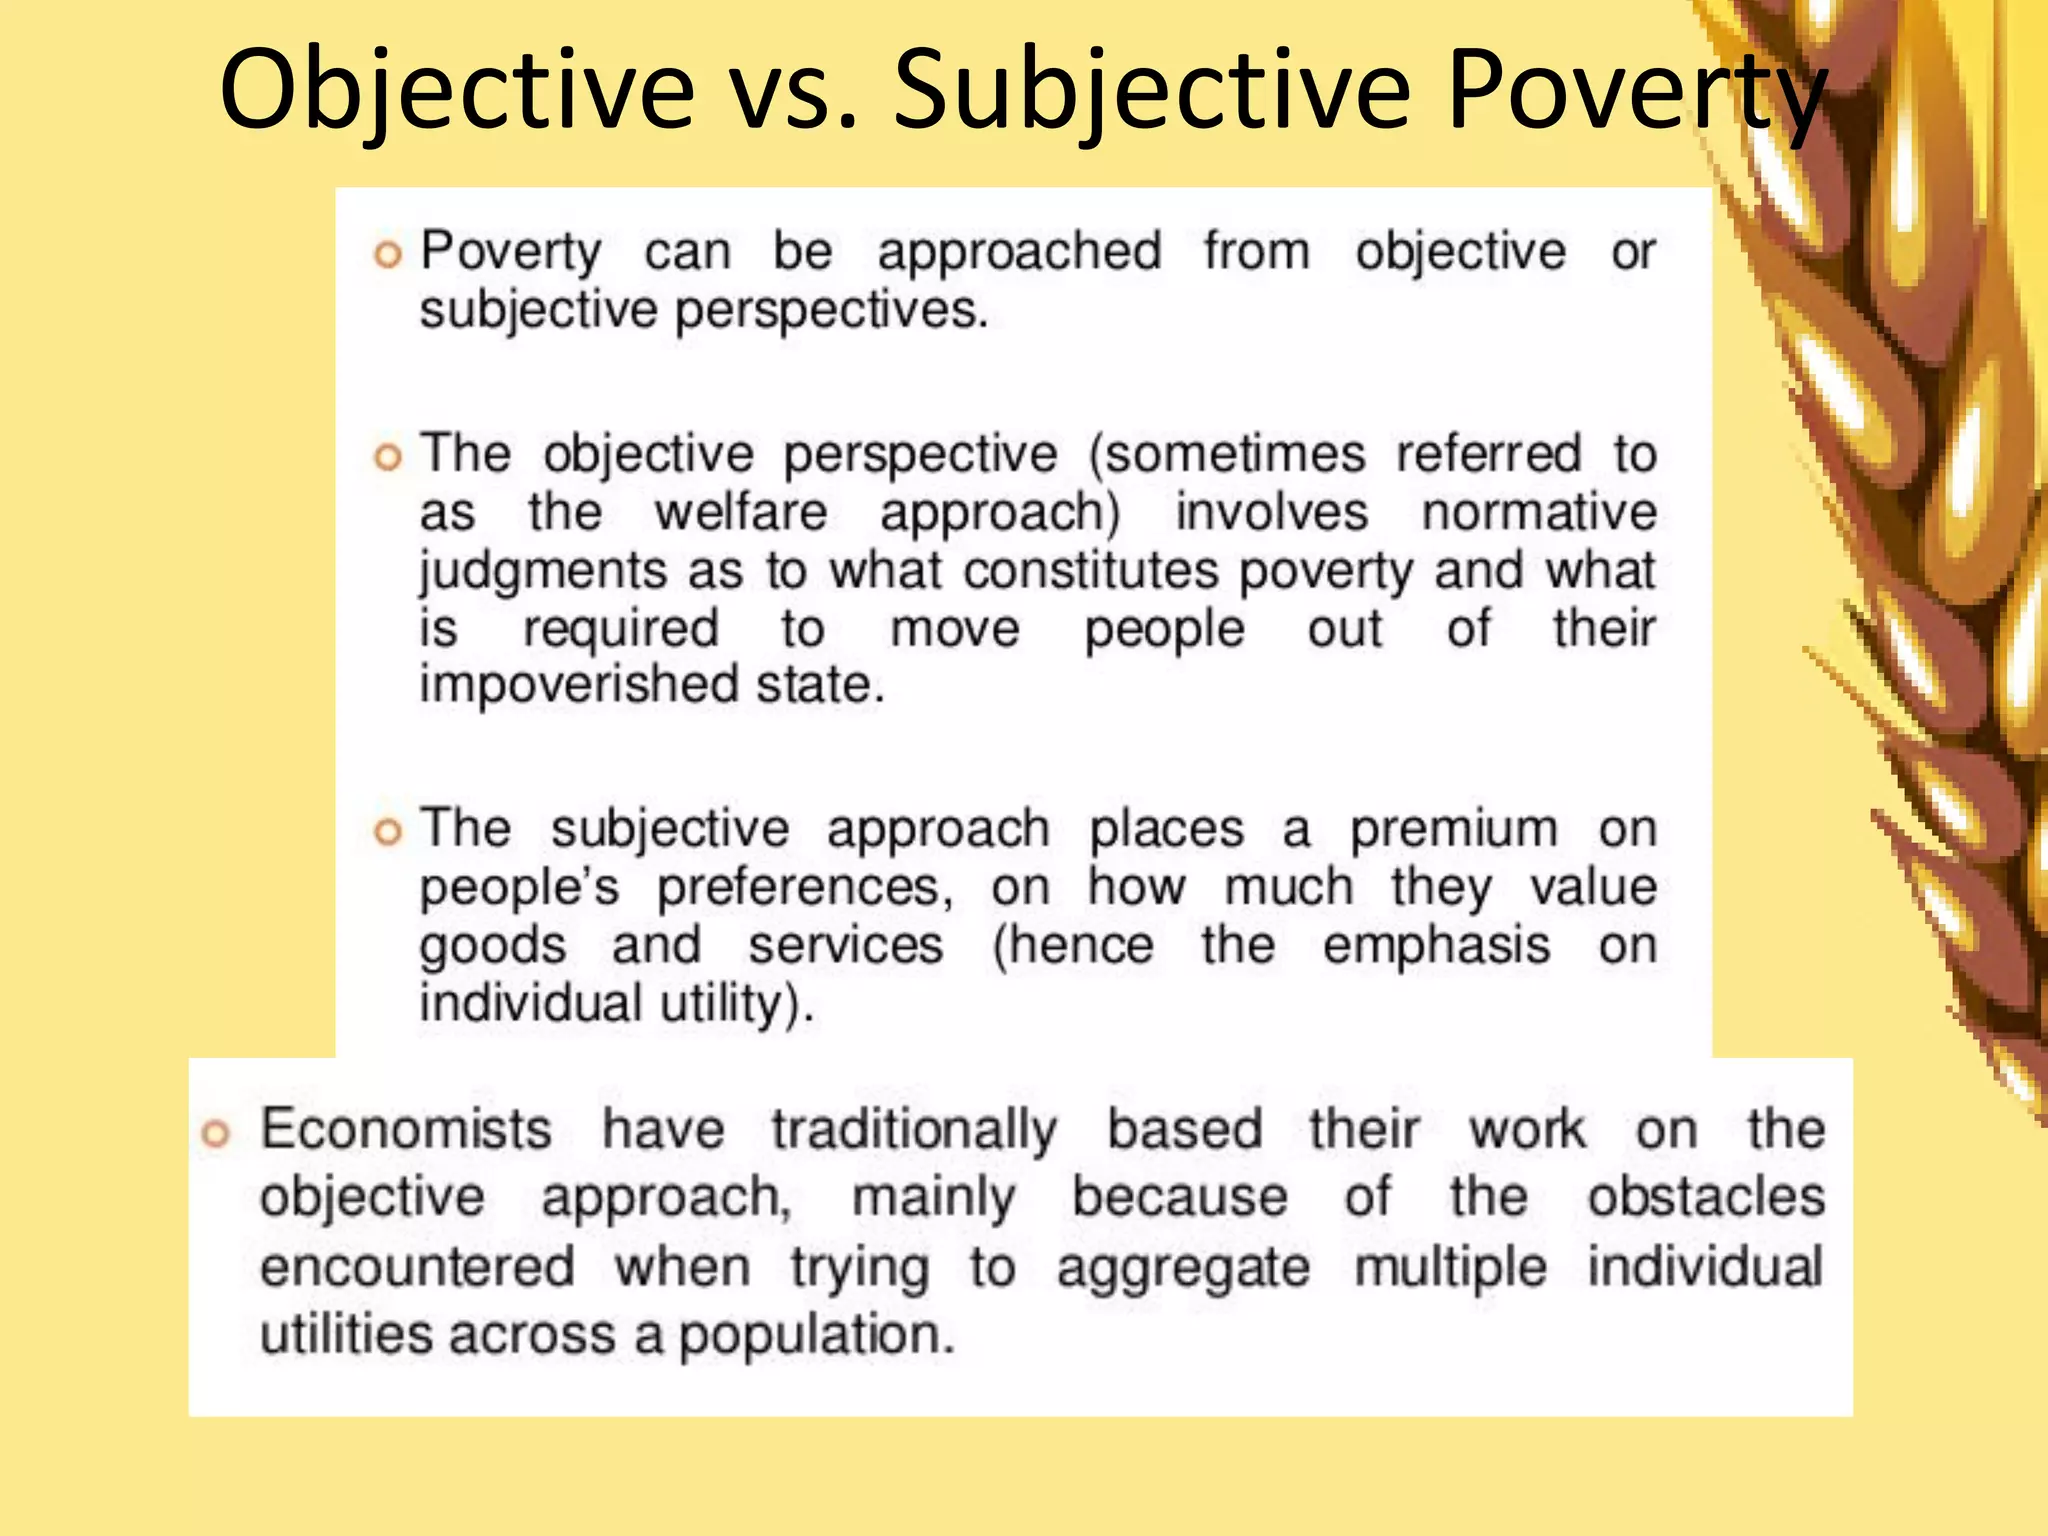


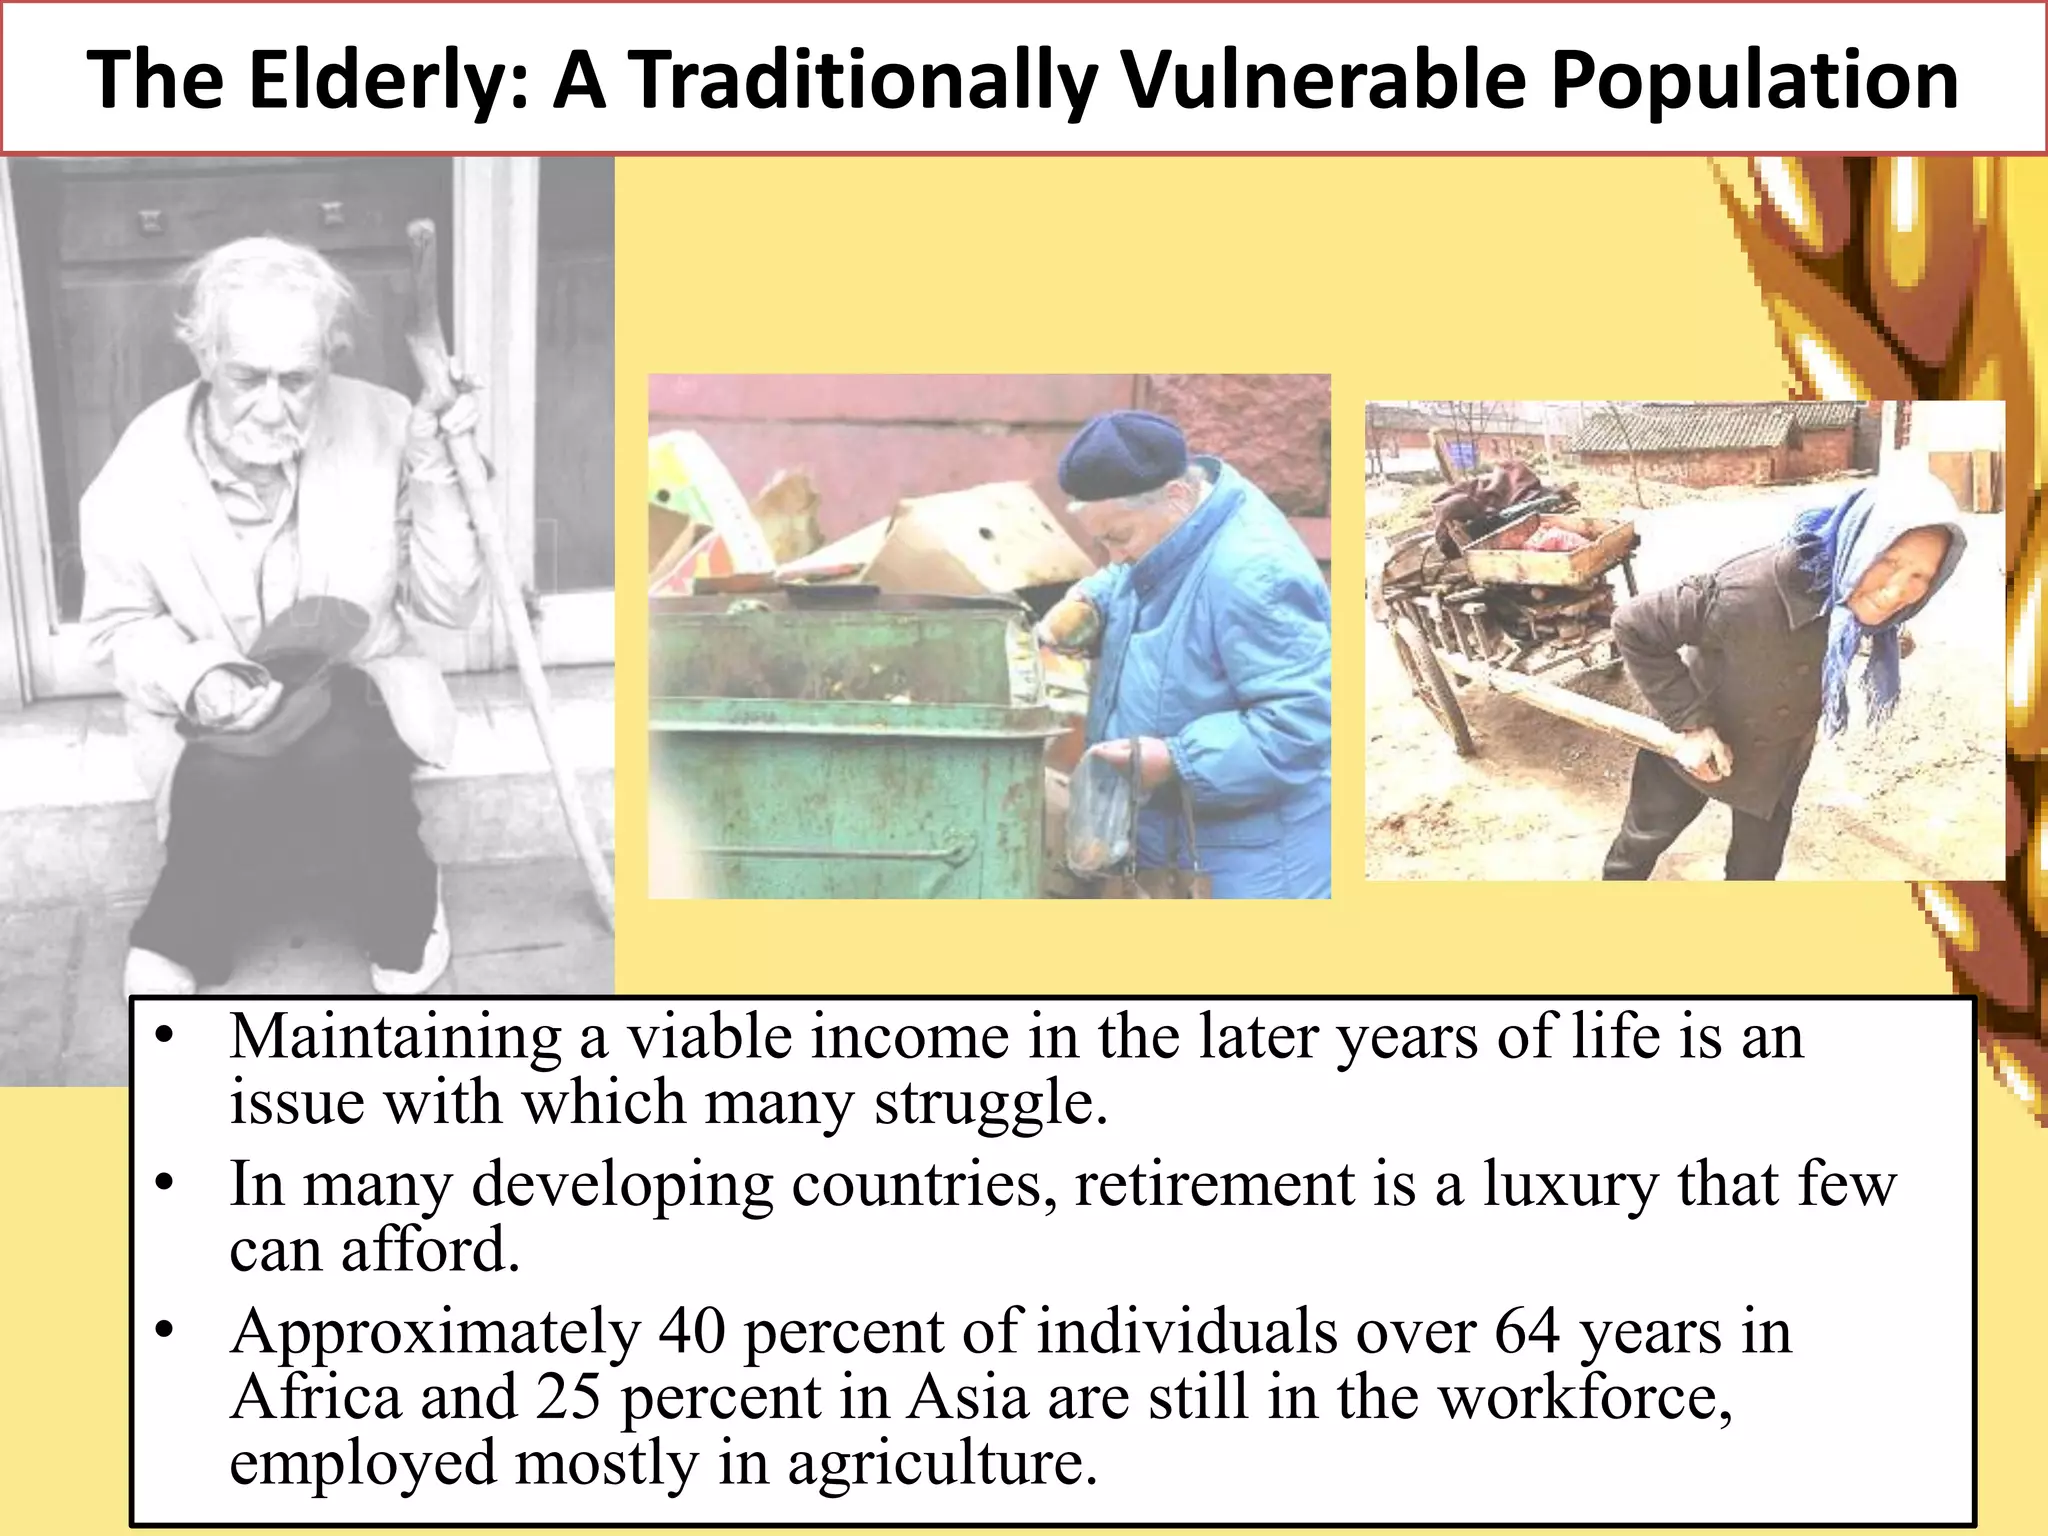
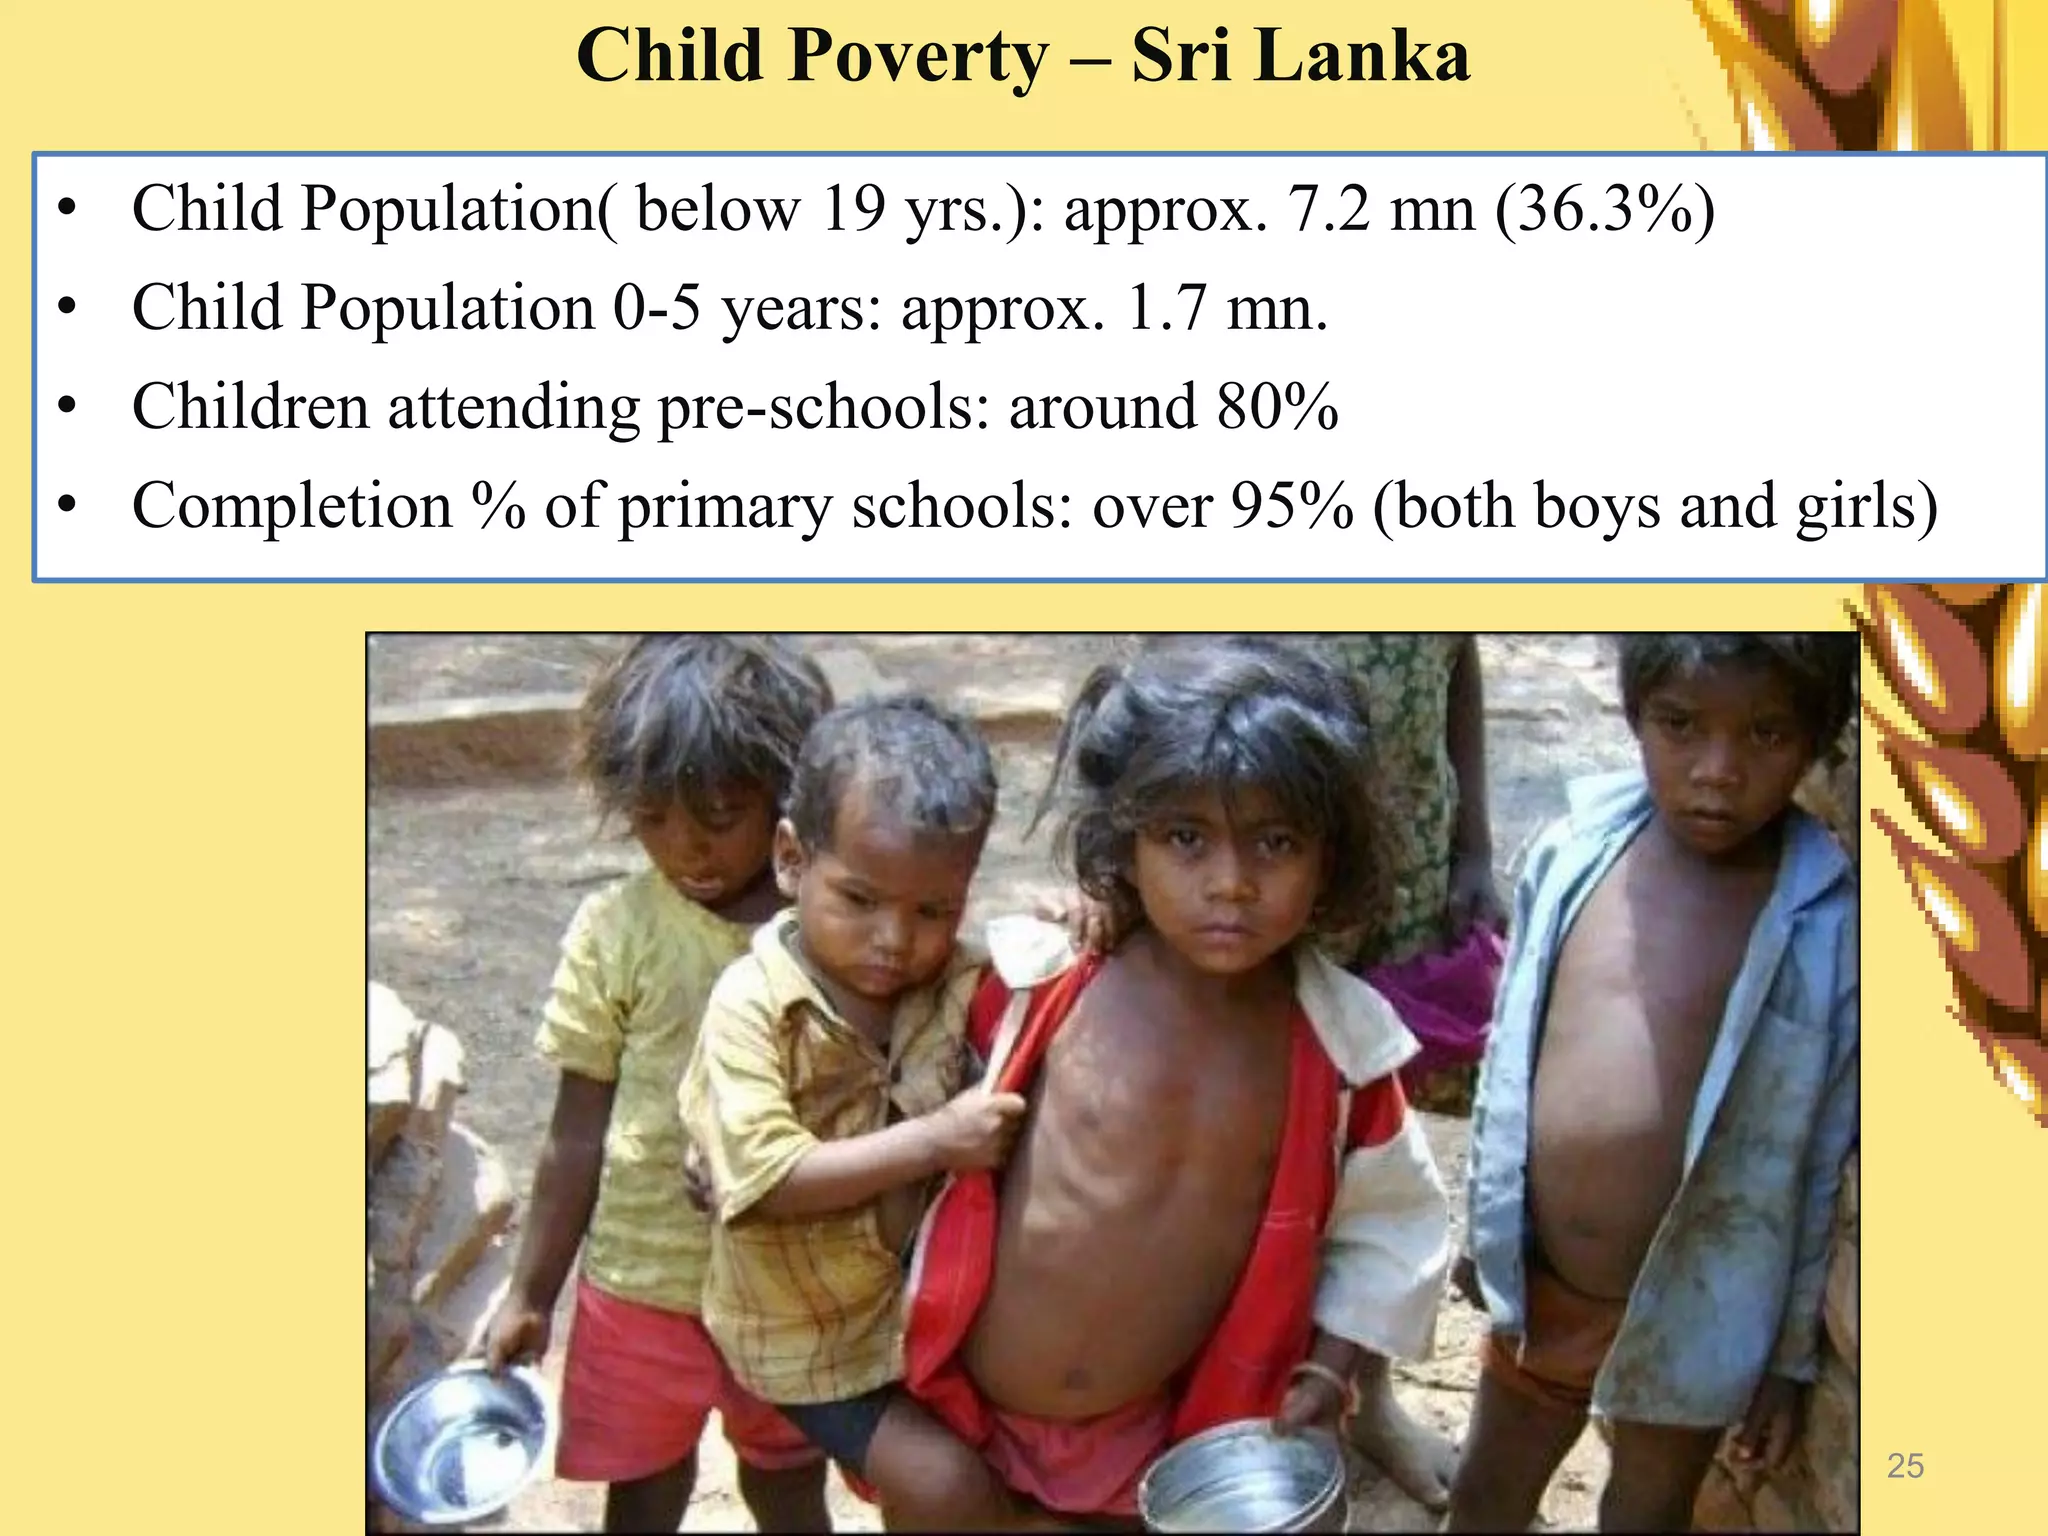


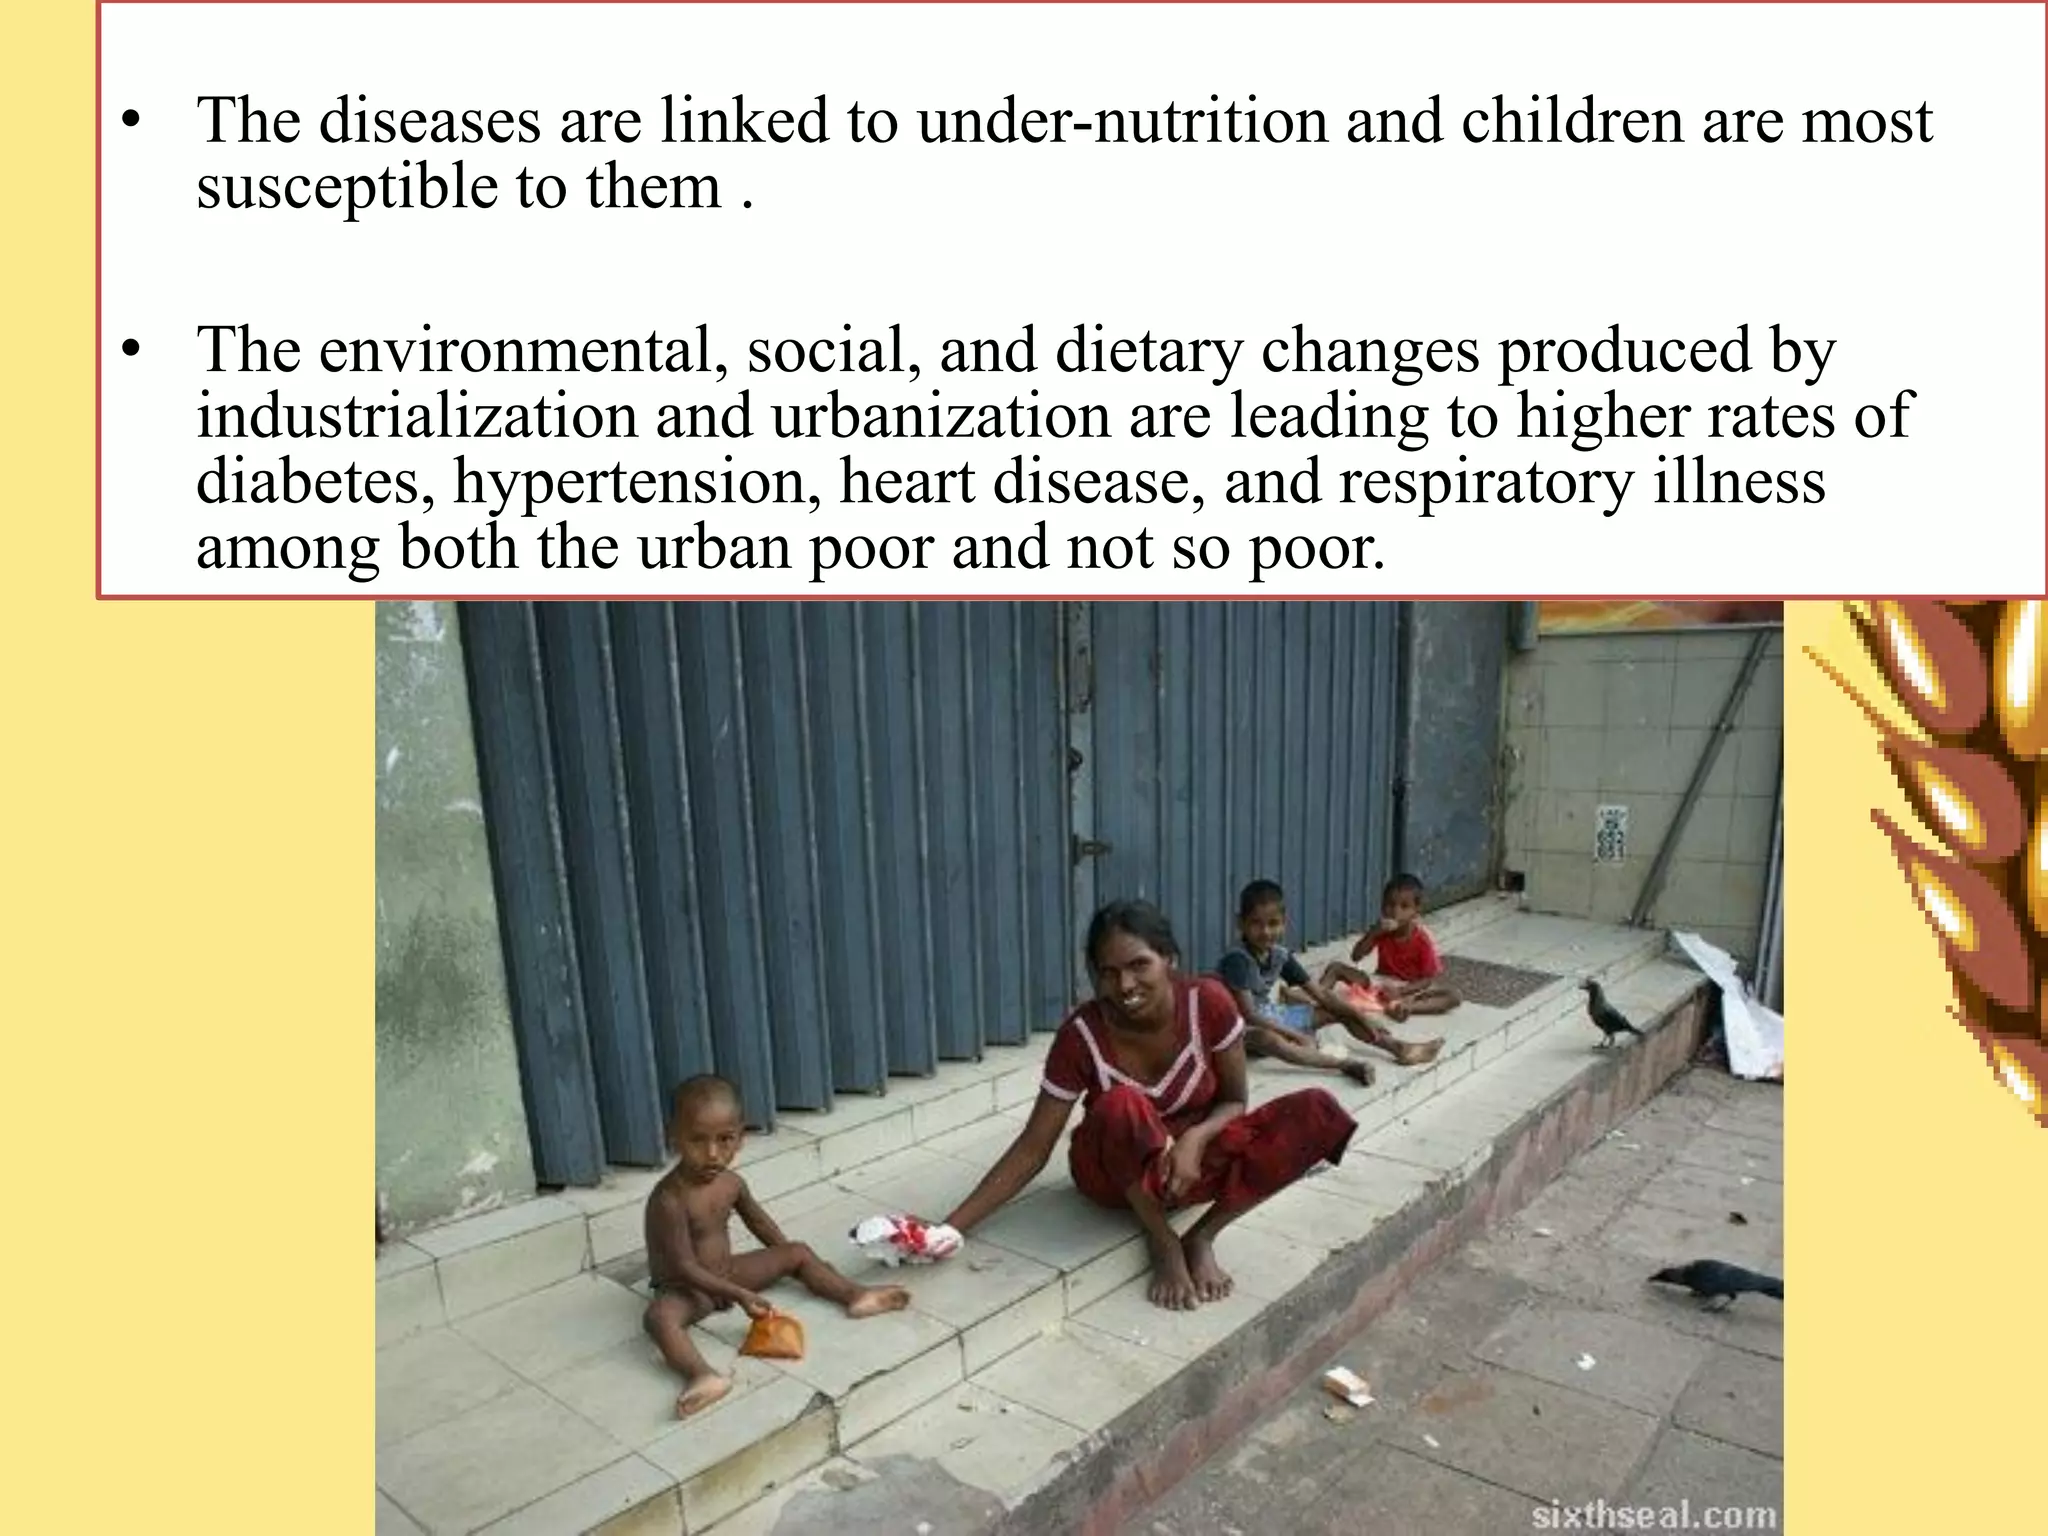

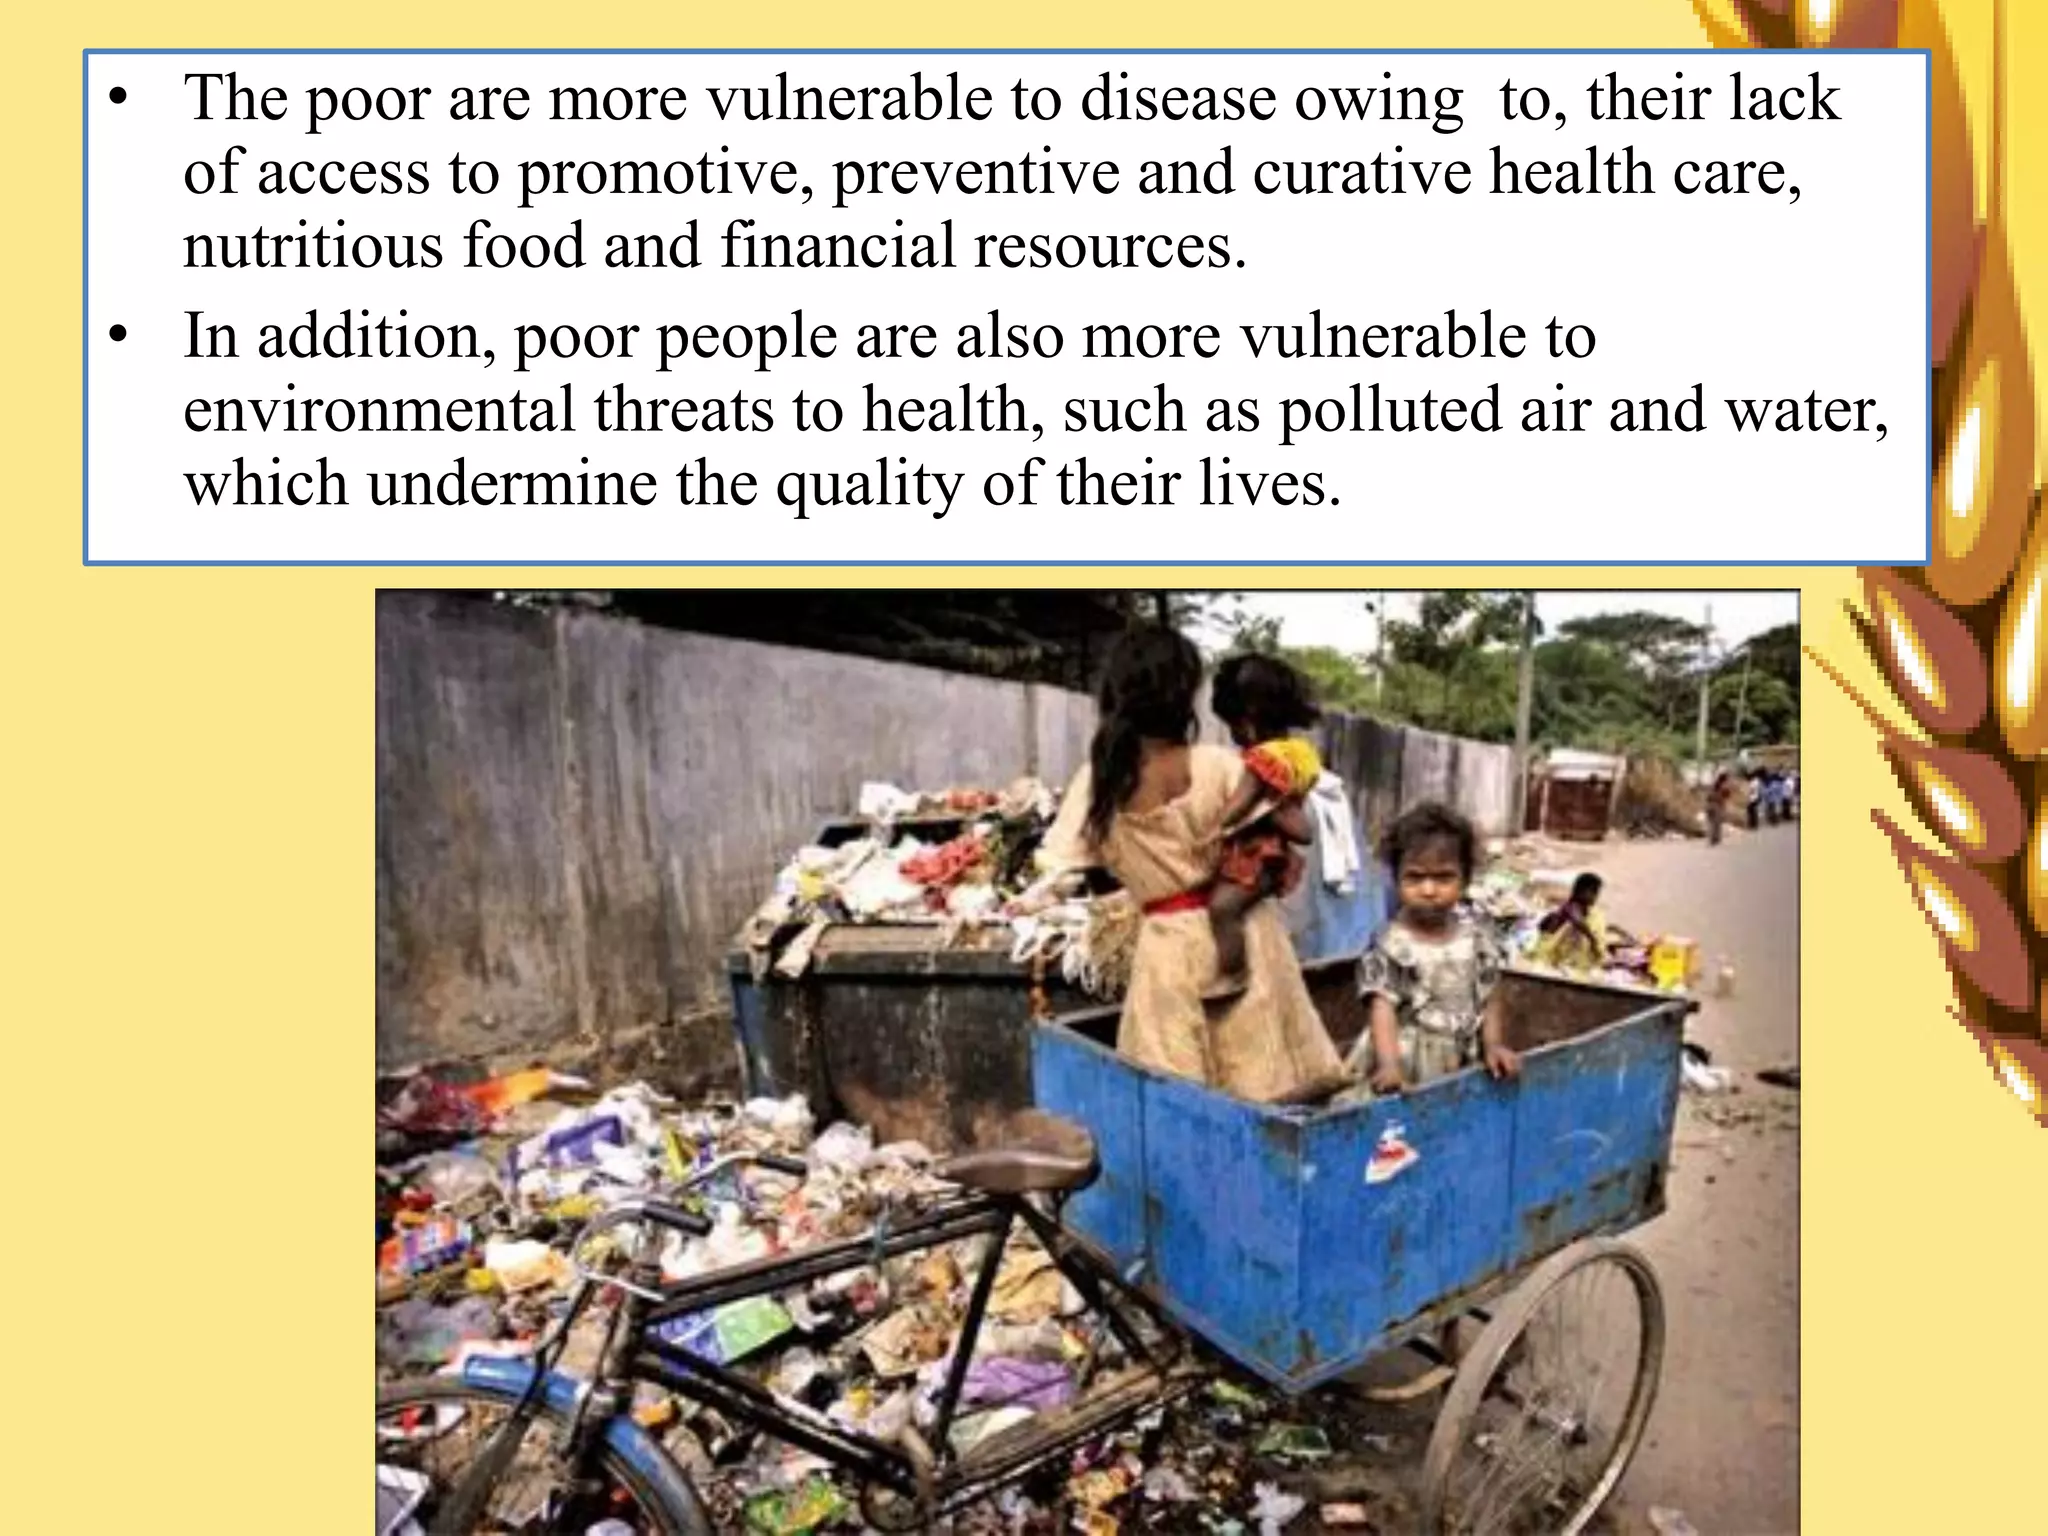

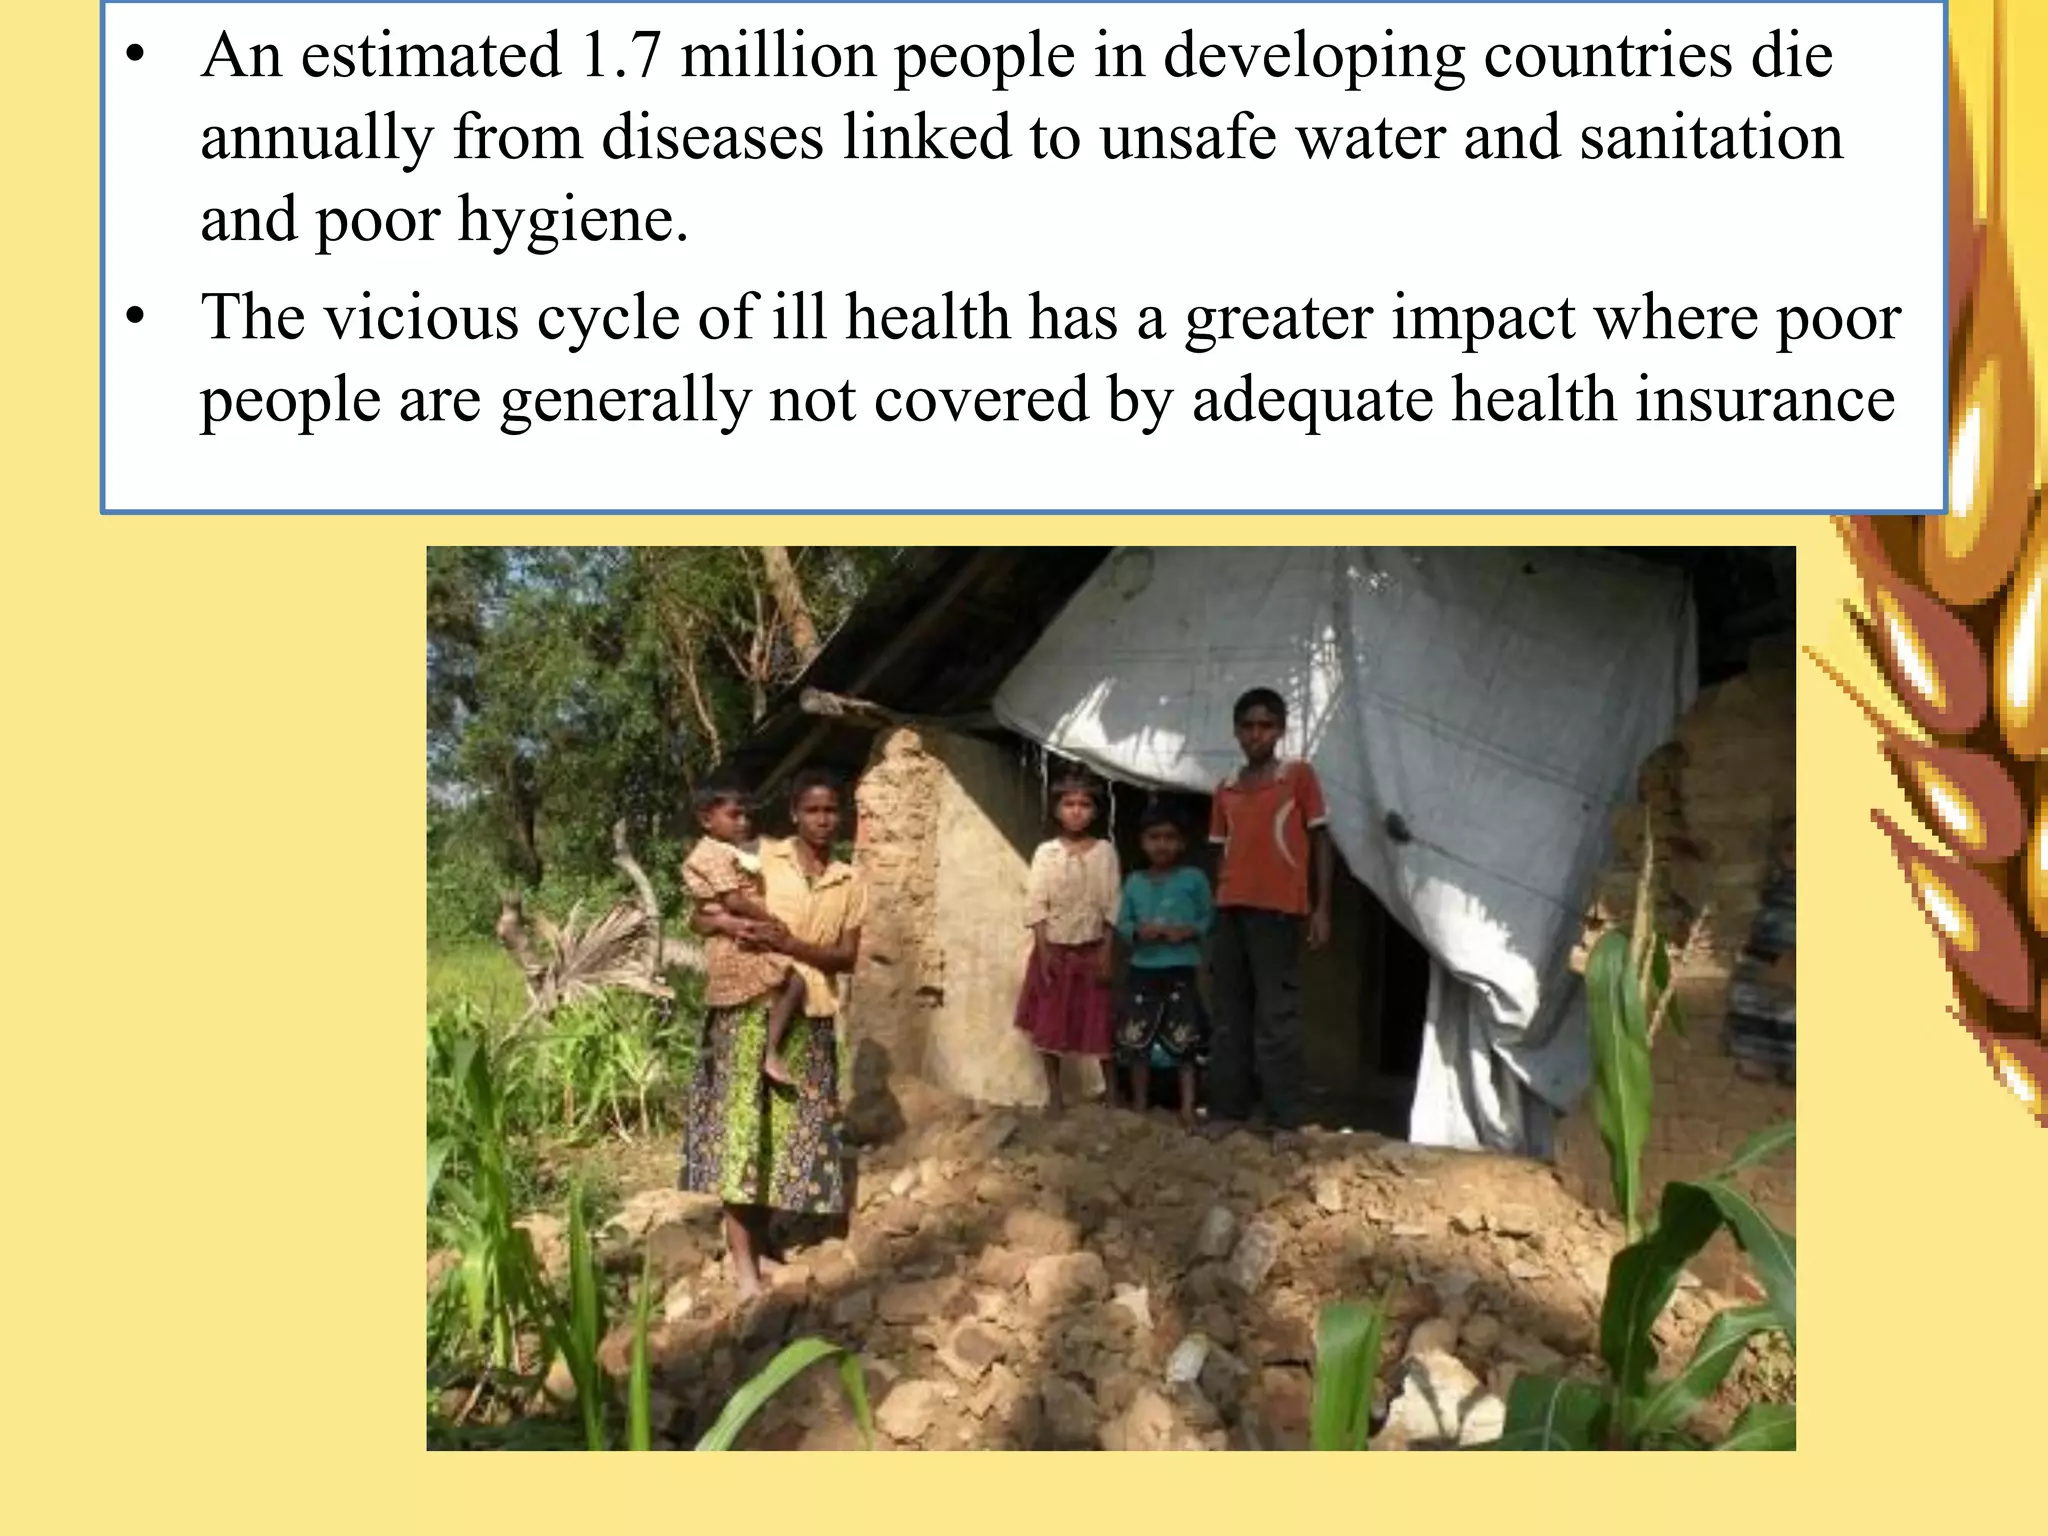


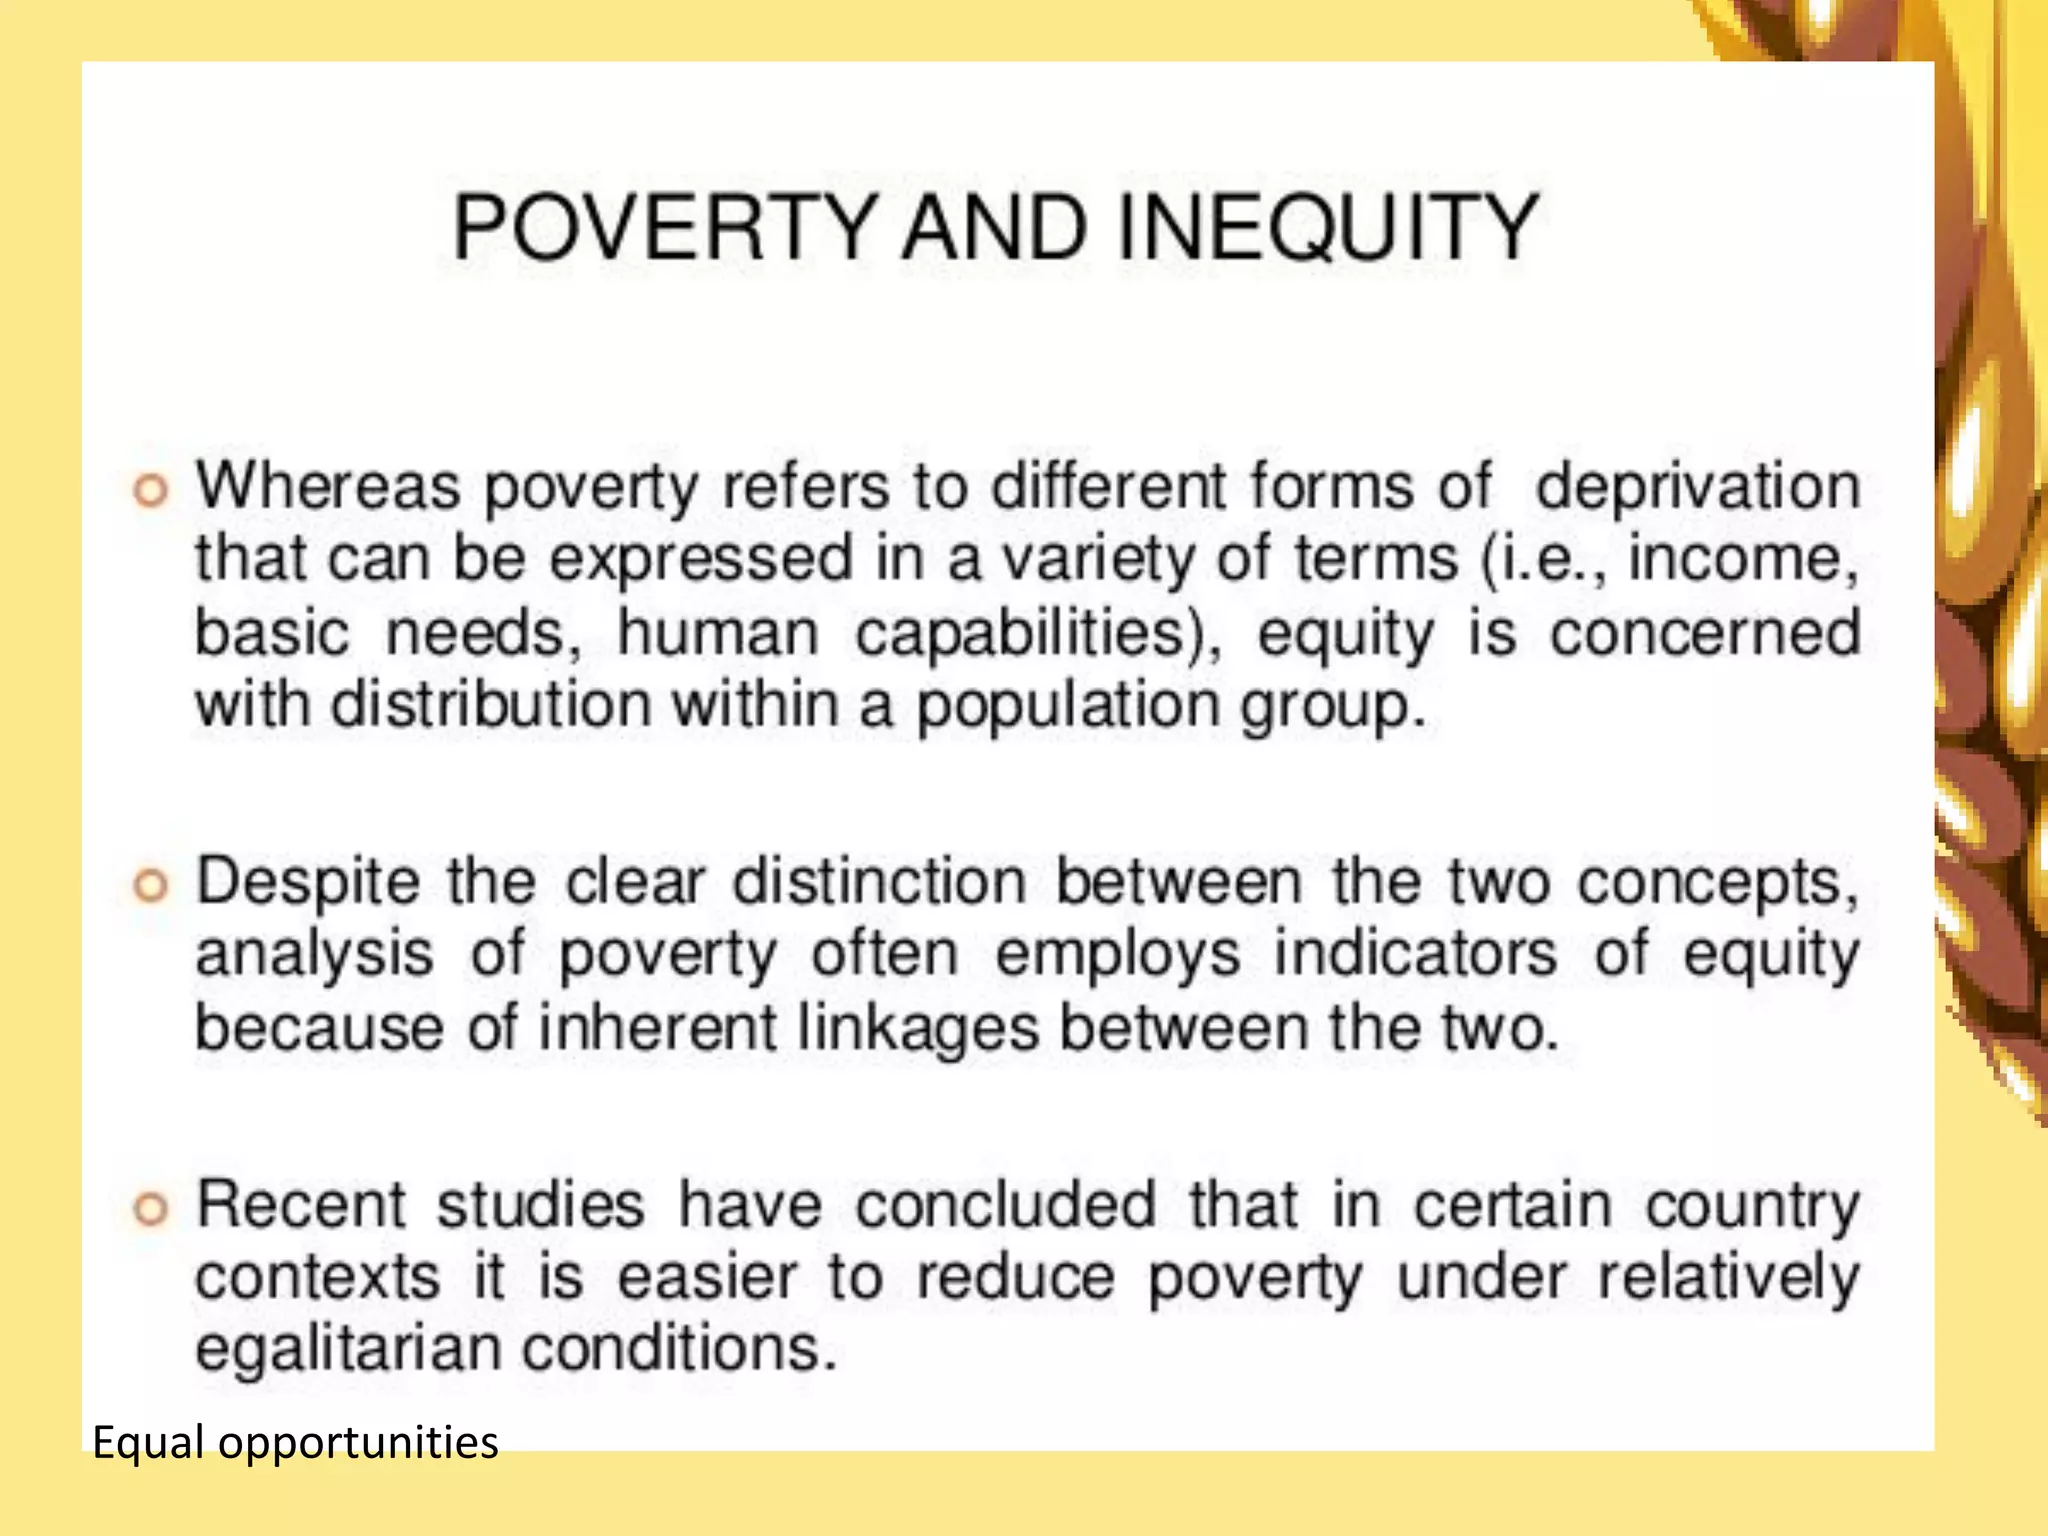


The document discusses the concepts of absolute and relative poverty, defining the former as a lack of essential resources to meet basic human needs, and the latter as a varied standard of living determined by societal measures. It highlights global poverty statistics, particularly in sub-Saharan Africa and South Asia, and outlines the feminization of poverty, child poverty in Sri Lanka, and the impacts of poverty on health outcomes. Additionally, it provides insights into the complexities of measuring poverty through various lenses, including socioeconomic disparities and accessibility to essential services.


