Evaluation of Standar & Regional Satellite Chlorophyll-a Algorithms for MODIS...Anisa Aulia Sabilah
Review Jurnal Penginderaan Jauh Sinar Tampak "Evaluation of Standar & Regional Satellite Chlorophyll-a Algorithms for MODIS in the Bohai & Yellow Seas, China" oleh Wang et al. (2019)
"Field characterization of location-specific dynamic amplification factors to...TRUSS ITN
Abstract: This paper highlights the impact of dynamic amplification factors in remaining fatigue life assessment of ship unloaders. In practice, the widely accepted procedure for these structures is to carry out a fatigue life assessment envisages: (1) carrying out static analysis, (2) taking into account dynamics via the application of dynamic amplification factors, and (3) applying Miner’s rule. This factor, provided by the standard, is applied to the structure as a whole without considering the vibration of each structural member individually. This paper characterizes the dynamic behavior of each element using location-based dynamic amplification factors estimated from measurements. This caters for a more accurate assessment of the structure, whilst maintaining the simplicity of the standard procedure.
Seismic QC & Filtering with GeostatisticsGeovariances
The quality of seismic volumes is critical in building reliable reservoir models. Seismic data are often polluted by acquisition or processing artifacts which may have strong impact on subsequent seismic processing or interpretation. Geostatistics allows filtering efficiently seismic noise and artifacts without modifying the signal.
Geovariances provides solutions from seismic data quality control and filtering to reservoir characterization. This technology is based on geostatistics and all algorithms are available in Isatis, leader in geostatistical software solutions.
"Reduction of uncertainties associated to the dynamic response of a ship unlo...TRUSS ITN
Here, the TRUSS (Training in Reducing Uncertainty in Structural Safety) ITN (Innovative Training Network) Horizon 2020 project (http://trussitn.eu, 2015-19) demonstrates how the accuracy of residual life assessment predictions can be improved by achieving a good agreement between measured and predicted dynamic responses of a crane structure. Existing records of measured strain data are often missing information such as the weight of the payload, the hoisting speed and acceleration that are relevant for structural assessment purposes. This paper aims to reduce uncertainties associated with the recorded data in an aged grab ship unloader by comparing measured and non-linear transient finite element analyses results for a loading/unloading cycle. The speed pattern is determined from a best match to the measured record. The moving load consisting of ‘trolley + grab + payload’ is modelled with parameters that are derived from minimizing differences between measured and simulated responses. The determination of these loading parameters is central to accurately assess the remaining life of ship unloaders.
Development of a soil carbon map for the United Republic of TanzaniaExternalEvents
This presentation was presented during the Workshop on Soil Cabon Mapping of the Global Soil Partnership (GSP) that took place at FAO headquarters 23 November 2016. The presentation was made by Bas Kempen from ISRIC, the Netherlands
GPS cycle slips detection and repair through various signal combinationsIJMER
Abstract: GPS Cycle slips affect the measured spatial distance between the satellite and the receiver, thus affecting the accuracy of the derived 3D coordinates of any ground station. Therefore, cycle slips must be detected and repaired before performing any data processing. The objectives of this research are to detect the Cycle slips by using various types of GPS signal combinations with graphical and statistical tests techniques, and to repair cycle slips by using average and time difference geometry techniques. Results of detection process show that the graphical detection can be used as a primary detection
technique whereas the statistical approaches of detection are proved to be superior. On the other hand, results of repairing process show that any trial can be used for such process except for the 1st and 2nd time differences averaging all data as they give very low accuracy of the cycle slip fixation.
A Fresh Look at Marine Magnetic Anomalies, One of the Key Datasets in the Dev...The Rothwell Group, L.P.
A Fresh Look at Marine Magnetic Anomalies, One of the Key Datasets in the Development of Plate Tectonics by Ian Norton - 2014 PaleoGIS & PaleoClimate Users Conference
Here are six Geometry STEM Lessons produced by NASA. These geometry lessons use the 5-E’s Instructional Model: “Engage, Explore, Explain, Extend, and Evaluate” to accomplish the lesson objectives. Geometry topics taught and covered include: the Pythagorean Theorem, volume of a cylinder, properties of circles, arc lengths, measurement of angles, volume of geometric solids, and estimating the area of a complex geometric shape. Some of these geometry lessons request students to be familiar with using a calculator, such as the Texas Instruments Nspire. Other geometry learning materials that you may want to check out are 15 Geometry Textbooks and 227 Geometry Videos by Khan Academy.
Visibility analysis in the Stonehenge and Avebury World Heritage SitePaul Cripps
The results of some work I did whilst working for English Heritage, to update the visibility analysis in the Stonehenge & Avebury World Heritage Site GIS. The analysis has subsequently been published as part of the WHS Management Plan.
DSD-INT 2017 Using XBeach to train a Bayesian network for coastal hazard pred...Deltares
Presentation by Haris Plomaritis (University of Algarve-CIMA) at the XBeach X (10th Year Anniversary) Conference, during Delft Software Days - Edition 2017. Wednesday, 1 November 2017, Delft.
ESA SMOS (Soil Moisture and Ocean Salinity) Mission: Principles of Operation ...adrianocamps
SMOS basic principles and description of some products developed at the SMOS Barcelona Expert Center.
Disclaimer: these materials were prepared for Eduacational purposes only.
In this paper, we discuss about the Big Data. We
analyze and reveals the benefits of Big Data. We analyze the
big data challenges and how Hadoop gives solution to it. This
research paper gives the comparison between relational
databases and Hadoop. This research paper also gives reason
of why Big Data and Hadoop.
General Terms
Data Explosion, Big Data, Big Data Analytics, Hadoop, Hadoop
Distributed File System, MapReduce
DSD-INT 2018 From global to local: Volvo Ocean Race 2018 - MinnsDeltares
Presentation by Tony Minns, Deltares, The Netherlands, at the Delft3D - User Days (Day 2: Hydrodynamics), during Delft Software Days - Edition 2018. Tuesday, 13 November 2018, Delft.
DSD-INT 2018 An Engineering Approach to construction of a Storm Surge Model f...Deltares
Presentation by Edwin Elias, Deltares USA, Inc., USA, at the Delft3D - User Days (Day 2: Hydrodynamics), during Delft Software Days - Edition 2018. Tuesday, 13 November 2018, Delft.
10ο Πανελλήνιο Συμπόσιο Ωκεανογραφίας & Αλιείας
7-11 Μαΐου 2012, Αθήνα
Το Υδάτινο Σύστημα και ο Άνθρωπος
Τροφή από τη θάλασσα: Αλιεία - Υδατοκαλλιέργειες
10ο Πανελλήνιο Συμπόσιο Ωκεανογραφίας & Αλιείας
7-11 Μαΐου 2012, Αθήνα
Το Υδάτινο Σύστημα και ο Άνθρωπος
Τροφή από τη θάλασσα: Αλιεία - Υδατοκαλλιέργειες
10ο Πανελλήνιο Συμπόσιο Ωκεανογραφίας & Αλιείας
7-11 Μαΐου 2012, Αθήνα
Το Υδάτινο Σύστημα και ο Άνθρωπος
Τροφή από τη θάλασσα: Αλιεία - Υδατοκαλλιέργειες
10ο Πανελλήνιο Συμπόσιο Ωκεανογραφίας & Αλιείας
7-11 Μαΐου 2012, Αθήνα
Το Υδάτινο Σύστημα και ο Άνθρωπος
Τροφή από τη θάλασσα: Αλιεία - Υδατοκαλλιέργειες
10ο Πανελλήνιο Συμπόσιο Ωκεανογραφίας & Αλιείας
7-11 Μαΐου 2012, Αθήνα
Ειδική Συνεδρία: Κορινθιακός κόλπος: η μικρή Μεσόγειος μέσα στη Μεσόγειο. Οι φορείς των πολιτών μιλούν - Θέλουμε να μας ακούσετε!
GDG Cloud Southlake #33: Boule & Rebala: Effective AppSec in SDLC using Deplo...James Anderson
Effective Application Security in Software Delivery lifecycle using Deployment Firewall and DBOM
The modern software delivery process (or the CI/CD process) includes many tools, distributed teams, open-source code, and cloud platforms. Constant focus on speed to release software to market, along with the traditional slow and manual security checks has caused gaps in continuous security as an important piece in the software supply chain. Today organizations feel more susceptible to external and internal cyber threats due to the vast attack surface in their applications supply chain and the lack of end-to-end governance and risk management.
The software team must secure its software delivery process to avoid vulnerability and security breaches. This needs to be achieved with existing tool chains and without extensive rework of the delivery processes. This talk will present strategies and techniques for providing visibility into the true risk of the existing vulnerabilities, preventing the introduction of security issues in the software, resolving vulnerabilities in production environments quickly, and capturing the deployment bill of materials (DBOM).
Speakers:
Bob Boule
Robert Boule is a technology enthusiast with PASSION for technology and making things work along with a knack for helping others understand how things work. He comes with around 20 years of solution engineering experience in application security, software continuous delivery, and SaaS platforms. He is known for his dynamic presentations in CI/CD and application security integrated in software delivery lifecycle.
Gopinath Rebala
Gopinath Rebala is the CTO of OpsMx, where he has overall responsibility for the machine learning and data processing architectures for Secure Software Delivery. Gopi also has a strong connection with our customers, leading design and architecture for strategic implementations. Gopi is a frequent speaker and well-known leader in continuous delivery and integrating security into software delivery.
Essentials of Automations: Optimizing FME Workflows with ParametersSafe Software
Are you looking to streamline your workflows and boost your projects’ efficiency? Do you find yourself searching for ways to add flexibility and control over your FME workflows? If so, you’re in the right place.
Join us for an insightful dive into the world of FME parameters, a critical element in optimizing workflow efficiency. This webinar marks the beginning of our three-part “Essentials of Automation” series. This first webinar is designed to equip you with the knowledge and skills to utilize parameters effectively: enhancing the flexibility, maintainability, and user control of your FME projects.
Here’s what you’ll gain:
- Essentials of FME Parameters: Understand the pivotal role of parameters, including Reader/Writer, Transformer, User, and FME Flow categories. Discover how they are the key to unlocking automation and optimization within your workflows.
- Practical Applications in FME Form: Delve into key user parameter types including choice, connections, and file URLs. Allow users to control how a workflow runs, making your workflows more reusable. Learn to import values and deliver the best user experience for your workflows while enhancing accuracy.
- Optimization Strategies in FME Flow: Explore the creation and strategic deployment of parameters in FME Flow, including the use of deployment and geometry parameters, to maximize workflow efficiency.
- Pro Tips for Success: Gain insights on parameterizing connections and leveraging new features like Conditional Visibility for clarity and simplicity.
We’ll wrap up with a glimpse into future webinars, followed by a Q&A session to address your specific questions surrounding this topic.
Don’t miss this opportunity to elevate your FME expertise and drive your projects to new heights of efficiency.
Securing your Kubernetes cluster_ a step-by-step guide to success !KatiaHIMEUR1
Today, after several years of existence, an extremely active community and an ultra-dynamic ecosystem, Kubernetes has established itself as the de facto standard in container orchestration. Thanks to a wide range of managed services, it has never been so easy to set up a ready-to-use Kubernetes cluster.
However, this ease of use means that the subject of security in Kubernetes is often left for later, or even neglected. This exposes companies to significant risks.
In this talk, I'll show you step-by-step how to secure your Kubernetes cluster for greater peace of mind and reliability.
Builder.ai Founder Sachin Dev Duggal's Strategic Approach to Create an Innova...Ramesh Iyer
In today's fast-changing business world, Companies that adapt and embrace new ideas often need help to keep up with the competition. However, fostering a culture of innovation takes much work. It takes vision, leadership and willingness to take risks in the right proportion. Sachin Dev Duggal, co-founder of Builder.ai, has perfected the art of this balance, creating a company culture where creativity and growth are nurtured at each stage.
UiPath Test Automation using UiPath Test Suite series, part 4DianaGray10
Welcome to UiPath Test Automation using UiPath Test Suite series part 4. In this session, we will cover Test Manager overview along with SAP heatmap.
The UiPath Test Manager overview with SAP heatmap webinar offers a concise yet comprehensive exploration of the role of a Test Manager within SAP environments, coupled with the utilization of heatmaps for effective testing strategies.
Participants will gain insights into the responsibilities, challenges, and best practices associated with test management in SAP projects. Additionally, the webinar delves into the significance of heatmaps as a visual aid for identifying testing priorities, areas of risk, and resource allocation within SAP landscapes. Through this session, attendees can expect to enhance their understanding of test management principles while learning practical approaches to optimize testing processes in SAP environments using heatmap visualization techniques
What will you get from this session?
1. Insights into SAP testing best practices
2. Heatmap utilization for testing
3. Optimization of testing processes
4. Demo
Topics covered:
Execution from the test manager
Orchestrator execution result
Defect reporting
SAP heatmap example with demo
Speaker:
Deepak Rai, Automation Practice Lead, Boundaryless Group and UiPath MVP
GraphRAG is All You need? LLM & Knowledge GraphGuy Korland
Guy Korland, CEO and Co-founder of FalkorDB, will review two articles on the integration of language models with knowledge graphs.
1. Unifying Large Language Models and Knowledge Graphs: A Roadmap.
https://arxiv.org/abs/2306.08302
2. Microsoft Research's GraphRAG paper and a review paper on various uses of knowledge graphs:
https://www.microsoft.com/en-us/research/blog/graphrag-unlocking-llm-discovery-on-narrative-private-data/
Kubernetes & AI - Beauty and the Beast !?! @KCD Istanbul 2024Tobias Schneck
As AI technology is pushing into IT I was wondering myself, as an “infrastructure container kubernetes guy”, how get this fancy AI technology get managed from an infrastructure operational view? Is it possible to apply our lovely cloud native principals as well? What benefit’s both technologies could bring to each other?
Let me take this questions and provide you a short journey through existing deployment models and use cases for AI software. On practical examples, we discuss what cloud/on-premise strategy we may need for applying it to our own infrastructure to get it to work from an enterprise perspective. I want to give an overview about infrastructure requirements and technologies, what could be beneficial or limiting your AI use cases in an enterprise environment. An interactive Demo will give you some insides, what approaches I got already working for real.
Generating a custom Ruby SDK for your web service or Rails API using Smithyg2nightmarescribd
Have you ever wanted a Ruby client API to communicate with your web service? Smithy is a protocol-agnostic language for defining services and SDKs. Smithy Ruby is an implementation of Smithy that generates a Ruby SDK using a Smithy model. In this talk, we will explore Smithy and Smithy Ruby to learn how to generate custom feature-rich SDKs that can communicate with any web service, such as a Rails JSON API.
Encryption in Microsoft 365 - ExpertsLive Netherlands 2024Albert Hoitingh
In this session I delve into the encryption technology used in Microsoft 365 and Microsoft Purview. Including the concepts of Customer Key and Double Key Encryption.
FIDO Alliance Osaka Seminar: Passkeys and the Road Ahead.pdf
Συλλογή και αφομοίωση δεδομενων Glider κατά μήκος διατομής της θάλασσας της Λεβαντίνης. Hayes D.
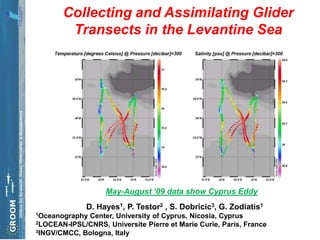
1. Collecting and Assimilating Glider
Transects in the Levantine Sea
May-August ‘09 data show Cyprus Eddy
D. Hayes1, P. Testor2 , S. Dobricic3, G. Zodiatis1
1OceanographyCenter, University of Cyprus, Nicosia, Cyprus
2LOCEAN-IPSL/CNRS, Universite Pierre et Marie Curie, Paris, France
3INGV/CMCC, Bologna, Italy
2. Goal: Accurate description of mean state
----> Improve Forecast Accuracy
• Method
• Collect high resolution temperature and salinity profiles over long
periods in upper 1000 m (gliders)
• Implement glider data assimilation (3DVAR) in operational
regional model (CYCOFOS)
• Results:
• Cyprus eddy + Atlantic Water always found (>3/2009 with gliders)
• Assimilation run shows difference from the control run
• Analysis:
• Cyprus Eddy dominates a complex circulation
• Work needed to quantify improvement in forecast
• Conclusions:
• RT glider observations gliders unique: improve ocean forecasts
3. Glider description
• Battery-powered, buoyancy-
driven
• 25-50 cm/s, 16-45o slope
• CTD, oxygen, fluorescence,
optical backscatter, currents
• surface transmit/receive for
data and instructions every 5h.
• 1000 m dive capability
Photo: A. Hannides
4. Seaglider description
• Low-drag fairing over hull of compressibility ~= seawater
• Lithium batteries, ~6 mo life (4600 km or 650 dives to 1km)
• Iridium satellite phone for data, instruction transfer
• Controlled with file exchange (commands, waypoints, configuration)
Photo: U of Washington
6. EYE of the Levantine
TS properties
• Depth-ave
velocity, Max
30 cm/s
• Anti-cyclonic
• Radius
~40km
• November
2009 to
January
2010
• Near
Eratosthenes
Seamount
7. EYE of the Levantine (12/2009)
• Sampling the warm core Cyprus Eddy
• Labs: LOCEAN, LOV (fr), OGS (it), ULB (be), UCY-OC (cy)
• Gliders: physical and biogeochemical context for shipborne
measurements
– 6 gliders deployed
from Limassol
– 2 profiling floats
– 4 surface drifters
– shipborne
measurements by
CYBO (Cyprus),
TARA (French),
Merian (German)
8. EYE of the Levantine (12/2009)
• Sampling the warm core Cyprus Eddy
• Labs: LOCEAN, LOV (fr), OGS (it), ULB (be), UCY-OC (cy)
• Gliders: physical and biogeochemical context for shipborne
measurements
– 6 gliders deployed
from Limassol
– 2 profiling floats
– 4 surface drifters
– shipborne
measurements by
CYBO (Cyprus),
TARA (French),
Merian (German)
9. EYE of the Levantine
Glider (Atalanta)
• 23 Nov-1 Dec 2009
• Salinity (top)
• Temperature (mid)
• Dissolved Oxygen (bot)
• Asymmetric: south
branch of core more
focused
10. EYE of the Levantine
Glider Comparisons with MS Merian
• 10 stations 4-5 Jan 2010
• Dives 170-250 7-31 Jan 2010 • 14-22 Jan 2010
• Depth-average currents from glider • Geostrophic Velocity (top) and
(1000m) and from ADCP (800m) ADCP (bottom)
0
11.
12. OceanVar
Dobricic and Pinardi, 2008
• Calculates T and S residuals (model ―background‖ minus observations) at every
time step data are present
• After POM, calculates ―correction‖ T and S based on residuals in window (1.5d)
• Applies corrections at the beginning of the next run (20 time steps).
Glider (red) and model (blue) S,T profiles
Difference (black) and correction (green)
8 Dec 2009
13. Results
• Numerical flow ―hindcast‖ simulation: Nov. 2009-April 2010
• Daily update of surface forcing and open boundary conditions
• Quantify the value of 1 glider, vs 6 gliders, vs floats+ships+gliders
• EYE experiment (so far only 0 and 1 completed)
Corrections on S and T at 300 m
8 Dec 2009
14. Results
• Numerical flow ―hindcast‖ simulation: Nov. 2009-April 2010
• Correction to T at 280 m
• Glider positions
• DAILY
15. Results
• EYE experiment assimilating only one glider‘s T, S profiles
• Sea surface elevation map at end of simulation: 19 April 2012
No assimilating Assimilating glider data
The difference
16. Discussion
• Quantify the value of 1 glider, vs 6 gliders, vs floats+ships+gliders
• EYE experiment (so far only 0 and 1 completed—see difference below)
• See problem at BC
17. Discussion
• Quantify the value of 1 glider, vs 6 gliders, vs floats+ships+gliders
• EYE experiment (so far only 0 and 1 completed—see difference below)
• See problem at BC
18. Work in Progress
Operational Data Assimilation—TODAY:
Glider mission and simulations: 16 December 2011 to present
Assimilated in CYCOFOS, compared to control run
19. Work in Progress
Operational Data Assimilation—TODAY:
Salinity at 360 m for control run (L) and D/A run (R) for this Wednesday
Need to quantify the improvement by comparing to independent data
E.G.: SST, XBT, SLA+MDT, cruise CTD/ADCP
20. Future Work
• New FP7 project, GROOM, has
started.
• Goal: to design a European Glider
Infrastructure.
• Heavily based on existing, but
integrated and improved.‘
• Recommend payloads, protocols,
operation centers, etc.
• Support policy AND research
• monitoring for parameter ‗X‘
• availability for process study ‗Y
Photo: TARA Oceans
21. Conclusions
• Gliders improve forecasting skill
• Quantifying the improvement is not
done yet
• Eastern Levantine highly variable
and full of mesoscale: need real
time data
Acknowledgements
• Funding: FP7-ECOOP, FP7-GROOM,
Cyprus RPF and UCY, TARA/Oceans.
• Colleagues: MFS, U of Athens
(ALERMO and Skiron providers)
• Launch/recovery support: Department
of Fisheries and Marine Research Photo: A. Hannides