SlideShare a Scribd company logo
1 of 8
Download to read offline
Q2 2011 | OFFICE MARKET


HOUSTON OFFICE MARKET

RESEARCH & FORECAST REPORT


                                         Houston Office Market Posts Positive Absorption in
                                         Second Quarter 2011
                                         The Houston Office Market posted 81,091 square feet of positive net absorption during the second
                                         quarter with the majority taking place in the suburban sector. Year-over-year vacancy rates
                                         decreased from 16.5% to 15.9% citywide. Rental rates continued to decrease during the second
                                         quarter, with the citywide average rate dropping to $22.70 from $23.81 per square foot in the first
          MARKET INDICATORS              quarter. Vacancy in CBD Class A properties continued to soften, reaching 12.5% compared to 9.0%
                       2Q10     2Q11     a year ago. In contrast, Class A suburban vacancy decreased to 16.2% from 19.6% a year earlier.
CITYWIDE NET                             Leasing activity decreased between quarters, consisting mostly of renewals and/or expansions,
ABSORPTION (SF)        (317k)   81k      (listed in table on page 3 of this report), suggesting tenants took advantage of more favorable lease
                                         terms.
CITYWIDE AVERAGE
                                         Houston is once again making headlines as one of the least affected markets in the nation. In its
VACANCY                16.5%    15.9%
                                         March 2011 issue, Site Selection awarded Texas the Governor’s Cup for new project activity, with
                                         424 projects of which 152 are located in the Houston MSA. Houston ranked #2 for Tier One New
CITYWIDE AVERAGE                         and Expanded Facilities in 2010 of MSA’s with population over 1 million. In addition, Chief Executive
RENTAL RATE            $23.21   $22.70   Magazine (for the seventh straight year) named Texas as the number one state for Best Business,
                                         in which Houston’s Energy Industry played a huge part. In May, Modis, the second largest North
CLASS A RENTAL RATE                      American IT staffing service provider, named Houston as one of the top cities for IT jobs and
                                         Fastcompany.com named Houston as “2011 Fast City of the Year”. Macro factors driving the
  CBD                  $35.86   $34.15
                                         absorption of office space ultimately ties back to job count. According to the Texas Labor Market
  SUBURBAN             $27.35   $26.63   Review, total nonagricultural employment in Texas netted only 8,800 jobs in May, while at the local
CLASS A VACANCY                          level, Houston’s MSA gained 16,500 jobs. Texas annual employment grew by 2.0%, while
                                         Houston’s grew by 1.8%.
  CBD                   9.0%    12.5%
  SUBURBAN             19.6%    16.2%    Looking forward, the outlook for the downtown office market reveals the potential for additional
                                         softness based on projected new vacancy scheduled to become available over the next two years..
                                         This influx of new availability will add additional vacancy on top of the current 12.5% registered in
                                         second quarter 2011. Additional large blocks of space coming on line during the year can be found
                                         in One Allen Center with 438,000 SF available and 164,000 SF in Continental Center I, both in third
                                         quarter. The Continental / United Airlines merger is expected to reduce the need for the newly
                                         merged company’s 650,000 SF of downtown space. The company’s primary lease does not expire
   JOB GROWTH & UNEMPLOYMENT
                                         until 2014, but it is expected that some of the Continental space may come to market as sublease
        (Seasonally Adjusted)
                                         space in 2011.
UNEMPLOYMENT           5/10      5/11
HOUSTON                8.2%      8.2%
                                                                               ABSORPTION, NEW SUPPLY & VACANCY RATES
TEXAS                  8.1%      8.0%
                                                                2,500,000
U.S.                   9.6%      9.1%                                                                                              17.0%
                                                                2,000,000
                                                                                                                                   15.0%
                                                                1,500,000
                      ANNUAL                                                                                                       13.0%
                                                  Absorption
JOB GROWTH            CHANGE     5/11                           1,000,000
                                                  New Supply                                                                       11.0%
HOUSTON                1.8%      16.5k                            500,000
                                                  Vacancy                0                                                         9.0%
TEXAS                  2.0%      8.8k
                                                                  -500,000                                                         7.0%
U.S.                   0.7%       54k
                                                                -1,000,000                                                         5.0%


www.colliers.com/houston
RESEARCH & FORECAST REPORT | Q2 2011 | HOUSTON OFFICE MARKET

                                                         VACANCY & AVAILABILITY                                ABSORPTION & DEMAND
                                                         Overall vacancy levels remained unchanged             Houston recorded positive net absorption of
                                                         between quarters, remaining at 15.9%. The             81,091 SF in the second quarter, compared to
  CBD VS. SUBURBAN                                       average suburban vacancy rose by 10 basis             (316,519) SF of negative net absorption at the
                                                         points to 15.9% from 15.8% the previous               same time last year. Contributing to the
  CLASS A OFFICE VACANCY
                                                         quarter, while CBD vacancy remained the same          quarters positive gain was Suburban Class A
 20.0%                                                   at 16.0%. On a year-over-year basis, suburban         space with positive net absorption of 261,138
 18.0%                                                   vacancy decreased by 120 basis points to              SF, followed by CBD Class A space with
 16.0%
                                                         15.9% from 17.1%, and CBD increased 220               positive net absorption at 32,128 SF. Suburban
 14.0%
 12.0%
                                                         basis points to 16.0% from 13.8%.                     Class B space had the largest amount of
 10.0%                                                   Vacancy in CBD Class A properties continued           negative absorption in second quarter 2011 with
  8.0%                                                   to soften reaching 12.5% compared to 9.0% a           (134,965) SF of negative net absorption
  6.0%
                                                         year ago. In contrast, CBD Cass B properties          followed by suburban Class C space with
  4.0%                                                                                                         (64,587) SF of negative net absorption.
                                                         decreased to 20.0% vacancy, down from 22.8%
                                                         12 months earlier.                                    RENTAL RATES
                                                         Although suburban vacancy rates remained in           Citywide rental rates continued to decline
   CBD VACANCY            SUBURBAN VACANCY               double-digits, Class A vacancy actually dropped       during the second quarter 2011.
                                                         between quarters to 16.2% from 19.6% on a
                                                                                                               On a year-over-year basis, CBD Class A
                                                         year-over-year basis. By comparison, suburban
                                                                                                               average quoted rental rates dropped $1.71 to
                                                         Class B vacancy rose to 16.7% from 16.3%.
                                                                                                               $34.15 per square foot (from $35.86), while
  CLASS A OFFICE RENTS
                                                         Citywide, a total of 47 office properties had a       suburban Class A rates dropped $0.72 to
 $40.00                                                  minimum of 100,000 SF available for lease in          $26.63 per square foot (from $27.35). The
 $38.00                                                  both direct and sublease space which is 5 less        average CBD Class B asking rate increased by
 $36.00
                                                         than the previous quarter, and 14 of those            $0.49 to $23.44 per square foot (from $22.95),
 $34.00
                                                         properties have over 200,000 SF available,            while suburban Class B rates remained the
 $32.00
                                                         down from 25.                                         same at $17.95 per square foot on a year-over-
 $30.00
 $28.00                                                  Sublease space totaled 3.4 million SF, including      year basis. Until demand outpaces supply, rental
 $26.00                                                  1.3 million SF of vacant space and 1.2 million SF     rates are expected to remain flat.
                                                         of subleases available for occupancy over the
                                                         next 12 months. The largest sublease space
                                                         being marketed is Devon Energy’s space,
      CBD RENTS             SUBURBAN RENTS               282,000 SF in Two Allen Center in the CBD and
                                                         Braeswood Tower II has the largest suburban
                                                         contiguous block of sublease space available,
                                                         146,392 SF.


  QUOTED GROSS RENTAL RATES FOR TOP PERFORMING OFFICE BUILDINGS
                                                                                           YEAR                AVAIL.      RENT
  BUILDING NAME                  ADDRESS                    SUBMARKET         RBA (SF)               LEASED                         OWNER
                                                                                           BUILT                SF        ($/SF)
                                                                                                                                    Metropolitan Life Insurance Co. &
  Wells Fargo Plaza              1000 Louisiana             CBD                1,721,242      1982     94.5%    363,136    $46.10
                                                                                                                                    N.Y. State Retirement Fund
  Heritage Plaza                 1111 Bagby                 CBD                1,089,266      1986     90.5%    161,357    $40.50 Brookfield Office Properties

  1100 Louisiana                 1100 Louisiana             CBD                1,265,332      1980     98.4%    127,347    $38.64 Enterprise Products Partners

  CityCentre One                 800 Town & Country Blvd    Energy Corridor     101,300       2008     100%     15,000     $40.00 Midway Companies

  Enclave Parkway                1401 Enclave Parkway       Energy Corridor     209,185       1999     97.0%    164,547    $33.00 Parkway Properties

  Minute Maid Building           2150 Town Square Place     E. Fort Bend        185,000       2008     76.2%     44,109    $30.00 Planned Community Developers

  Wells Fargo Bank Tower         1300 Post Oak Blvd.        Galleria            491,254       1983     95.1%     59,140    $34.15 TIAA-CREF

  Williams Tower                 2800 Post Oak Blvd         Galleria           1,476,973      1983     90.5%   358,966     $33.93 Hines REIT

  11 Greenway Plaza              11 Greenway                Greenway            745,956       1978     97.9%   139,804     $30.15 Crescent Real Estate Equities

  One BriarLake Plaza            2000 W. Sam Houston        Westchase           550,000      2000      100%       7,507    $39.15 Behringer Harvard

  Waterway Plaza I               10003 Woodloch Forest      Woodlands           223,483      2000      94.0%    20,326     $33.30 W.P. Carey & Co. LLC

  Waterway Square                4 Waterway Ave.            Woodlands           232,364       2009     93.3%    15,680     $36.00 The Woodlands Development
   Note: Avail. SF includes direct and sublet space.
   Source: CoStar Property


                                                                                                                              COLLIERS INTERNATIONAL | P. 2
RESEARCH & FORECAST REPORT | Q2 2011 | HOUSTON OFFICE MARKET


   SALES ACTIVITY                                 LEASING ACTIVITY
   Houston’s Office Investment sales              Houston’s office leasing activity                      HOUSTON OFFICE SUBMARKETS
   activity increased during the second           reached 2.1 million SF in the first
   quarter with 25 properties changing            quarter, compared to 4.0 million SF in
   hands compared to 13 in the previous           the same quarter last year. Leasing
   quarter. According to CoStar, office           activity is still below levels prior to
   sale transactions had a total dollar           the economic downturn, and an
   volume of $409 million, averaging              increasing number of office tenants
   $188/SF with a 8.1% capitalization             are renewing lease commitments with
   rate.                                          better concession packages or
   Among      the    most   significant           relocating to buildings/submarkets
   transactions closed in the second              offering more attractive terms.
   quarter were:                                  All but three of the more significant
   New York State Retirement Funds’               office leases signed during the first
   acquisition of a 50% interest in Wells         quarter were renewals and/or
   Fargo Plaza from MetLife for $510              expansions. The most significant new
   million ($300/SF) in the CBD                   office lease signed in the second
   submarket.                                     quarter     was     Columbia     Gas
                                                  Transmissions’ lease for 55,000
   Chevron acquired the 1,228,877                 square feet in Sage Plaza located in
   square foot Four Allen Center in the           the West Loop/Galleria submarket,
   CBD submarket from Brookfield                  followed by Amerigroup Corps lease
   Office Properties for $340 million             for 50,000 square feet in 5959
   ($277/SF). Chevron currently leases            Corporate Drive located in the
   the entire building.                           Southwest submarket.


   Q2 2011 SIGNIFICANT SALES TRANSACTIONS
                                                                    YEAR                                                        SALE
           BUILDING NAME               SUBMARKET        RBA (SF)                      BUYER                      SELLER                    $/SF   CLOSED
                                                                    BUILT                                                       PRICE
                                                                             ING Clarion OBO N.Y.
   Wells Fargo Plaza (50% Interest)   CBD               1,700,000    1979                              MetLife                 $510.0M     $300       6/2011
                                                                             State Retirement Fund
                                                                                                       Brookfield Office
   Four Allen Center                  CBD               1,228,877    1983    Chevron Corporation                               $340.0M     $277       6/2011
                                                                                                       Properties
                                                                             Buchanan Street
   Beltway 8 Corporate Center 3 & 4 Northwest Far       259,505      2007                              Panattoni Development    $26.3M     $101       6/2011
                                                                             Partners
                                                                                                       Beacon Investment
   One & Two Park Ten Place           Katy Freeway       91,166     1979/83 KBS Realty Advisors                                 $8.4M       $92       5/2011
                                                                                                       Properties


   Q2 2011 TOP OFFICE LEASES
         BUILDING NAME/ADDRESS                       SUBMARKET                SF                                 TENANT                  LEASE DATE
   1600 Smith                               CBD                             311,000         Chevron*                                          5/2011
   Eldridge Oaks                            Katy Freeway West               138,000         KBR*                                              4/2011
   Sage Plaza                               West Loop/Galleria               55,000         Columbia Gas Transmission                         5/2011
   5959 Corporate Drive                     Southwest                       50,000          Amerigroup Corp                                   4/2011
   Remington Square                         Northwest                        42,364         Seawell                                           6/2011
   Chase Tower                              CBD                              42,136         Breitburn Energy*                                 4/2011
   *Renewal and/or Expansion;


                                                                                                                           COLLIERS INTERNATIONAL | P. 3
RESEARCH & FORECAST REPORT | Q2 2011 | HOUSTON OFFICE MARKET

  HOUSTON OFFICE MARKET SUMMARY (CBD, SUBURBAN & CITYWIDE)

                  INVENTORY               DIRECT VACANCY           SUBLEASE VACANCY VACANCY                  VACANCY RATE (%) NET ABSORPTION (SF) RENTAL RATE

   Class    # of Bldgs.   Total (SF)       (SF)         Rate (%)      (SF)         Rate (%)   Total (SF)     Q2-2011        Q1-2011     Q2-2011       1Q-2011       Avg ($/SF)
  CBD
     A           28         26,963,571     2,597,425       9.6%        780,510         2.9%      3,377,935       12.5%          12.6%       32,128      -33,540            $34.15
     B           30          9,370,310     1,856,651       19.8%         15,314        0.2%      1,871,965      20.0%           19.6%       -10,411      34,868           $23.44
     C           19          1,308,204      783,648       59.9%             3957       0.3%       787,605       60.2%          55.2%        -2,212       -14,543           $18.03
   Total         77        37,642,085     5,237,724        13.9%       799,781         2.1%    6,037,505        16.0%          16.0%       19,505        -13,215           $29.81
  SUBURBAN
     A          272         70,014,873    10,955,541       15.6%       364,565         0.5%     11,320,106       16.2%          16.6%      261,138      537,689           $26.63
     B          892         70,401,884     11,321,701      16.1%        413,747        0.6%     11,735,448       16.7%          16.3%     -134,965      -127,662           $17.95
     C          451         18,856,783     2,145,864       11.4%        49,095         0.3%      2,194,959       11.6%          11.4%      -64,587       -18,596           $15.03
   Total        1615      159,273,540    24,423,106        15.3%      827,407          0.5%    25,250,513        15.9%          15.8%       61,586      391,431            $21.31
  OVERALL

     A          300        96,978,444     13,552,966       14.0%      1,145,075        1.2%     14,698,041       15.2%          15.5%     293,266       504,149           $28.33
     B          922         79,772,194    13,178,352       16.5%       429,061         0.5%     13,607,413          17.1%       16.7%     -145,376      -92,794            $18.58
     C          470         20,164,987     2,929,512       14.5%        53,052         0.3%     2,982,564        14.8%          14.4%      -66,799       -33,139           $15.25
   Total        1692      196,915,625 29,660,830           15.1%      1,627,188        0.8%    31,288,018        15.9%          15.9%       81,091      378,216           $22.70


 HOUSTON SUBURBAN OFFICE MARKET SUMMARY

                  INVENTORY              DIRECT VACANCY            SUBLEASE VACANCY VACANCY                  VACANCY RATE (%)           NET ABSORPTION (SF) RENTAL RATE
                 # of
   Class                  Total (SF)      (SF)        Rate (%)       (SF)        Rate (%)     Total (SF)     Q2-2011        Q1-2011     Q2-2011       Q1-2011       Avg. ($/SF)
                Bldgs.
 Allen Parkway
     A            3        1,246,576      217,628        17.5%               0        0.0%       217,628      17.5%         18.3%           5,280         33,253          $28.78
     B           29        2,815,289      271,944         9.7%         3,348          0.1%       275,292      9.8%           6.6%         -73,252        28,658           $22.58
     C           26         1,163,150    406,786         35.0%               0        0.0%       406,786 35.0%              35.4%           5,250         14,693          $19.70
    Total        58        5,225,015     896,358         17.2%         3,348          0.1%       899,706      17.2%         15.4%         -62,722        76,604           $25.57
 Baytown
     B            5         525,544         6,802          1.3%              0        0.0%         6,802      1.3%           1.3%                 0             0         $14.67
     C            2          60,396         1,563         2.6%               0        0.0%          1,563     2.6%           2.6%                 0        1040           $16.25
    Total         7         585,940         8,365         1.4%               0       0.0%          8,365      1.4%           1.4%                 0        1,040           $15.11
 Bellaire
     A           10        1,389,252      129,033         9.3%       28,822           2.1%     157,855       11.4%           11.2%         -2,796        -13,138          $22.95
     B            9        1,369,867      166,791        12.2%         4,671          0.3%     171,462       12.5%          12.6%            848           5,038          $19.54
     C            7         545,303        36,662         6.7%        10,454          1.9%       47,116      8.6%            8.6%                 0       -6,016          $15.14
    Total        26       3,304,422      332,486         10.1%       43,947           1.3%     376,433       11.4%          11.3%          -1,948        -14,116         $20.54
 Conroe
     A            1          60,000               0       0.0%               0        0.0%            0      0.0%            0.0%                 0             0                 -
     B            6         244,782        16,334         6.7%               0        0.0%      16,334       6.7%            6.5%           -535           3,784          $15.33
     C            5         302,939               0       0.0%               0        0.0%           0       0.0%            0.0%                 0             0         $15.00
    Total        12         607,721        16,334         2.7%               0       0.0%       16,334       2.7%            2.6%           -535           3,784          $15.28
 E. Fort Bend
     A           20        3,564,828      937,429        26.3%        12,199          0.3%     949,628       26.6%          27.6%          34,893         -2,219          $27.64
     B           35        2,033,510     264,798         13.0%        15,998          0.8%     280,796       13.8%          10.4%          -9,498         -11,174         $18.26
     C            4          142,013        2,413          1.7%              0        0.0%       2,413       1.7%            1.7%                 0          842          $17.50
    Total        59        5,740,351 1,204,640           21.0%        28,197         0.5% 1,232,837          21.5%          21.1%          25,395        -12,551          $23.65


                                                                                                                                              COLLIERS INTERNATIONAL | P. 4
RESEARCH & FORECAST REPORT | Q2 2011 | HOUSTON OFFICE MARKET


   HOUSTON SUBURBAN OFFICE MARKET SUMMARY


   FM 1960
       A          14         2,429,161     1,151,235   47.4%     5,442   0.2%   1,156,677   47.6%   51.0%      1,514    -15,081     $21.75
       B          85        4,722,924       962,138    20.4%    73,566   1.6%   1,035,704   21.9%   22.3%     20,037   -17,233      $14.65
       C          24            851,424      70,068     8.2%        0    0.0%     70,068    8.2%    9.3%       3,062    -8,384      $13.82
     Total        123       8,003,509 2,183,441        27.3%   79,008    1.0% 2,262,449     28.3%   29.3%     24,613   -40,698      $16.95
   Greenway
       A          16         6,167,603     885,870     14.4%    99,876   1.6%    985,746    16.0%   16.8%     17,506   -52,232      $27.58
       B          25         2,551,389     265,457     10.4%    17,397   0.7%    282,854    11.1%   10.9%      3,034   -18,655      $21.65
       C          21            873,877     261,217    29.9%        0    0.0%     261,217   29.9%   29.8%      -984     -15,419     $17.29
     Total      62       9,592,869 1,412,544           14.7%   117,273   1.2%   1,529,817   15.9%   16.4%     19,556   -86,306     $24.85
   Gulf Freeway/Pasadena
       A          2              75,066       18,718   24.9%     6,095   8.1%     24,813    33.1%   35.5%      1,809     1,834      $27.20
       B          29        1,709,060       201,497    11.8%     6,870   0.4%    208,367    12.2%   11.2%    -17,386     5,487      $18.90
       C          27           1,121,270     92,787     8.3%        0    0.0%     92,787    8.3%    9.4%      12,396    -11,517     $15.09
     Total        58        2,905,396      313,002     10.8%    12,965   0.4%    325,967    11.2%   11.1%     -3,181    -4,196      $18.60
   I-10 East
       B          4            274,672       80,160    29.2%        0    0.0%     80,160    29.2%   27.3%     -5,120       194      $13.96
       C          5             157,955           0     0.0%        0    0.0%          0    0.0%    0.0%          0      6,536      $12.00
     Total        9            432,627       80,160    18.5%        0    0.0%     80,160    18.5%   17.3%     -5,120     6,730      $13.93
   Katy Freeway
       A          45        11,556,573 2,004,724       17.3%     9,799   0.1%   2,014,523   17.4%   18.6%    115,848   284,723      $28.38
       B          86         7,166,755      902,121    12.6%    81,924   1.1%    984,045    13.7%   13.8%    -31,806   -39,566      $18.64
       C          38           1,762,617    172,675     9.8%        0    0.0%    172,675    9.8%    9.5%      -2,315    -2,287      $14.82
     Total        169    20,485,945 3,079,520          15.0%    91,723   0.4%   3,171,243   15.5%   16.1%     81,727   242,870      $23.51
   Kingwood/Humble
       A          2             133,924      25,518    19.1%        0    0.0%     25,518    19.1%   16.9%      1,247      -861      $29.40
       B          59           1,817,907    162,882     9.0%     3,224   0.2%     166,106   9.1%    9.8%      11,646     8,805      $19.82
       C          79           735,090       26,235     3.6%        0    0.0%     26,235    3.6%    4.2%       3,423       232      $16.47
     Total        140       2,686,921       214,635    8.0%     3,224    0.1%    217,859    8.1%    8.7%      16,316     8,176      $19.39
   NASA/Clear Lake
       A          6             809,351     148,739    18.4%        0    0.0%    148,739    18.4%   17.1%    -10,128   -57,096      $24.97
       B          45           3,174,176   423,535     13.3%     2,629   0.1%    426,164    13.4%   6.9%    -200,841    23,123      $19.55
       C          24           880,366      136,921    15.6%        0    0.0%     136,921   15.6%   15.1%      2,672    10,375      $15.38
     Total        75        4,863,893       709,195    14.6%    2,629    0.1%    711,824    14.6%   10.2%   -208,297   -23,598      $19.98
   North Belt/Greenspoint
       A          20         4,750,418     326,657      6.9%   62,232    1.3%    388,889    8.2%    7.3%     -42,465   -39,550     $20.02
       B          56         5,323,159     1,167,670   21.9%   54,602    1.0%   1,222,272   23.0%   25.0%     73,335    57,035      $15.72
       C          21         1,323,627      259,291    19.6%    10,971   0.8%    270,262    20.4%   18.2%    -29,572    -4,192      $13.80
     Total        97        11,397,204 1,753,618       15.4%   127,805   1.1%   1,881,423   16.5%   16.7%      1,298    13,293      $16.42

   Northeast Far and Outlier
       B          5             301,773      73,763    24.4%        0    0.0%     73,763    24.4%   25.0%      1,764         0      $17.40
       C          6             149,813      17,289    11.5%        0    0.0%      17,289   11.5%   8.0%      -5,355       572      $12.00
     Total        11           451,586       91,052    20.2%        0    0.0%     91,052    20.2%   19.4%     -3,591       572      $15.98


                                                                                                                COLLIERS INTERNATIONAL | P. 5
RESEARCH & FORECAST REPORT | Q2 2011 | HOUSTON OFFICE MARKET


   HOUSTON SUBURBAN OFFICE MARKET SUMMARY


   Northwest
       A         22        3,725,391 1,120,246       30.1%    7,378   0.2%   1,127,624   30.3%   31.0%     7,495    136,112     $24.55
       B         69        6,545,554 1,500,004       22.9%   15,809   0.2%   1,515,813   23.2%   22.2%    -2,174     26,751     $16.30
       C         41        1,568,998      121,993     7.8%       0    0.0%     121,993   7.8%    6.5%    -24,895    -11,622     $12.18
     Total      132      11,839,943 2,742,243        23.2%   23,187   0.2% 2,765,430     23.4%   22.9%   -19,574    151,241     $19.08
   Northwest Outlier
       A          1            89,750           0    0.0%        0    0.0%          0    0.0%    0.0%         0          0           -
       B         4             135,457      4,621     3.4%       0    0.0%      4,621    3.4%    1.7%     -2282          0      $18.12
     Total       5          225,207         4,621     2.1%       0    0.0%      4,621    2.1%    1.0%     -2282          0      $18.12
   Richmond/Fountainview
       B         14            781,369     94,677    12.1%       0    0.0%     94,677    12.1%   10.8%   -10,676       634      $15.39
       C         17          664,389       57,651     8.7%       0    0.0%     57,651    8.7%    7.6%     -7,385     -6,192     $13.42
     Total       31        1,445,758      152,328    10.5%       0    0.0%    152,328    10.5%   9.3%    -18,061    -5,558      $14.93
   San Felipe/Voss
       A         3          1,710,531     271,586    15.9%       0    0.0%    271,586    15.9%   14.7%   -15,348     21,232     $30.75
       B         32         3,357,119    285,972      8.5%   22,748   0.7%    308,720    9.2%    9.0%    -4,060     24,004      $19.36
       C         3             161,393     32,136    19.9%       0    0.0%     32,136    19.9%   18.8%    -1,744     -7,819     $16.49
     Total       38        5,229,043     589,694     11.3%   22,748   0.4%    612,442    11.7%   11.2%   -21,152     37,417     $23.51
   South
       A          1            80,000      19,000    23.8%       0    0.0%     19,000    23.8%   23.8%        0       1,500     $26.63
       B         15         602,907        97,038    16.1%       0    0.0%     97,038    16.1%   12.7%   -7,000      -3,888     $19.62
       C         4          223,029        39,529    17.7%       0    0.0%     39,529    17.7%   17.9%      368       -977      $14.78
     Total       20         905,936       155,567    17.2%       0    0.0%    155,567    17.2%   15.0%   -6,632     -3,365      $19.29
   South Main/Med Center
       A         15        4,159,577     324,246      7.8%       0    0.0%    324,246    7.8%    6.9%    -17,283    14,320      $29.35
       B         34        4,005,469     309,992      7.7%    4,800   0.1%    314,792    7.9%    8.5%      6,734     -3,986     $22.84
       C         31        2,453,446      107,776     4.4%       0    0.0%    107,776    4.4%    4.8%     -2,533      1,950     $19.31
     Total       80      10,618,492      742,014     7.0%    4,800    0.0%    746,814    7.0%    7.0%    -13,082    12,284      $24.74
   Southeast/Outlier
       A          1            159,304          0    0.0%        0    0.0%          0    0.0%    0.0%         0          0           -
       B         9             520,515    103,077    19.8%       0    0.0%    103,077    19.8%   19.8%        0     -18,800     $20.56
       C         2             118,772     12,533    10.6%       0    0.0%     12,533    10.6%   55.0%        0          0     $24.00
     Total       12            798,591    115,610    14.5%       0    0.0%    115,610    14.5%   16.4%        0    -18,800     $20.97
   Southwest
       A         6          1,501,746     319,312    21.3%       0    0.0%     319,312   21.3%   29.0%   110,609     16,998     $16.15
       B         59        6,017,052 1,286,043       21.4%    7,500   0.1%   1,293,543   21.5%   22.6%    41,981   -122,584     $16.26
       C         41        2,325,162     226,576      9.7%   27,670   1.2%    254,246    10.9%   9.4%    -26,149     4,294      $12.25
     Total      106        9,843,960     1,831,931   18.6%   35,170   0.4%   1,867,101   19.0%   20.2%   126,441   -101,292     $15.70

   Southwest Far and Outlier
       A         2              87,710     10,505    12.0%       0    0.0%     10,505    12.0%   9.1%     -2,553         0      $25.35
       B         14            616,117      76,118   12.4%    1,365   0.2%     77,483    12.6%   11.8%    -4,479     5,620      $26.76
       C         3             128,735      1,000     0.8%       0    0.0%      1,000    0.8%    0.0%     -1000          0      $16.00
     Total       19         832,562        87,623    10.5%    1,365   0.2%     88,988    10.7%   9.7%    -8,032      5,620     $26.43


                                                                                                            COLLIERS INTERNATIONAL | P. 6
RESEARCH & FORECAST REPORT | Q2 2011 | HOUSTON OFFICE MARKET

   HOUSTON SUBURBAN OFFICE MARKET SUMMARY

                    INVENTORY              DIRECT VACANCY            SUBLEASE VACANCY VACANCY VACANCY RATE (%) NET ABSORPTION (SF) RENTAL RATE
      Class    # of Bldgs. Total (SF)       (SF)          Rate (%)     (SF)       Rate (%)    Total (SF)       Q2-2011   Q1-2011    Q2-2011       Q1-2011        Avg. ($/SF)
   West Loop/Galleria
       A           40       16,207,654     1,539,832          9.5%      67,024        0.4%       1,606,856      9.9%     10.0%          38,983           8,513         $27.96
       B           54        5,665,149      1,218,433        21.5%       5,482         0.1%      1,223,915     21.6%     22.7%          56,703      29,970             $20.35
       C           6            332,166               0       0.0%            0       0.0%                 0    0.0%      0.0%                0           940          $16.75
      Total        100      22,204,969 2,758,265             12.4%      72,506        0.3%       2,830,771     12.7%     13.1%          95,686      39,423             $25.49
   Westchase
       A           27        7,861,857      1,068,173        13.6%      50,047        0.6%       1,118,220     14.2%     14.2%           1,004     182,004             $27.73
       B           51        4,939,227       904,412         18.3%       48,571        1.0%       952,983       19.3%    18.7%           8,905    -168,429              $18.12
       C            9           439,977       36,542          8.3%            0       0.0%         36,542       8.3%     10.9%           11,485      5,398             $15.08
      Total        87       13,241,061 2,009,127             15.2%      98,618        0.7%       2,107,745     15.9%     15.8%          21,394      18,973             $22.85
   The Woodlands
       A           15        2,248,601      437,090          19.4%       15,651       0.7%        452,741      20.1%     20.8%          15,523       17,377            $29.98
       B           59         3,185,142     475,422          14.9%      43,243         1.4%       518,665       16.3%    15.2%            9,157     57,550             $19.82
       C           5            370,876       26,221          7.1%            0       0.0%         26,221       7.1%      6.3%           -1,311      8,957                     -
      Total        79        5,804,619      938,733          16.2%      58,894        1.0%        997,627      17.2%     16.8%          23,369      83,884             $24.11

                                                                     OFFICE DEVELOPMENT PIPELINE
                                                                     Houston’s development activity increased slightly during the second quarter, with six
                                                                     projects under construction. The Redstone Group in partnership with Stream Realty
                                                                     Partners held a groundbreaking ceremony in June for BBVA Compass Bank’s new
                    5 6
                                                                     home, 2200 Post Oak Blvd. The 306,000 square foot, Class A office building is
               2                                                     scheduled for completion in April 2013. BBVA Compass Bank will occupy about half of
                                                                     the building.
                                 4
                                                                     Griffin Partners’ four-story, 102,000 SF Nassau Bay Town Square office building is
                                                                     located in the NASA/Clear Lake submarket. This pre-certified LEED Silver office building
                                                                     is scheduled to come on line 60% pre-leased with Hamilton Sundstrand Corporation as
                                                                     the lead tenant. Also included in the 781,000 SF currently under construction is
                                                                     Greenwood Corporation’s 156,000 SF Chasewood Crossing II in the FM 1960-Highway
                        1
                                                                     249 submarket (scheduled for completion in July 2011).

                                                                     Trammell Crow Company’s Hess Tower (formerly Discovery Tower) was delivered
                                                                     during the second quarter, adding 845,000 square feet to the CBD Class A office
                                                                     market. The building is 100% leased by Hess Corporation, who will be vacating their
                                                   3
                                                                     space in One Allen Center to move into the building sometime during the third quarter.

                                                                     Halliburton broke ground on a 100,000 SF office building located in its 94-acre North
                                                                     Belt Campus, situated just south of Beltway 8 and Houston’s George Bush
                                                                     Intercontinental Airport. The campus will house approximately 2,200 employees and
                                                                     includes a new Research and Development facility featuring state-of-the-art
                                                                     laboratories, two new parking garages, a new cafeteria and new childcare and employee
                                                                     wellness and fitness centers. The building is being developed by D. E. Harvey Builders
                                                                     and is scheduled for completion in January 2013.

  SELECT OFFICE BUILDINGS UNDER CONSTRUCTION
                                                                                                                                                                   EST.
           BUILDING NAME                        ADDRESS                       SUBMARKET                 SF          PRE-LEASED          DEVELOPER
                                                                                                                                                                 DELIVERY
 1 BBVA Compass/2200 Post Oak           2200 Post Oak Blvd.             Galleria/Uptown                306,012             51.1% Redstone and Stream               4/2013
 2 Chasewood Crossing II                19450 State Hwy 249             FM 1960/Hwy 249                156,000              0.0% Greenwood Corporation             7/2011
 3 Nassau Bay Town Square I             18050 Saturn Ln                 NASA/Clear Lake                100,000             60.0% Griffin Partners Inc.             9/2011
 4 Halliburton North Belt Campus        Milner Road                     North Belt/Greenspoint         100,000            100.0% D. E. Harvey Builders             1/2013
 5 Research Forest Lakeside 2           9320 Lakeside Blvd              Woodlands                       68,500              0.0% Warmack & Co                      9/2011
 6 Technology Forest Professional       4055 Technology Forest          Woodlands                       50,000             50.0% Woodlands Land Dev                12/2011
     Total SF Under Construction                                                                       780,512

                                                                                                                                           COLLIERS INTERNATIONAL | P. 7
RESEARCH & FORECAST REPORT | Q2 2011 | HOUSTON OFFICE MARKET


                                      Colliers International Statistics
                                      Revenues:                  $1.9 Billion
                                      Countries:                 61
                                      Offices:                   480
                                      Professionals & Staff:     15,052
                                      Brokers:                   4,788
                                      Square Feet Managed:       2.4 Billion
                                      Lease/Sale Transactions:   135,977
                                      Total Transaction Value:   $53 Billion


                                                                                COLLIERS INTERNATIONAL | HOUSTON
                                                                                1300 Post Oak Boulevard
                                                                                Suite 200
                                                                                Houston, Texas 77056
                                                                                MAIN +1 713 222 2111


                                                                                      Accelerating success.


                                                                                COLLIERS INTERNATIONAL | P. 8

More Related Content

What's hot

FHO Partners 4Q 2010 Market Report
FHO Partners 4Q 2010 Market ReportFHO Partners 4Q 2010 Market Report
FHO Partners 4Q 2010 Market Reportfhopartners
 
Q2 2011 Houston Industrial Market Report
Q2 2011 Houston Industrial Market ReportQ2 2011 Houston Industrial Market Report
Q2 2011 Houston Industrial Market ReportCoy Davidson
 
Houston Industrial Market Report 1Q 2011
Houston Industrial Market Report 1Q 2011Houston Industrial Market Report 1Q 2011
Houston Industrial Market Report 1Q 2011Coy Davidson
 
Q4 2011 Houston Industrial Market Report
Q4 2011 Houston Industrial Market ReportQ4 2011 Houston Industrial Market Report
Q4 2011 Houston Industrial Market ReportCoy Davidson
 
Houston Industrial Market Report 4Q 2010
Houston Industrial Market Report 4Q 2010Houston Industrial Market Report 4Q 2010
Houston Industrial Market Report 4Q 2010Coy Davidson
 
Houston 2Q 2012 Medical Office Report
Houston 2Q 2012 Medical Office ReportHouston 2Q 2012 Medical Office Report
Houston 2Q 2012 Medical Office ReportCoy Davidson
 
Cincinnati OH Office Trends Q3 2011
Cincinnati OH Office Trends Q3 2011Cincinnati OH Office Trends Q3 2011
Cincinnati OH Office Trends Q3 2011colliersohio
 
Q1 2013 Houston Office Market Report
Q1 2013 Houston Office Market ReportQ1 2013 Houston Office Market Report
Q1 2013 Houston Office Market ReportCoy Davidson
 
North American Office Highlights 4Q 2010
North American Office Highlights 4Q 2010North American Office Highlights 4Q 2010
North American Office Highlights 4Q 2010Coy Davidson
 
Q4 2011 - Columbus Office
Q4 2011 - Columbus OfficeQ4 2011 - Columbus Office
Q4 2011 - Columbus Officecolliersohio
 
North American Office Highlights 2Q 2010
North American Office Highlights 2Q 2010North American Office Highlights 2Q 2010
North American Office Highlights 2Q 2010Coy Davidson
 
North American Industrial Highlights 4Q 2010
North American Industrial Highlights 4Q 2010North American Industrial Highlights 4Q 2010
North American Industrial Highlights 4Q 2010Coy Davidson
 
National Office Highlight - Q1 2012
National Office Highlight - Q1 2012National Office Highlight - Q1 2012
National Office Highlight - Q1 2012Jeff Tolrud
 
North American Office Highlights Q1 2012
North American Office Highlights Q1 2012North American Office Highlights Q1 2012
North American Office Highlights Q1 2012Coy Davidson
 
Houston Office 3rd Q2011
Houston Office 3rd Q2011Houston Office 3rd Q2011
Houston Office 3rd Q2011cgoliver
 
Colliers North American Industrial Highlights 4Q-11
Colliers North American Industrial Highlights 4Q-11Colliers North American Industrial Highlights 4Q-11
Colliers North American Industrial Highlights 4Q-11Coy Davidson
 
Jll Louisville Industrial Outlook - Q1 2020
Jll Louisville Industrial Outlook - Q1 2020Jll Louisville Industrial Outlook - Q1 2020
Jll Louisville Industrial Outlook - Q1 2020Alex Westcott
 
Single Tenant NNN Research Report Q4
Single Tenant NNN Research Report Q4Single Tenant NNN Research Report Q4
Single Tenant NNN Research Report Q4The Boulder Group
 

What's hot (20)

FHO Partners 4Q 2010 Market Report
FHO Partners 4Q 2010 Market ReportFHO Partners 4Q 2010 Market Report
FHO Partners 4Q 2010 Market Report
 
Q2 2011 Houston Industrial Market Report
Q2 2011 Houston Industrial Market ReportQ2 2011 Houston Industrial Market Report
Q2 2011 Houston Industrial Market Report
 
Houston Industrial Market Report 1Q 2011
Houston Industrial Market Report 1Q 2011Houston Industrial Market Report 1Q 2011
Houston Industrial Market Report 1Q 2011
 
Q4 2011 Houston Industrial Market Report
Q4 2011 Houston Industrial Market ReportQ4 2011 Houston Industrial Market Report
Q4 2011 Houston Industrial Market Report
 
Houston Industrial Market Report 4Q 2010
Houston Industrial Market Report 4Q 2010Houston Industrial Market Report 4Q 2010
Houston Industrial Market Report 4Q 2010
 
Q3 2012 Houston Office Market Research Report
Q3 2012 Houston Office Market Research ReportQ3 2012 Houston Office Market Research Report
Q3 2012 Houston Office Market Research Report
 
Houston 2Q 2012 Medical Office Report
Houston 2Q 2012 Medical Office ReportHouston 2Q 2012 Medical Office Report
Houston 2Q 2012 Medical Office Report
 
Cincinnati OH Office Trends Q3 2011
Cincinnati OH Office Trends Q3 2011Cincinnati OH Office Trends Q3 2011
Cincinnati OH Office Trends Q3 2011
 
Q1 2013 Houston Office Market Report
Q1 2013 Houston Office Market ReportQ1 2013 Houston Office Market Report
Q1 2013 Houston Office Market Report
 
North American Office Highlights 4Q 2010
North American Office Highlights 4Q 2010North American Office Highlights 4Q 2010
North American Office Highlights 4Q 2010
 
Q4 2011 - Columbus Office
Q4 2011 - Columbus OfficeQ4 2011 - Columbus Office
Q4 2011 - Columbus Office
 
North American Office Highlights 2Q 2010
North American Office Highlights 2Q 2010North American Office Highlights 2Q 2010
North American Office Highlights 2Q 2010
 
North American Industrial Highlights 4Q 2010
North American Industrial Highlights 4Q 2010North American Industrial Highlights 4Q 2010
North American Industrial Highlights 4Q 2010
 
National Office Highlight - Q1 2012
National Office Highlight - Q1 2012National Office Highlight - Q1 2012
National Office Highlight - Q1 2012
 
North American Office Highlights Q1 2012
North American Office Highlights Q1 2012North American Office Highlights Q1 2012
North American Office Highlights Q1 2012
 
Office q4 2011
Office q4 2011Office q4 2011
Office q4 2011
 
Houston Office 3rd Q2011
Houston Office 3rd Q2011Houston Office 3rd Q2011
Houston Office 3rd Q2011
 
Colliers North American Industrial Highlights 4Q-11
Colliers North American Industrial Highlights 4Q-11Colliers North American Industrial Highlights 4Q-11
Colliers North American Industrial Highlights 4Q-11
 
Jll Louisville Industrial Outlook - Q1 2020
Jll Louisville Industrial Outlook - Q1 2020Jll Louisville Industrial Outlook - Q1 2020
Jll Louisville Industrial Outlook - Q1 2020
 
Single Tenant NNN Research Report Q4
Single Tenant NNN Research Report Q4Single Tenant NNN Research Report Q4
Single Tenant NNN Research Report Q4
 

Viewers also liked

Request for Conciliation Conference
Request for Conciliation ConferenceRequest for Conciliation Conference
Request for Conciliation Conferencetaxman taxman
 
ANALYSIS FOR SEN BEGICH - USMMA and SMAs[1]
ANALYSIS FOR SEN BEGICH - USMMA and SMAs[1]ANALYSIS FOR SEN BEGICH - USMMA and SMAs[1]
ANALYSIS FOR SEN BEGICH - USMMA and SMAs[1]Justin Harts
 
Sa 8th Cir Rose Tulane
Sa 8th Cir Rose TulaneSa 8th Cir Rose Tulane
Sa 8th Cir Rose Tulaneguest90299f9
 
Gs Rubber Industries
Gs Rubber IndustriesGs Rubber Industries
Gs Rubber Industriesjrodriguesjr
 
Guiness Book Of Engineering Feats
Guiness Book Of Engineering FeatsGuiness Book Of Engineering Feats
Guiness Book Of Engineering Featsrcc
 
Brand Strategy Marketing Exercises - GrowthPanel.Com
Brand Strategy Marketing Exercises - GrowthPanel.ComBrand Strategy Marketing Exercises - GrowthPanel.Com
Brand Strategy Marketing Exercises - GrowthPanel.ComModerandi Inc.
 
California New Client Invitation Overview
California New Client Invitation OverviewCalifornia New Client Invitation Overview
California New Client Invitation Overviewslingenfelder
 
Special Equity Access Schemes
Special Equity Access SchemesSpecial Equity Access Schemes
Special Equity Access Schemesrdk.rdk
 
Pms optional papers
Pms optional papersPms optional papers
Pms optional papersshahid khan
 
Press Release Brown_ Joseph Ltd. SSAE 16 Certification
Press Release Brown_ Joseph Ltd. SSAE 16 CertificationPress Release Brown_ Joseph Ltd. SSAE 16 Certification
Press Release Brown_ Joseph Ltd. SSAE 16 Certificationdfalletti
 
Detroit Public Schools Testimony Opening Statement
Detroit Public Schools Testimony Opening StatementDetroit Public Schools Testimony Opening Statement
Detroit Public Schools Testimony Opening StatementKenneth Burnley
 
Don't Risk Your Reputation or Your Mainframe: Best Practices for Demonstratin...
Don't Risk Your Reputation or Your Mainframe: Best Practices for Demonstratin...Don't Risk Your Reputation or Your Mainframe: Best Practices for Demonstratin...
Don't Risk Your Reputation or Your Mainframe: Best Practices for Demonstratin...IBM Security
 
Gauthier, Joshua 2011 Hr Resume[1]
Gauthier, Joshua 2011 Hr Resume[1]Gauthier, Joshua 2011 Hr Resume[1]
Gauthier, Joshua 2011 Hr Resume[1]joshg30
 

Viewers also liked (19)

Request for Conciliation Conference
Request for Conciliation ConferenceRequest for Conciliation Conference
Request for Conciliation Conference
 
Baza bogdan
Baza bogdanBaza bogdan
Baza bogdan
 
ANALYSIS FOR SEN BEGICH - USMMA and SMAs[1]
ANALYSIS FOR SEN BEGICH - USMMA and SMAs[1]ANALYSIS FOR SEN BEGICH - USMMA and SMAs[1]
ANALYSIS FOR SEN BEGICH - USMMA and SMAs[1]
 
IMC: risk base security
IMC: risk base securityIMC: risk base security
IMC: risk base security
 
Bje final present-v.1.0
Bje final present-v.1.0Bje final present-v.1.0
Bje final present-v.1.0
 
Sa 8th Cir Rose Tulane
Sa 8th Cir Rose TulaneSa 8th Cir Rose Tulane
Sa 8th Cir Rose Tulane
 
Dsme Brochure Final
Dsme Brochure FinalDsme Brochure Final
Dsme Brochure Final
 
Gs Rubber Industries
Gs Rubber IndustriesGs Rubber Industries
Gs Rubber Industries
 
Guiness Book Of Engineering Feats
Guiness Book Of Engineering FeatsGuiness Book Of Engineering Feats
Guiness Book Of Engineering Feats
 
Brand Strategy Marketing Exercises - GrowthPanel.Com
Brand Strategy Marketing Exercises - GrowthPanel.ComBrand Strategy Marketing Exercises - GrowthPanel.Com
Brand Strategy Marketing Exercises - GrowthPanel.Com
 
California New Client Invitation Overview
California New Client Invitation OverviewCalifornia New Client Invitation Overview
California New Client Invitation Overview
 
Special Equity Access Schemes
Special Equity Access SchemesSpecial Equity Access Schemes
Special Equity Access Schemes
 
Pms optional papers
Pms optional papersPms optional papers
Pms optional papers
 
Ace Market Listing Requirements July 2009
Ace Market Listing Requirements July 2009Ace Market Listing Requirements July 2009
Ace Market Listing Requirements July 2009
 
Press Release Brown_ Joseph Ltd. SSAE 16 Certification
Press Release Brown_ Joseph Ltd. SSAE 16 CertificationPress Release Brown_ Joseph Ltd. SSAE 16 Certification
Press Release Brown_ Joseph Ltd. SSAE 16 Certification
 
2009 Donor Report - East Tennessee Children's Hospital
2009 Donor Report - East Tennessee Children's Hospital2009 Donor Report - East Tennessee Children's Hospital
2009 Donor Report - East Tennessee Children's Hospital
 
Detroit Public Schools Testimony Opening Statement
Detroit Public Schools Testimony Opening StatementDetroit Public Schools Testimony Opening Statement
Detroit Public Schools Testimony Opening Statement
 
Don't Risk Your Reputation or Your Mainframe: Best Practices for Demonstratin...
Don't Risk Your Reputation or Your Mainframe: Best Practices for Demonstratin...Don't Risk Your Reputation or Your Mainframe: Best Practices for Demonstratin...
Don't Risk Your Reputation or Your Mainframe: Best Practices for Demonstratin...
 
Gauthier, Joshua 2011 Hr Resume[1]
Gauthier, Joshua 2011 Hr Resume[1]Gauthier, Joshua 2011 Hr Resume[1]
Gauthier, Joshua 2011 Hr Resume[1]
 

Similar to Houston Office Market Sees Positive Absorption in Q2 2011

Houston Office Market Report 1Q-2011
Houston Office Market Report 1Q-2011Houston Office Market Report 1Q-2011
Houston Office Market Report 1Q-2011Coy Davidson
 
Q4 2010 Houston Office Market Research
Q4 2010 Houston Office Market ResearchQ4 2010 Houston Office Market Research
Q4 2010 Houston Office Market ResearchCoy Davidson
 
Q3 2012 Houston Office Market Report
Q3 2012 Houston Office Market ReportQ3 2012 Houston Office Market Report
Q3 2012 Houston Office Market ReportCoy Davidson
 
Houston office market report 3 q 10
Houston office market report 3 q 10Houston office market report 3 q 10
Houston office market report 3 q 10Coy Davidson
 
Q4 2012 office_market_research_report
Q4 2012 office_market_research_reportQ4 2012 office_market_research_report
Q4 2012 office_market_research_reportLisa Bridges
 
Houston Medical Office Report 4Q-12
Houston Medical Office Report 4Q-12Houston Medical Office Report 4Q-12
Houston Medical Office Report 4Q-12Coy Davidson
 
2012 4 q_houston_retail__market_report
2012 4 q_houston_retail__market_report2012 4 q_houston_retail__market_report
2012 4 q_houston_retail__market_reportLisa Bridges
 
2 Q11 Market Beat Industrial Lv
2 Q11 Market Beat Industrial Lv2 Q11 Market Beat Industrial Lv
2 Q11 Market Beat Industrial LvJessica Parrish
 
Q2 2012 Houston Industrial Market Report
Q2 2012 Houston Industrial Market ReportQ2 2012 Houston Industrial Market Report
Q2 2012 Houston Industrial Market ReportCoy Davidson
 
Q4 2012 houston_industrial_market_report
Q4 2012 houston_industrial_market_reportQ4 2012 houston_industrial_market_report
Q4 2012 houston_industrial_market_reportLisa Bridges
 
FHO Partners 3Q 2010 Market Report
FHO Partners 3Q 2010 Market ReportFHO Partners 3Q 2010 Market Report
FHO Partners 3Q 2010 Market Reportfhopartners
 
Industrial re a4 2010
Industrial re a4 2010Industrial re a4 2010
Industrial re a4 2010Translinked
 
Cincinnati OH Industrial Trends Q3 2011
Cincinnati OH Industrial Trends Q3 2011Cincinnati OH Industrial Trends Q3 2011
Cincinnati OH Industrial Trends Q3 2011colliersohio
 
Q32011 Cincinnati Industrial Market Report
Q32011 Cincinnati Industrial Market ReportQ32011 Cincinnati Industrial Market Report
Q32011 Cincinnati Industrial Market ReportChristieGraver
 
Q4 2011 - Columbus Retail
Q4 2011 - Columbus RetailQ4 2011 - Columbus Retail
Q4 2011 - Columbus Retailcolliersohio
 

Similar to Houston Office Market Sees Positive Absorption in Q2 2011 (17)

Houston Office Market Report 1Q-2011
Houston Office Market Report 1Q-2011Houston Office Market Report 1Q-2011
Houston Office Market Report 1Q-2011
 
Q4 2010 Houston Office Market Research
Q4 2010 Houston Office Market ResearchQ4 2010 Houston Office Market Research
Q4 2010 Houston Office Market Research
 
Q3 2012 Houston Office Market Report
Q3 2012 Houston Office Market ReportQ3 2012 Houston Office Market Report
Q3 2012 Houston Office Market Report
 
Q3 2012 Houston Office Market Research Report
Q3 2012 Houston Office Market Research ReportQ3 2012 Houston Office Market Research Report
Q3 2012 Houston Office Market Research Report
 
Houston office market report 3 q 10
Houston office market report 3 q 10Houston office market report 3 q 10
Houston office market report 3 q 10
 
Q4 2012 office_market_research_report
Q4 2012 office_market_research_reportQ4 2012 office_market_research_report
Q4 2012 office_market_research_report
 
Houston Medical Office Report 4Q-12
Houston Medical Office Report 4Q-12Houston Medical Office Report 4Q-12
Houston Medical Office Report 4Q-12
 
2012 4 q_houston_retail__market_report
2012 4 q_houston_retail__market_report2012 4 q_houston_retail__market_report
2012 4 q_houston_retail__market_report
 
2 Q11 Market Beat Industrial Lv
2 Q11 Market Beat Industrial Lv2 Q11 Market Beat Industrial Lv
2 Q11 Market Beat Industrial Lv
 
Q2 2012 Houston Industrial Market Report
Q2 2012 Houston Industrial Market ReportQ2 2012 Houston Industrial Market Report
Q2 2012 Houston Industrial Market Report
 
Trends 2012 Houston Market Slides
Trends 2012 Houston Market SlidesTrends 2012 Houston Market Slides
Trends 2012 Houston Market Slides
 
Q4 2012 houston_industrial_market_report
Q4 2012 houston_industrial_market_reportQ4 2012 houston_industrial_market_report
Q4 2012 houston_industrial_market_report
 
FHO Partners 3Q 2010 Market Report
FHO Partners 3Q 2010 Market ReportFHO Partners 3Q 2010 Market Report
FHO Partners 3Q 2010 Market Report
 
Industrial re a4 2010
Industrial re a4 2010Industrial re a4 2010
Industrial re a4 2010
 
Cincinnati OH Industrial Trends Q3 2011
Cincinnati OH Industrial Trends Q3 2011Cincinnati OH Industrial Trends Q3 2011
Cincinnati OH Industrial Trends Q3 2011
 
Q32011 Cincinnati Industrial Market Report
Q32011 Cincinnati Industrial Market ReportQ32011 Cincinnati Industrial Market Report
Q32011 Cincinnati Industrial Market Report
 
Q4 2011 - Columbus Retail
Q4 2011 - Columbus RetailQ4 2011 - Columbus Retail
Q4 2011 - Columbus Retail
 

More from Coy Davidson

The Future of Work from Home
The Future of Work from HomeThe Future of Work from Home
The Future of Work from HomeCoy Davidson
 
Occupier Services CoreNetWebinarTakeaways
Occupier Services CoreNetWebinarTakeaways Occupier Services CoreNetWebinarTakeaways
Occupier Services CoreNetWebinarTakeaways Coy Davidson
 
Leading Occupiers to the New Normal
Leading Occupiers to the New NormalLeading Occupiers to the New Normal
Leading Occupiers to the New NormalCoy Davidson
 
Houston Methodist and Colliers International Houston
Houston Methodist and Colliers International HoustonHouston Methodist and Colliers International Houston
Houston Methodist and Colliers International HoustonCoy Davidson
 
2017 Healthcare Marketplace
2017 Healthcare Marketplace2017 Healthcare Marketplace
2017 Healthcare MarketplaceCoy Davidson
 
Colliers International Houston Trends 2017
Colliers International Houston Trends 2017Colliers International Houston Trends 2017
Colliers International Houston Trends 2017Coy Davidson
 
2016 Houston Economic Outlook
2016 Houston Economic Outlook2016 Houston Economic Outlook
2016 Houston Economic OutlookCoy Davidson
 
2016 Healthcare Real Estate Marketplace
2016 Healthcare Real Estate Marketplace2016 Healthcare Real Estate Marketplace
2016 Healthcare Real Estate MarketplaceCoy Davidson
 
Houston Healthcare Real Estate Market Report - Year End 2015
Houston Healthcare Real Estate Market Report - Year End 2015Houston Healthcare Real Estate Market Report - Year End 2015
Houston Healthcare Real Estate Market Report - Year End 2015Coy Davidson
 
Top Office Metros 2015 4Q
Top Office Metros 2015 4Q Top Office Metros 2015 4Q
Top Office Metros 2015 4Q Coy Davidson
 
Colliers Houston Trends 2016 slides
Colliers Houston Trends 2016 slidesColliers Houston Trends 2016 slides
Colliers Houston Trends 2016 slidesCoy Davidson
 
Cre tech year end report 2015
Cre tech year end report 2015Cre tech year end report 2015
Cre tech year end report 2015Coy Davidson
 
Q4 2014 San Francisco Office Report
Q4 2014 San Francisco Office ReportQ4 2014 San Francisco Office Report
Q4 2014 San Francisco Office ReportCoy Davidson
 
Houston Medical Office Report and Healthcare Commentary
Houston Medical Office Report and Healthcare CommentaryHouston Medical Office Report and Healthcare Commentary
Houston Medical Office Report and Healthcare CommentaryCoy Davidson
 
Boma standards-update
Boma standards-update Boma standards-update
Boma standards-update Coy Davidson
 
SIOR: Understanding the Common Factor
SIOR: Understanding the Common FactorSIOR: Understanding the Common Factor
SIOR: Understanding the Common FactorCoy Davidson
 
North American Industrial Outlook Q4 13
North American Industrial Outlook Q4 13North American Industrial Outlook Q4 13
North American Industrial Outlook Q4 13Coy Davidson
 
Colliers Medical Office-Update
Colliers Medical Office-Update Colliers Medical Office-Update
Colliers Medical Office-Update Coy Davidson
 

More from Coy Davidson (20)

The Future of Work from Home
The Future of Work from HomeThe Future of Work from Home
The Future of Work from Home
 
Occupier Services CoreNetWebinarTakeaways
Occupier Services CoreNetWebinarTakeaways Occupier Services CoreNetWebinarTakeaways
Occupier Services CoreNetWebinarTakeaways
 
Horizon Tower
Horizon TowerHorizon Tower
Horizon Tower
 
Leading Occupiers to the New Normal
Leading Occupiers to the New NormalLeading Occupiers to the New Normal
Leading Occupiers to the New Normal
 
Houston Methodist and Colliers International Houston
Houston Methodist and Colliers International HoustonHouston Methodist and Colliers International Houston
Houston Methodist and Colliers International Houston
 
2017 Healthcare Marketplace
2017 Healthcare Marketplace2017 Healthcare Marketplace
2017 Healthcare Marketplace
 
Colliers International Houston Trends 2017
Colliers International Houston Trends 2017Colliers International Houston Trends 2017
Colliers International Houston Trends 2017
 
2016 Houston Economic Outlook
2016 Houston Economic Outlook2016 Houston Economic Outlook
2016 Houston Economic Outlook
 
2016 Healthcare Real Estate Marketplace
2016 Healthcare Real Estate Marketplace2016 Healthcare Real Estate Marketplace
2016 Healthcare Real Estate Marketplace
 
Houston Healthcare Real Estate Market Report - Year End 2015
Houston Healthcare Real Estate Market Report - Year End 2015Houston Healthcare Real Estate Market Report - Year End 2015
Houston Healthcare Real Estate Market Report - Year End 2015
 
Top Office Metros 2015 4Q
Top Office Metros 2015 4Q Top Office Metros 2015 4Q
Top Office Metros 2015 4Q
 
Colliers Houston Trends 2016 slides
Colliers Houston Trends 2016 slidesColliers Houston Trends 2016 slides
Colliers Houston Trends 2016 slides
 
Cre tech year end report 2015
Cre tech year end report 2015Cre tech year end report 2015
Cre tech year end report 2015
 
Q4 2014 San Francisco Office Report
Q4 2014 San Francisco Office ReportQ4 2014 San Francisco Office Report
Q4 2014 San Francisco Office Report
 
Houston Medical Office Report and Healthcare Commentary
Houston Medical Office Report and Healthcare CommentaryHouston Medical Office Report and Healthcare Commentary
Houston Medical Office Report and Healthcare Commentary
 
Colliers
Colliers Colliers
Colliers
 
Boma standards-update
Boma standards-update Boma standards-update
Boma standards-update
 
SIOR: Understanding the Common Factor
SIOR: Understanding the Common FactorSIOR: Understanding the Common Factor
SIOR: Understanding the Common Factor
 
North American Industrial Outlook Q4 13
North American Industrial Outlook Q4 13North American Industrial Outlook Q4 13
North American Industrial Outlook Q4 13
 
Colliers Medical Office-Update
Colliers Medical Office-Update Colliers Medical Office-Update
Colliers Medical Office-Update
 

Recently uploaded

Call girls in Jeewan Park .Delhi↫8447779280↬ ꧂Escorts Service In Delhi Ncr
Call girls in Jeewan Park .Delhi↫8447779280↬ ꧂Escorts Service In Delhi NcrCall girls in Jeewan Park .Delhi↫8447779280↬ ꧂Escorts Service In Delhi Ncr
Call girls in Jeewan Park .Delhi↫8447779280↬ ꧂Escorts Service In Delhi Ncrasmaqueen5
 
9990771857 Call Girls in Noida Sector 06 Noida (Call Girls) Delhi
9990771857 Call Girls in Noida Sector 06 Noida (Call Girls) Delhi9990771857 Call Girls in Noida Sector 06 Noida (Call Girls) Delhi
9990771857 Call Girls in Noida Sector 06 Noida (Call Girls) Delhidelhimodel235
 
Call Girls in Noida Sector 12 Noida 💯Call Us 🔝 9582086666 🔝 South Delhi Escor...
Call Girls in Noida Sector 12 Noida 💯Call Us 🔝 9582086666 🔝 South Delhi Escor...Call Girls in Noida Sector 12 Noida 💯Call Us 🔝 9582086666 🔝 South Delhi Escor...
Call Girls in Noida Sector 12 Noida 💯Call Us 🔝 9582086666 🔝 South Delhi Escor...delhimodel235
 
Sankla East World Hadapsar Pune E-Brochure.pdf
Sankla East World Hadapsar Pune  E-Brochure.pdfSankla East World Hadapsar Pune  E-Brochure.pdf
Sankla East World Hadapsar Pune E-Brochure.pdfManishSaxena95
 
Model Call Girl in Shastri Nagar Delhi reach out to us at 🔝8264348440🔝
Model Call Girl in Shastri Nagar Delhi reach out to us at 🔝8264348440🔝Model Call Girl in Shastri Nagar Delhi reach out to us at 🔝8264348440🔝
Model Call Girl in Shastri Nagar Delhi reach out to us at 🔝8264348440🔝soniya singh
 
Call Girls in Inderpuri Delhi 💯Call Us 🔝8264348440🔝
Call Girls in Inderpuri Delhi 💯Call Us 🔝8264348440🔝Call Girls in Inderpuri Delhi 💯Call Us 🔝8264348440🔝
Call Girls in Inderpuri Delhi 💯Call Us 🔝8264348440🔝soniya singh
 
Listing Turkey Sylvana Istanbul - Bahcesehir
Listing Turkey Sylvana Istanbul - BahcesehirListing Turkey Sylvana Istanbul - Bahcesehir
Listing Turkey Sylvana Istanbul - BahcesehirListing Turkey
 
call girls in Shahdara (DELHI) 🔝 >༒9953330565🔝 genuine Escort Service 🔝✔️✔️
call girls in Shahdara (DELHI) 🔝 >༒9953330565🔝 genuine Escort Service 🔝✔️✔️call girls in Shahdara (DELHI) 🔝 >༒9953330565🔝 genuine Escort Service 🔝✔️✔️
call girls in Shahdara (DELHI) 🔝 >༒9953330565🔝 genuine Escort Service 🔝✔️✔️9953056974 Low Rate Call Girls In Saket, Delhi NCR
 
Purva Palm Hills Devanahalli, Bangalore E- Brochure.pdf
Purva Palm Hills Devanahalli, Bangalore E- Brochure.pdfPurva Palm Hills Devanahalli, Bangalore E- Brochure.pdf
Purva Palm Hills Devanahalli, Bangalore E- Brochure.pdffaheemali990101
 
Call Girls In Mayur Vihar Delhi ☆↫8447779280 ❤Escorts Service In Delhi
Call Girls In Mayur Vihar Delhi ☆↫8447779280 ❤Escorts Service In DelhiCall Girls In Mayur Vihar Delhi ☆↫8447779280 ❤Escorts Service In Delhi
Call Girls In Mayur Vihar Delhi ☆↫8447779280 ❤Escorts Service In Delhiasmaqueen5
 
Call Girls in Janakpuri ↫8447779280↫Short 1500 Night 6000-Escorts Service In ...
Call Girls in Janakpuri ↫8447779280↫Short 1500 Night 6000-Escorts Service In ...Call Girls in Janakpuri ↫8447779280↫Short 1500 Night 6000-Escorts Service In ...
Call Girls in Janakpuri ↫8447779280↫Short 1500 Night 6000-Escorts Service In ...asmaqueen5
 
Low Rate Call Girls in Trilokpuri Delhi Call 9990771857
Low Rate Call Girls in Trilokpuri Delhi Call 9990771857Low Rate Call Girls in Trilokpuri Delhi Call 9990771857
Low Rate Call Girls in Trilokpuri Delhi Call 9990771857delhimodel235
 
call girls in ganesh nagar Delhi 8264348440 ✅ call girls ❤️
call girls in ganesh nagar Delhi 8264348440 ✅ call girls ❤️call girls in ganesh nagar Delhi 8264348440 ✅ call girls ❤️
call girls in ganesh nagar Delhi 8264348440 ✅ call girls ❤️soniya singh
 
Puravankara Mundhwa Pune E-Brochure.pdf
Puravankara Mundhwa Pune  E-Brochure.pdfPuravankara Mundhwa Pune  E-Brochure.pdf
Puravankara Mundhwa Pune E-Brochure.pdfManishSaxena95
 
Call Girls in laxmi Nagar Delhi 💯Call Us 🔝 9582086666🔝 South Delhi Escorts Se...
Call Girls in laxmi Nagar Delhi 💯Call Us 🔝 9582086666🔝 South Delhi Escorts Se...Call Girls in laxmi Nagar Delhi 💯Call Us 🔝 9582086666🔝 South Delhi Escorts Se...
Call Girls in laxmi Nagar Delhi 💯Call Us 🔝 9582086666🔝 South Delhi Escorts Se...delhimodel235
 
9711199012 Call {Girls Delhi} Very Low rate Vaishali DownLoad PDF
9711199012 Call {Girls Delhi} Very Low rate Vaishali DownLoad PDF9711199012 Call {Girls Delhi} Very Low rate Vaishali DownLoad PDF
9711199012 Call {Girls Delhi} Very Low rate Vaishali DownLoad PDFMs Riya
 
9990771857 Call Girls in Noida Sector 03 Noida (Call Girls) Delhi
9990771857 Call Girls in Noida Sector 03 Noida (Call Girls) Delhi9990771857 Call Girls in Noida Sector 03 Noida (Call Girls) Delhi
9990771857 Call Girls in Noida Sector 03 Noida (Call Girls) Delhidelhimodel235
 
9990771857 Call Girls in Noida Sector 10 Noida (Call Girls) Delhi
9990771857 Call Girls in Noida Sector 10 Noida (Call Girls) Delhi9990771857 Call Girls in Noida Sector 10 Noida (Call Girls) Delhi
9990771857 Call Girls in Noida Sector 10 Noida (Call Girls) Delhidelhimodel235
 
Call Girls in Khan Market 9654467111 ESCORTS SERVICE
Call Girls in Khan Market 9654467111 ESCORTS SERVICECall Girls in Khan Market 9654467111 ESCORTS SERVICE
Call Girls in Khan Market 9654467111 ESCORTS SERVICESapana Sha
 

Recently uploaded (20)

Call girls in Jeewan Park .Delhi↫8447779280↬ ꧂Escorts Service In Delhi Ncr
Call girls in Jeewan Park .Delhi↫8447779280↬ ꧂Escorts Service In Delhi NcrCall girls in Jeewan Park .Delhi↫8447779280↬ ꧂Escorts Service In Delhi Ncr
Call girls in Jeewan Park .Delhi↫8447779280↬ ꧂Escorts Service In Delhi Ncr
 
9990771857 Call Girls in Noida Sector 06 Noida (Call Girls) Delhi
9990771857 Call Girls in Noida Sector 06 Noida (Call Girls) Delhi9990771857 Call Girls in Noida Sector 06 Noida (Call Girls) Delhi
9990771857 Call Girls in Noida Sector 06 Noida (Call Girls) Delhi
 
Call Girls in Noida Sector 12 Noida 💯Call Us 🔝 9582086666 🔝 South Delhi Escor...
Call Girls in Noida Sector 12 Noida 💯Call Us 🔝 9582086666 🔝 South Delhi Escor...Call Girls in Noida Sector 12 Noida 💯Call Us 🔝 9582086666 🔝 South Delhi Escor...
Call Girls in Noida Sector 12 Noida 💯Call Us 🔝 9582086666 🔝 South Delhi Escor...
 
Sankla East World Hadapsar Pune E-Brochure.pdf
Sankla East World Hadapsar Pune  E-Brochure.pdfSankla East World Hadapsar Pune  E-Brochure.pdf
Sankla East World Hadapsar Pune E-Brochure.pdf
 
Model Call Girl in Shastri Nagar Delhi reach out to us at 🔝8264348440🔝
Model Call Girl in Shastri Nagar Delhi reach out to us at 🔝8264348440🔝Model Call Girl in Shastri Nagar Delhi reach out to us at 🔝8264348440🔝
Model Call Girl in Shastri Nagar Delhi reach out to us at 🔝8264348440🔝
 
Call Girls in Inderpuri Delhi 💯Call Us 🔝8264348440🔝
Call Girls in Inderpuri Delhi 💯Call Us 🔝8264348440🔝Call Girls in Inderpuri Delhi 💯Call Us 🔝8264348440🔝
Call Girls in Inderpuri Delhi 💯Call Us 🔝8264348440🔝
 
Listing Turkey Sylvana Istanbul - Bahcesehir
Listing Turkey Sylvana Istanbul - BahcesehirListing Turkey Sylvana Istanbul - Bahcesehir
Listing Turkey Sylvana Istanbul - Bahcesehir
 
call girls in Shahdara (DELHI) 🔝 >༒9953330565🔝 genuine Escort Service 🔝✔️✔️
call girls in Shahdara (DELHI) 🔝 >༒9953330565🔝 genuine Escort Service 🔝✔️✔️call girls in Shahdara (DELHI) 🔝 >༒9953330565🔝 genuine Escort Service 🔝✔️✔️
call girls in Shahdara (DELHI) 🔝 >༒9953330565🔝 genuine Escort Service 🔝✔️✔️
 
Purva Palm Hills Devanahalli, Bangalore E- Brochure.pdf
Purva Palm Hills Devanahalli, Bangalore E- Brochure.pdfPurva Palm Hills Devanahalli, Bangalore E- Brochure.pdf
Purva Palm Hills Devanahalli, Bangalore E- Brochure.pdf
 
Call Girls In Mayur Vihar Delhi ☆↫8447779280 ❤Escorts Service In Delhi
Call Girls In Mayur Vihar Delhi ☆↫8447779280 ❤Escorts Service In DelhiCall Girls In Mayur Vihar Delhi ☆↫8447779280 ❤Escorts Service In Delhi
Call Girls In Mayur Vihar Delhi ☆↫8447779280 ❤Escorts Service In Delhi
 
Call Girls in Janakpuri ↫8447779280↫Short 1500 Night 6000-Escorts Service In ...
Call Girls in Janakpuri ↫8447779280↫Short 1500 Night 6000-Escorts Service In ...Call Girls in Janakpuri ↫8447779280↫Short 1500 Night 6000-Escorts Service In ...
Call Girls in Janakpuri ↫8447779280↫Short 1500 Night 6000-Escorts Service In ...
 
Low Rate Call Girls in Trilokpuri Delhi Call 9990771857
Low Rate Call Girls in Trilokpuri Delhi Call 9990771857Low Rate Call Girls in Trilokpuri Delhi Call 9990771857
Low Rate Call Girls in Trilokpuri Delhi Call 9990771857
 
call girls in ganesh nagar Delhi 8264348440 ✅ call girls ❤️
call girls in ganesh nagar Delhi 8264348440 ✅ call girls ❤️call girls in ganesh nagar Delhi 8264348440 ✅ call girls ❤️
call girls in ganesh nagar Delhi 8264348440 ✅ call girls ❤️
 
Puravankara Mundhwa Pune E-Brochure.pdf
Puravankara Mundhwa Pune  E-Brochure.pdfPuravankara Mundhwa Pune  E-Brochure.pdf
Puravankara Mundhwa Pune E-Brochure.pdf
 
Call Girls in laxmi Nagar Delhi 💯Call Us 🔝 9582086666🔝 South Delhi Escorts Se...
Call Girls in laxmi Nagar Delhi 💯Call Us 🔝 9582086666🔝 South Delhi Escorts Se...Call Girls in laxmi Nagar Delhi 💯Call Us 🔝 9582086666🔝 South Delhi Escorts Se...
Call Girls in laxmi Nagar Delhi 💯Call Us 🔝 9582086666🔝 South Delhi Escorts Se...
 
9711199012 Call {Girls Delhi} Very Low rate Vaishali DownLoad PDF
9711199012 Call {Girls Delhi} Very Low rate Vaishali DownLoad PDF9711199012 Call {Girls Delhi} Very Low rate Vaishali DownLoad PDF
9711199012 Call {Girls Delhi} Very Low rate Vaishali DownLoad PDF
 
Low Rate Call Girls in Triveni Complex Delhi Call 9873940964
Low Rate Call Girls in Triveni Complex Delhi Call 9873940964Low Rate Call Girls in Triveni Complex Delhi Call 9873940964
Low Rate Call Girls in Triveni Complex Delhi Call 9873940964
 
9990771857 Call Girls in Noida Sector 03 Noida (Call Girls) Delhi
9990771857 Call Girls in Noida Sector 03 Noida (Call Girls) Delhi9990771857 Call Girls in Noida Sector 03 Noida (Call Girls) Delhi
9990771857 Call Girls in Noida Sector 03 Noida (Call Girls) Delhi
 
9990771857 Call Girls in Noida Sector 10 Noida (Call Girls) Delhi
9990771857 Call Girls in Noida Sector 10 Noida (Call Girls) Delhi9990771857 Call Girls in Noida Sector 10 Noida (Call Girls) Delhi
9990771857 Call Girls in Noida Sector 10 Noida (Call Girls) Delhi
 
Call Girls in Khan Market 9654467111 ESCORTS SERVICE
Call Girls in Khan Market 9654467111 ESCORTS SERVICECall Girls in Khan Market 9654467111 ESCORTS SERVICE
Call Girls in Khan Market 9654467111 ESCORTS SERVICE
 

Houston Office Market Sees Positive Absorption in Q2 2011

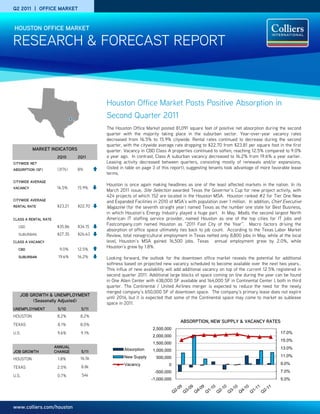
  • 1. Q2 2011 | OFFICE MARKET HOUSTON OFFICE MARKET RESEARCH & FORECAST REPORT Houston Office Market Posts Positive Absorption in Second Quarter 2011 The Houston Office Market posted 81,091 square feet of positive net absorption during the second quarter with the majority taking place in the suburban sector. Year-over-year vacancy rates decreased from 16.5% to 15.9% citywide. Rental rates continued to decrease during the second quarter, with the citywide average rate dropping to $22.70 from $23.81 per square foot in the first MARKET INDICATORS quarter. Vacancy in CBD Class A properties continued to soften, reaching 12.5% compared to 9.0% 2Q10 2Q11 a year ago. In contrast, Class A suburban vacancy decreased to 16.2% from 19.6% a year earlier. CITYWIDE NET Leasing activity decreased between quarters, consisting mostly of renewals and/or expansions, ABSORPTION (SF) (317k) 81k (listed in table on page 3 of this report), suggesting tenants took advantage of more favorable lease terms. CITYWIDE AVERAGE Houston is once again making headlines as one of the least affected markets in the nation. In its VACANCY 16.5% 15.9% March 2011 issue, Site Selection awarded Texas the Governor’s Cup for new project activity, with 424 projects of which 152 are located in the Houston MSA. Houston ranked #2 for Tier One New CITYWIDE AVERAGE and Expanded Facilities in 2010 of MSA’s with population over 1 million. In addition, Chief Executive RENTAL RATE $23.21 $22.70 Magazine (for the seventh straight year) named Texas as the number one state for Best Business, in which Houston’s Energy Industry played a huge part. In May, Modis, the second largest North CLASS A RENTAL RATE American IT staffing service provider, named Houston as one of the top cities for IT jobs and Fastcompany.com named Houston as “2011 Fast City of the Year”. Macro factors driving the CBD $35.86 $34.15 absorption of office space ultimately ties back to job count. According to the Texas Labor Market SUBURBAN $27.35 $26.63 Review, total nonagricultural employment in Texas netted only 8,800 jobs in May, while at the local CLASS A VACANCY level, Houston’s MSA gained 16,500 jobs. Texas annual employment grew by 2.0%, while Houston’s grew by 1.8%. CBD 9.0% 12.5% SUBURBAN 19.6% 16.2% Looking forward, the outlook for the downtown office market reveals the potential for additional softness based on projected new vacancy scheduled to become available over the next two years.. This influx of new availability will add additional vacancy on top of the current 12.5% registered in second quarter 2011. Additional large blocks of space coming on line during the year can be found in One Allen Center with 438,000 SF available and 164,000 SF in Continental Center I, both in third quarter. The Continental / United Airlines merger is expected to reduce the need for the newly merged company’s 650,000 SF of downtown space. The company’s primary lease does not expire JOB GROWTH & UNEMPLOYMENT until 2014, but it is expected that some of the Continental space may come to market as sublease (Seasonally Adjusted) space in 2011. UNEMPLOYMENT 5/10 5/11 HOUSTON 8.2% 8.2% ABSORPTION, NEW SUPPLY & VACANCY RATES TEXAS 8.1% 8.0% 2,500,000 U.S. 9.6% 9.1% 17.0% 2,000,000 15.0% 1,500,000 ANNUAL 13.0% Absorption JOB GROWTH CHANGE 5/11 1,000,000 New Supply 11.0% HOUSTON 1.8% 16.5k 500,000 Vacancy 0 9.0% TEXAS 2.0% 8.8k -500,000 7.0% U.S. 0.7% 54k -1,000,000 5.0% www.colliers.com/houston
  • 2. RESEARCH & FORECAST REPORT | Q2 2011 | HOUSTON OFFICE MARKET VACANCY & AVAILABILITY ABSORPTION & DEMAND Overall vacancy levels remained unchanged Houston recorded positive net absorption of between quarters, remaining at 15.9%. The 81,091 SF in the second quarter, compared to CBD VS. SUBURBAN average suburban vacancy rose by 10 basis (316,519) SF of negative net absorption at the points to 15.9% from 15.8% the previous same time last year. Contributing to the CLASS A OFFICE VACANCY quarter, while CBD vacancy remained the same quarters positive gain was Suburban Class A 20.0% at 16.0%. On a year-over-year basis, suburban space with positive net absorption of 261,138 18.0% vacancy decreased by 120 basis points to SF, followed by CBD Class A space with 16.0% 15.9% from 17.1%, and CBD increased 220 positive net absorption at 32,128 SF. Suburban 14.0% 12.0% basis points to 16.0% from 13.8%. Class B space had the largest amount of 10.0% Vacancy in CBD Class A properties continued negative absorption in second quarter 2011 with 8.0% to soften reaching 12.5% compared to 9.0% a (134,965) SF of negative net absorption 6.0% year ago. In contrast, CBD Cass B properties followed by suburban Class C space with 4.0% (64,587) SF of negative net absorption. decreased to 20.0% vacancy, down from 22.8% 12 months earlier. RENTAL RATES Although suburban vacancy rates remained in Citywide rental rates continued to decline CBD VACANCY SUBURBAN VACANCY double-digits, Class A vacancy actually dropped during the second quarter 2011. between quarters to 16.2% from 19.6% on a On a year-over-year basis, CBD Class A year-over-year basis. By comparison, suburban average quoted rental rates dropped $1.71 to Class B vacancy rose to 16.7% from 16.3%. $34.15 per square foot (from $35.86), while CLASS A OFFICE RENTS Citywide, a total of 47 office properties had a suburban Class A rates dropped $0.72 to $40.00 minimum of 100,000 SF available for lease in $26.63 per square foot (from $27.35). The $38.00 both direct and sublease space which is 5 less average CBD Class B asking rate increased by $36.00 than the previous quarter, and 14 of those $0.49 to $23.44 per square foot (from $22.95), $34.00 properties have over 200,000 SF available, while suburban Class B rates remained the $32.00 down from 25. same at $17.95 per square foot on a year-over- $30.00 $28.00 Sublease space totaled 3.4 million SF, including year basis. Until demand outpaces supply, rental $26.00 1.3 million SF of vacant space and 1.2 million SF rates are expected to remain flat. of subleases available for occupancy over the next 12 months. The largest sublease space being marketed is Devon Energy’s space, CBD RENTS SUBURBAN RENTS 282,000 SF in Two Allen Center in the CBD and Braeswood Tower II has the largest suburban contiguous block of sublease space available, 146,392 SF. QUOTED GROSS RENTAL RATES FOR TOP PERFORMING OFFICE BUILDINGS YEAR AVAIL. RENT BUILDING NAME ADDRESS SUBMARKET RBA (SF) LEASED OWNER BUILT SF ($/SF) Metropolitan Life Insurance Co. & Wells Fargo Plaza 1000 Louisiana CBD 1,721,242 1982 94.5% 363,136 $46.10 N.Y. State Retirement Fund Heritage Plaza 1111 Bagby CBD 1,089,266 1986 90.5% 161,357 $40.50 Brookfield Office Properties 1100 Louisiana 1100 Louisiana CBD 1,265,332 1980 98.4% 127,347 $38.64 Enterprise Products Partners CityCentre One 800 Town & Country Blvd Energy Corridor 101,300 2008 100% 15,000 $40.00 Midway Companies Enclave Parkway 1401 Enclave Parkway Energy Corridor 209,185 1999 97.0% 164,547 $33.00 Parkway Properties Minute Maid Building 2150 Town Square Place E. Fort Bend 185,000 2008 76.2% 44,109 $30.00 Planned Community Developers Wells Fargo Bank Tower 1300 Post Oak Blvd. Galleria 491,254 1983 95.1% 59,140 $34.15 TIAA-CREF Williams Tower 2800 Post Oak Blvd Galleria 1,476,973 1983 90.5% 358,966 $33.93 Hines REIT 11 Greenway Plaza 11 Greenway Greenway 745,956 1978 97.9% 139,804 $30.15 Crescent Real Estate Equities One BriarLake Plaza 2000 W. Sam Houston Westchase 550,000 2000 100% 7,507 $39.15 Behringer Harvard Waterway Plaza I 10003 Woodloch Forest Woodlands 223,483 2000 94.0% 20,326 $33.30 W.P. Carey & Co. LLC Waterway Square 4 Waterway Ave. Woodlands 232,364 2009 93.3% 15,680 $36.00 The Woodlands Development Note: Avail. SF includes direct and sublet space. Source: CoStar Property COLLIERS INTERNATIONAL | P. 2
  • 3. RESEARCH & FORECAST REPORT | Q2 2011 | HOUSTON OFFICE MARKET SALES ACTIVITY LEASING ACTIVITY Houston’s Office Investment sales Houston’s office leasing activity HOUSTON OFFICE SUBMARKETS activity increased during the second reached 2.1 million SF in the first quarter with 25 properties changing quarter, compared to 4.0 million SF in hands compared to 13 in the previous the same quarter last year. Leasing quarter. According to CoStar, office activity is still below levels prior to sale transactions had a total dollar the economic downturn, and an volume of $409 million, averaging increasing number of office tenants $188/SF with a 8.1% capitalization are renewing lease commitments with rate. better concession packages or Among the most significant relocating to buildings/submarkets transactions closed in the second offering more attractive terms. quarter were: All but three of the more significant New York State Retirement Funds’ office leases signed during the first acquisition of a 50% interest in Wells quarter were renewals and/or Fargo Plaza from MetLife for $510 expansions. The most significant new million ($300/SF) in the CBD office lease signed in the second submarket. quarter was Columbia Gas Transmissions’ lease for 55,000 Chevron acquired the 1,228,877 square feet in Sage Plaza located in square foot Four Allen Center in the the West Loop/Galleria submarket, CBD submarket from Brookfield followed by Amerigroup Corps lease Office Properties for $340 million for 50,000 square feet in 5959 ($277/SF). Chevron currently leases Corporate Drive located in the the entire building. Southwest submarket. Q2 2011 SIGNIFICANT SALES TRANSACTIONS YEAR SALE BUILDING NAME SUBMARKET RBA (SF) BUYER SELLER $/SF CLOSED BUILT PRICE ING Clarion OBO N.Y. Wells Fargo Plaza (50% Interest) CBD 1,700,000 1979 MetLife $510.0M $300 6/2011 State Retirement Fund Brookfield Office Four Allen Center CBD 1,228,877 1983 Chevron Corporation $340.0M $277 6/2011 Properties Buchanan Street Beltway 8 Corporate Center 3 & 4 Northwest Far 259,505 2007 Panattoni Development $26.3M $101 6/2011 Partners Beacon Investment One & Two Park Ten Place Katy Freeway 91,166 1979/83 KBS Realty Advisors $8.4M $92 5/2011 Properties Q2 2011 TOP OFFICE LEASES BUILDING NAME/ADDRESS SUBMARKET SF TENANT LEASE DATE 1600 Smith CBD 311,000 Chevron* 5/2011 Eldridge Oaks Katy Freeway West 138,000 KBR* 4/2011 Sage Plaza West Loop/Galleria 55,000 Columbia Gas Transmission 5/2011 5959 Corporate Drive Southwest 50,000 Amerigroup Corp 4/2011 Remington Square Northwest 42,364 Seawell 6/2011 Chase Tower CBD 42,136 Breitburn Energy* 4/2011 *Renewal and/or Expansion; COLLIERS INTERNATIONAL | P. 3
  • 4. RESEARCH & FORECAST REPORT | Q2 2011 | HOUSTON OFFICE MARKET HOUSTON OFFICE MARKET SUMMARY (CBD, SUBURBAN & CITYWIDE) INVENTORY DIRECT VACANCY SUBLEASE VACANCY VACANCY VACANCY RATE (%) NET ABSORPTION (SF) RENTAL RATE Class # of Bldgs. Total (SF) (SF) Rate (%) (SF) Rate (%) Total (SF) Q2-2011 Q1-2011 Q2-2011 1Q-2011 Avg ($/SF) CBD A 28 26,963,571 2,597,425 9.6% 780,510 2.9% 3,377,935 12.5% 12.6% 32,128 -33,540 $34.15 B 30 9,370,310 1,856,651 19.8% 15,314 0.2% 1,871,965 20.0% 19.6% -10,411 34,868 $23.44 C 19 1,308,204 783,648 59.9% 3957 0.3% 787,605 60.2% 55.2% -2,212 -14,543 $18.03 Total 77 37,642,085 5,237,724 13.9% 799,781 2.1% 6,037,505 16.0% 16.0% 19,505 -13,215 $29.81 SUBURBAN A 272 70,014,873 10,955,541 15.6% 364,565 0.5% 11,320,106 16.2% 16.6% 261,138 537,689 $26.63 B 892 70,401,884 11,321,701 16.1% 413,747 0.6% 11,735,448 16.7% 16.3% -134,965 -127,662 $17.95 C 451 18,856,783 2,145,864 11.4% 49,095 0.3% 2,194,959 11.6% 11.4% -64,587 -18,596 $15.03 Total 1615 159,273,540 24,423,106 15.3% 827,407 0.5% 25,250,513 15.9% 15.8% 61,586 391,431 $21.31 OVERALL A 300 96,978,444 13,552,966 14.0% 1,145,075 1.2% 14,698,041 15.2% 15.5% 293,266 504,149 $28.33 B 922 79,772,194 13,178,352 16.5% 429,061 0.5% 13,607,413 17.1% 16.7% -145,376 -92,794 $18.58 C 470 20,164,987 2,929,512 14.5% 53,052 0.3% 2,982,564 14.8% 14.4% -66,799 -33,139 $15.25 Total 1692 196,915,625 29,660,830 15.1% 1,627,188 0.8% 31,288,018 15.9% 15.9% 81,091 378,216 $22.70 HOUSTON SUBURBAN OFFICE MARKET SUMMARY INVENTORY DIRECT VACANCY SUBLEASE VACANCY VACANCY VACANCY RATE (%) NET ABSORPTION (SF) RENTAL RATE # of Class Total (SF) (SF) Rate (%) (SF) Rate (%) Total (SF) Q2-2011 Q1-2011 Q2-2011 Q1-2011 Avg. ($/SF) Bldgs. Allen Parkway A 3 1,246,576 217,628 17.5% 0 0.0% 217,628 17.5% 18.3% 5,280 33,253 $28.78 B 29 2,815,289 271,944 9.7% 3,348 0.1% 275,292 9.8% 6.6% -73,252 28,658 $22.58 C 26 1,163,150 406,786 35.0% 0 0.0% 406,786 35.0% 35.4% 5,250 14,693 $19.70 Total 58 5,225,015 896,358 17.2% 3,348 0.1% 899,706 17.2% 15.4% -62,722 76,604 $25.57 Baytown B 5 525,544 6,802 1.3% 0 0.0% 6,802 1.3% 1.3% 0 0 $14.67 C 2 60,396 1,563 2.6% 0 0.0% 1,563 2.6% 2.6% 0 1040 $16.25 Total 7 585,940 8,365 1.4% 0 0.0% 8,365 1.4% 1.4% 0 1,040 $15.11 Bellaire A 10 1,389,252 129,033 9.3% 28,822 2.1% 157,855 11.4% 11.2% -2,796 -13,138 $22.95 B 9 1,369,867 166,791 12.2% 4,671 0.3% 171,462 12.5% 12.6% 848 5,038 $19.54 C 7 545,303 36,662 6.7% 10,454 1.9% 47,116 8.6% 8.6% 0 -6,016 $15.14 Total 26 3,304,422 332,486 10.1% 43,947 1.3% 376,433 11.4% 11.3% -1,948 -14,116 $20.54 Conroe A 1 60,000 0 0.0% 0 0.0% 0 0.0% 0.0% 0 0 - B 6 244,782 16,334 6.7% 0 0.0% 16,334 6.7% 6.5% -535 3,784 $15.33 C 5 302,939 0 0.0% 0 0.0% 0 0.0% 0.0% 0 0 $15.00 Total 12 607,721 16,334 2.7% 0 0.0% 16,334 2.7% 2.6% -535 3,784 $15.28 E. Fort Bend A 20 3,564,828 937,429 26.3% 12,199 0.3% 949,628 26.6% 27.6% 34,893 -2,219 $27.64 B 35 2,033,510 264,798 13.0% 15,998 0.8% 280,796 13.8% 10.4% -9,498 -11,174 $18.26 C 4 142,013 2,413 1.7% 0 0.0% 2,413 1.7% 1.7% 0 842 $17.50 Total 59 5,740,351 1,204,640 21.0% 28,197 0.5% 1,232,837 21.5% 21.1% 25,395 -12,551 $23.65 COLLIERS INTERNATIONAL | P. 4
  • 5. RESEARCH & FORECAST REPORT | Q2 2011 | HOUSTON OFFICE MARKET HOUSTON SUBURBAN OFFICE MARKET SUMMARY FM 1960 A 14 2,429,161 1,151,235 47.4% 5,442 0.2% 1,156,677 47.6% 51.0% 1,514 -15,081 $21.75 B 85 4,722,924 962,138 20.4% 73,566 1.6% 1,035,704 21.9% 22.3% 20,037 -17,233 $14.65 C 24 851,424 70,068 8.2% 0 0.0% 70,068 8.2% 9.3% 3,062 -8,384 $13.82 Total 123 8,003,509 2,183,441 27.3% 79,008 1.0% 2,262,449 28.3% 29.3% 24,613 -40,698 $16.95 Greenway A 16 6,167,603 885,870 14.4% 99,876 1.6% 985,746 16.0% 16.8% 17,506 -52,232 $27.58 B 25 2,551,389 265,457 10.4% 17,397 0.7% 282,854 11.1% 10.9% 3,034 -18,655 $21.65 C 21 873,877 261,217 29.9% 0 0.0% 261,217 29.9% 29.8% -984 -15,419 $17.29 Total 62 9,592,869 1,412,544 14.7% 117,273 1.2% 1,529,817 15.9% 16.4% 19,556 -86,306 $24.85 Gulf Freeway/Pasadena A 2 75,066 18,718 24.9% 6,095 8.1% 24,813 33.1% 35.5% 1,809 1,834 $27.20 B 29 1,709,060 201,497 11.8% 6,870 0.4% 208,367 12.2% 11.2% -17,386 5,487 $18.90 C 27 1,121,270 92,787 8.3% 0 0.0% 92,787 8.3% 9.4% 12,396 -11,517 $15.09 Total 58 2,905,396 313,002 10.8% 12,965 0.4% 325,967 11.2% 11.1% -3,181 -4,196 $18.60 I-10 East B 4 274,672 80,160 29.2% 0 0.0% 80,160 29.2% 27.3% -5,120 194 $13.96 C 5 157,955 0 0.0% 0 0.0% 0 0.0% 0.0% 0 6,536 $12.00 Total 9 432,627 80,160 18.5% 0 0.0% 80,160 18.5% 17.3% -5,120 6,730 $13.93 Katy Freeway A 45 11,556,573 2,004,724 17.3% 9,799 0.1% 2,014,523 17.4% 18.6% 115,848 284,723 $28.38 B 86 7,166,755 902,121 12.6% 81,924 1.1% 984,045 13.7% 13.8% -31,806 -39,566 $18.64 C 38 1,762,617 172,675 9.8% 0 0.0% 172,675 9.8% 9.5% -2,315 -2,287 $14.82 Total 169 20,485,945 3,079,520 15.0% 91,723 0.4% 3,171,243 15.5% 16.1% 81,727 242,870 $23.51 Kingwood/Humble A 2 133,924 25,518 19.1% 0 0.0% 25,518 19.1% 16.9% 1,247 -861 $29.40 B 59 1,817,907 162,882 9.0% 3,224 0.2% 166,106 9.1% 9.8% 11,646 8,805 $19.82 C 79 735,090 26,235 3.6% 0 0.0% 26,235 3.6% 4.2% 3,423 232 $16.47 Total 140 2,686,921 214,635 8.0% 3,224 0.1% 217,859 8.1% 8.7% 16,316 8,176 $19.39 NASA/Clear Lake A 6 809,351 148,739 18.4% 0 0.0% 148,739 18.4% 17.1% -10,128 -57,096 $24.97 B 45 3,174,176 423,535 13.3% 2,629 0.1% 426,164 13.4% 6.9% -200,841 23,123 $19.55 C 24 880,366 136,921 15.6% 0 0.0% 136,921 15.6% 15.1% 2,672 10,375 $15.38 Total 75 4,863,893 709,195 14.6% 2,629 0.1% 711,824 14.6% 10.2% -208,297 -23,598 $19.98 North Belt/Greenspoint A 20 4,750,418 326,657 6.9% 62,232 1.3% 388,889 8.2% 7.3% -42,465 -39,550 $20.02 B 56 5,323,159 1,167,670 21.9% 54,602 1.0% 1,222,272 23.0% 25.0% 73,335 57,035 $15.72 C 21 1,323,627 259,291 19.6% 10,971 0.8% 270,262 20.4% 18.2% -29,572 -4,192 $13.80 Total 97 11,397,204 1,753,618 15.4% 127,805 1.1% 1,881,423 16.5% 16.7% 1,298 13,293 $16.42 Northeast Far and Outlier B 5 301,773 73,763 24.4% 0 0.0% 73,763 24.4% 25.0% 1,764 0 $17.40 C 6 149,813 17,289 11.5% 0 0.0% 17,289 11.5% 8.0% -5,355 572 $12.00 Total 11 451,586 91,052 20.2% 0 0.0% 91,052 20.2% 19.4% -3,591 572 $15.98 COLLIERS INTERNATIONAL | P. 5
  • 6. RESEARCH & FORECAST REPORT | Q2 2011 | HOUSTON OFFICE MARKET HOUSTON SUBURBAN OFFICE MARKET SUMMARY Northwest A 22 3,725,391 1,120,246 30.1% 7,378 0.2% 1,127,624 30.3% 31.0% 7,495 136,112 $24.55 B 69 6,545,554 1,500,004 22.9% 15,809 0.2% 1,515,813 23.2% 22.2% -2,174 26,751 $16.30 C 41 1,568,998 121,993 7.8% 0 0.0% 121,993 7.8% 6.5% -24,895 -11,622 $12.18 Total 132 11,839,943 2,742,243 23.2% 23,187 0.2% 2,765,430 23.4% 22.9% -19,574 151,241 $19.08 Northwest Outlier A 1 89,750 0 0.0% 0 0.0% 0 0.0% 0.0% 0 0 - B 4 135,457 4,621 3.4% 0 0.0% 4,621 3.4% 1.7% -2282 0 $18.12 Total 5 225,207 4,621 2.1% 0 0.0% 4,621 2.1% 1.0% -2282 0 $18.12 Richmond/Fountainview B 14 781,369 94,677 12.1% 0 0.0% 94,677 12.1% 10.8% -10,676 634 $15.39 C 17 664,389 57,651 8.7% 0 0.0% 57,651 8.7% 7.6% -7,385 -6,192 $13.42 Total 31 1,445,758 152,328 10.5% 0 0.0% 152,328 10.5% 9.3% -18,061 -5,558 $14.93 San Felipe/Voss A 3 1,710,531 271,586 15.9% 0 0.0% 271,586 15.9% 14.7% -15,348 21,232 $30.75 B 32 3,357,119 285,972 8.5% 22,748 0.7% 308,720 9.2% 9.0% -4,060 24,004 $19.36 C 3 161,393 32,136 19.9% 0 0.0% 32,136 19.9% 18.8% -1,744 -7,819 $16.49 Total 38 5,229,043 589,694 11.3% 22,748 0.4% 612,442 11.7% 11.2% -21,152 37,417 $23.51 South A 1 80,000 19,000 23.8% 0 0.0% 19,000 23.8% 23.8% 0 1,500 $26.63 B 15 602,907 97,038 16.1% 0 0.0% 97,038 16.1% 12.7% -7,000 -3,888 $19.62 C 4 223,029 39,529 17.7% 0 0.0% 39,529 17.7% 17.9% 368 -977 $14.78 Total 20 905,936 155,567 17.2% 0 0.0% 155,567 17.2% 15.0% -6,632 -3,365 $19.29 South Main/Med Center A 15 4,159,577 324,246 7.8% 0 0.0% 324,246 7.8% 6.9% -17,283 14,320 $29.35 B 34 4,005,469 309,992 7.7% 4,800 0.1% 314,792 7.9% 8.5% 6,734 -3,986 $22.84 C 31 2,453,446 107,776 4.4% 0 0.0% 107,776 4.4% 4.8% -2,533 1,950 $19.31 Total 80 10,618,492 742,014 7.0% 4,800 0.0% 746,814 7.0% 7.0% -13,082 12,284 $24.74 Southeast/Outlier A 1 159,304 0 0.0% 0 0.0% 0 0.0% 0.0% 0 0 - B 9 520,515 103,077 19.8% 0 0.0% 103,077 19.8% 19.8% 0 -18,800 $20.56 C 2 118,772 12,533 10.6% 0 0.0% 12,533 10.6% 55.0% 0 0 $24.00 Total 12 798,591 115,610 14.5% 0 0.0% 115,610 14.5% 16.4% 0 -18,800 $20.97 Southwest A 6 1,501,746 319,312 21.3% 0 0.0% 319,312 21.3% 29.0% 110,609 16,998 $16.15 B 59 6,017,052 1,286,043 21.4% 7,500 0.1% 1,293,543 21.5% 22.6% 41,981 -122,584 $16.26 C 41 2,325,162 226,576 9.7% 27,670 1.2% 254,246 10.9% 9.4% -26,149 4,294 $12.25 Total 106 9,843,960 1,831,931 18.6% 35,170 0.4% 1,867,101 19.0% 20.2% 126,441 -101,292 $15.70 Southwest Far and Outlier A 2 87,710 10,505 12.0% 0 0.0% 10,505 12.0% 9.1% -2,553 0 $25.35 B 14 616,117 76,118 12.4% 1,365 0.2% 77,483 12.6% 11.8% -4,479 5,620 $26.76 C 3 128,735 1,000 0.8% 0 0.0% 1,000 0.8% 0.0% -1000 0 $16.00 Total 19 832,562 87,623 10.5% 1,365 0.2% 88,988 10.7% 9.7% -8,032 5,620 $26.43 COLLIERS INTERNATIONAL | P. 6
  • 7. RESEARCH & FORECAST REPORT | Q2 2011 | HOUSTON OFFICE MARKET HOUSTON SUBURBAN OFFICE MARKET SUMMARY INVENTORY DIRECT VACANCY SUBLEASE VACANCY VACANCY VACANCY RATE (%) NET ABSORPTION (SF) RENTAL RATE Class # of Bldgs. Total (SF) (SF) Rate (%) (SF) Rate (%) Total (SF) Q2-2011 Q1-2011 Q2-2011 Q1-2011 Avg. ($/SF) West Loop/Galleria A 40 16,207,654 1,539,832 9.5% 67,024 0.4% 1,606,856 9.9% 10.0% 38,983 8,513 $27.96 B 54 5,665,149 1,218,433 21.5% 5,482 0.1% 1,223,915 21.6% 22.7% 56,703 29,970 $20.35 C 6 332,166 0 0.0% 0 0.0% 0 0.0% 0.0% 0 940 $16.75 Total 100 22,204,969 2,758,265 12.4% 72,506 0.3% 2,830,771 12.7% 13.1% 95,686 39,423 $25.49 Westchase A 27 7,861,857 1,068,173 13.6% 50,047 0.6% 1,118,220 14.2% 14.2% 1,004 182,004 $27.73 B 51 4,939,227 904,412 18.3% 48,571 1.0% 952,983 19.3% 18.7% 8,905 -168,429 $18.12 C 9 439,977 36,542 8.3% 0 0.0% 36,542 8.3% 10.9% 11,485 5,398 $15.08 Total 87 13,241,061 2,009,127 15.2% 98,618 0.7% 2,107,745 15.9% 15.8% 21,394 18,973 $22.85 The Woodlands A 15 2,248,601 437,090 19.4% 15,651 0.7% 452,741 20.1% 20.8% 15,523 17,377 $29.98 B 59 3,185,142 475,422 14.9% 43,243 1.4% 518,665 16.3% 15.2% 9,157 57,550 $19.82 C 5 370,876 26,221 7.1% 0 0.0% 26,221 7.1% 6.3% -1,311 8,957 - Total 79 5,804,619 938,733 16.2% 58,894 1.0% 997,627 17.2% 16.8% 23,369 83,884 $24.11 OFFICE DEVELOPMENT PIPELINE Houston’s development activity increased slightly during the second quarter, with six projects under construction. The Redstone Group in partnership with Stream Realty Partners held a groundbreaking ceremony in June for BBVA Compass Bank’s new 5 6 home, 2200 Post Oak Blvd. The 306,000 square foot, Class A office building is 2 scheduled for completion in April 2013. BBVA Compass Bank will occupy about half of the building. 4 Griffin Partners’ four-story, 102,000 SF Nassau Bay Town Square office building is located in the NASA/Clear Lake submarket. This pre-certified LEED Silver office building is scheduled to come on line 60% pre-leased with Hamilton Sundstrand Corporation as the lead tenant. Also included in the 781,000 SF currently under construction is Greenwood Corporation’s 156,000 SF Chasewood Crossing II in the FM 1960-Highway 1 249 submarket (scheduled for completion in July 2011). Trammell Crow Company’s Hess Tower (formerly Discovery Tower) was delivered during the second quarter, adding 845,000 square feet to the CBD Class A office market. The building is 100% leased by Hess Corporation, who will be vacating their 3 space in One Allen Center to move into the building sometime during the third quarter. Halliburton broke ground on a 100,000 SF office building located in its 94-acre North Belt Campus, situated just south of Beltway 8 and Houston’s George Bush Intercontinental Airport. The campus will house approximately 2,200 employees and includes a new Research and Development facility featuring state-of-the-art laboratories, two new parking garages, a new cafeteria and new childcare and employee wellness and fitness centers. The building is being developed by D. E. Harvey Builders and is scheduled for completion in January 2013. SELECT OFFICE BUILDINGS UNDER CONSTRUCTION EST. BUILDING NAME ADDRESS SUBMARKET SF PRE-LEASED DEVELOPER DELIVERY 1 BBVA Compass/2200 Post Oak 2200 Post Oak Blvd. Galleria/Uptown 306,012 51.1% Redstone and Stream 4/2013 2 Chasewood Crossing II 19450 State Hwy 249 FM 1960/Hwy 249 156,000 0.0% Greenwood Corporation 7/2011 3 Nassau Bay Town Square I 18050 Saturn Ln NASA/Clear Lake 100,000 60.0% Griffin Partners Inc. 9/2011 4 Halliburton North Belt Campus Milner Road North Belt/Greenspoint 100,000 100.0% D. E. Harvey Builders 1/2013 5 Research Forest Lakeside 2 9320 Lakeside Blvd Woodlands 68,500 0.0% Warmack & Co 9/2011 6 Technology Forest Professional 4055 Technology Forest Woodlands 50,000 50.0% Woodlands Land Dev 12/2011 Total SF Under Construction 780,512 COLLIERS INTERNATIONAL | P. 7
  • 8. RESEARCH & FORECAST REPORT | Q2 2011 | HOUSTON OFFICE MARKET Colliers International Statistics Revenues: $1.9 Billion Countries: 61 Offices: 480 Professionals & Staff: 15,052 Brokers: 4,788 Square Feet Managed: 2.4 Billion Lease/Sale Transactions: 135,977 Total Transaction Value: $53 Billion COLLIERS INTERNATIONAL | HOUSTON 1300 Post Oak Boulevard Suite 200 Houston, Texas 77056 MAIN +1 713 222 2111 Accelerating success. COLLIERS INTERNATIONAL | P. 8