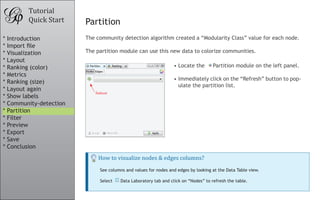
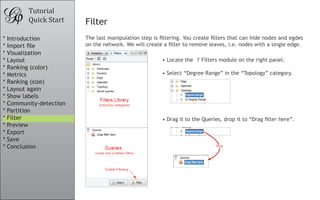
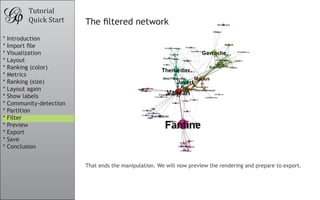
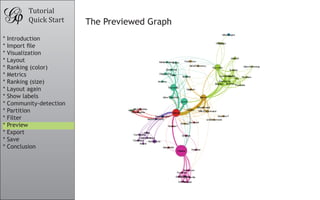
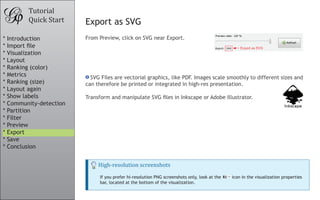
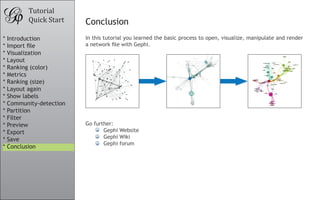
This document provides a tutorial on how to use Gephi software to analyze and visualize network graphs. It outlines the basic steps of importing a sample graph file, applying layout algorithms to organize the nodes, calculating metrics, detecting communities, filtering the graph, and exporting/saving the results. The tutorial demonstrates features of Gephi including node ranking, partitioning, and interactive visualization of the graph.
Practice discovering biological knowledge using networks approach.Elena Sügis
This practice session gives an overview how to analyze biological data using networks approach. It covers netwokrs topology, data integration, differential expression, network visualization, functional enrichment analysis and retrieving data from external sources. Primarily Cytoscape software is used for this practice session.
Thank you very much for using Quadcept. We are offering the new version 10.3.0 that provides new features, improvements and enhancements for a better development environment and service.
A short presentation about some tools used in game design, includes some thoughts about using spreadsheets, as well as the web-based Playtest and Card Warden for iOS.
Prepared as part of the IT for Business Intelligence course of MBA @VGSOM, IIT Kharagpur. The tutorial describes how to create an interactive map using the open source software QGIS.
JMeter webinar - integration with InfluxDB and GrafanaRTTS
Watch this recorded webinar about real-time monitoring of application performance. See how to integrate Apache JMeter, the open-source leader in performance testing, with InfluxDB, the open-source time-series database, and Grafana, the open-source analytics and visualization application.
In this webinar, we will review the benefits of leveraging InfluxDB and Grafana when executing load tests and demonstrate how these tools are used to visualize performance metrics.
Length: 30 minutes
Session Overview
-------------------------------------------
During this webinar, we will cover the following topics while demonstrating the integrations of JMeter, InfluxDB and Grafana:
- What out-of-the-box solutions are available for real-time monitoring JMeter tests?
- What are the benefits of integrating InfluxDB and Grafana into the load testing stack?
- Which features are provided by Grafana?
- Demonstration of InfluxDB and Grafana using a practice web application
To view the webinar recording, go to:
https://www.rttsweb.com/jmeter-integration-webinar
"Impact of front-end architecture on development cost", Viktor TurskyiFwdays
I have heard many times that architecture is not important for the front-end. Also, many times I have seen how developers implement features on the front-end just following the standard rules for a framework and think that this is enough to successfully launch the project, and then the project fails. How to prevent this and what approach to choose? I have launched dozens of complex projects and during the talk we will analyze which approaches have worked for me and which have not.
Neuro-symbolic is not enough, we need neuro-*semantic*Frank van Harmelen
Neuro-symbolic (NeSy) AI is on the rise. However, simply machine learning on just any symbolic structure is not sufficient to really harvest the gains of NeSy. These will only be gained when the symbolic structures have an actual semantics. I give an operational definition of semantics as “predictable inference”.
All of this illustrated with link prediction over knowledge graphs, but the argument is general.
Kubernetes & AI - Beauty and the Beast !?! @KCD Istanbul 2024Tobias Schneck
As AI technology is pushing into IT I was wondering myself, as an “infrastructure container kubernetes guy”, how get this fancy AI technology get managed from an infrastructure operational view? Is it possible to apply our lovely cloud native principals as well? What benefit’s both technologies could bring to each other?
Let me take this questions and provide you a short journey through existing deployment models and use cases for AI software. On practical examples, we discuss what cloud/on-premise strategy we may need for applying it to our own infrastructure to get it to work from an enterprise perspective. I want to give an overview about infrastructure requirements and technologies, what could be beneficial or limiting your AI use cases in an enterprise environment. An interactive Demo will give you some insides, what approaches I got already working for real.
UiPath Test Automation using UiPath Test Suite series, part 3DianaGray10
Welcome to UiPath Test Automation using UiPath Test Suite series part 3. In this session, we will cover desktop automation along with UI automation.
Topics covered:
UI automation Introduction,
UI automation Sample
Desktop automation flow
Pradeep Chinnala, Senior Consultant Automation Developer @WonderBotz and UiPath MVP
Deepak Rai, Automation Practice Lead, Boundaryless Group and UiPath MVP
Essentials of Automations: Optimizing FME Workflows with ParametersSafe Software
Are you looking to streamline your workflows and boost your projects’ efficiency? Do you find yourself searching for ways to add flexibility and control over your FME workflows? If so, you’re in the right place.
Join us for an insightful dive into the world of FME parameters, a critical element in optimizing workflow efficiency. This webinar marks the beginning of our three-part “Essentials of Automation” series. This first webinar is designed to equip you with the knowledge and skills to utilize parameters effectively: enhancing the flexibility, maintainability, and user control of your FME projects.
Here’s what you’ll gain:
- Essentials of FME Parameters: Understand the pivotal role of parameters, including Reader/Writer, Transformer, User, and FME Flow categories. Discover how they are the key to unlocking automation and optimization within your workflows.
- Practical Applications in FME Form: Delve into key user parameter types including choice, connections, and file URLs. Allow users to control how a workflow runs, making your workflows more reusable. Learn to import values and deliver the best user experience for your workflows while enhancing accuracy.
- Optimization Strategies in FME Flow: Explore the creation and strategic deployment of parameters in FME Flow, including the use of deployment and geometry parameters, to maximize workflow efficiency.
- Pro Tips for Success: Gain insights on parameterizing connections and leveraging new features like Conditional Visibility for clarity and simplicity.
We’ll wrap up with a glimpse into future webinars, followed by a Q&A session to address your specific questions surrounding this topic.
Don’t miss this opportunity to elevate your FME expertise and drive your projects to new heights of efficiency.
Smart TV Buyer Insights Survey 2024 by 91mobiles.pdf91mobiles
91mobiles recently conducted a Smart TV Buyer Insights Survey in which we asked over 3,000 respondents about the TV they own, aspects they look at on a new TV, and their TV buying preferences.
Builder.ai Founder Sachin Dev Duggal's Strategic Approach to Create an Innova...Ramesh Iyer
In today's fast-changing business world, Companies that adapt and embrace new ideas often need help to keep up with the competition. However, fostering a culture of innovation takes much work. It takes vision, leadership and willingness to take risks in the right proportion. Sachin Dev Duggal, co-founder of Builder.ai, has perfected the art of this balance, creating a company culture where creativity and growth are nurtured at each stage.
PHP Frameworks: I want to break free (IPC Berlin 2024)Ralf Eggert
In this presentation, we examine the challenges and limitations of relying too heavily on PHP frameworks in web development. We discuss the history of PHP and its frameworks to understand how this dependence has evolved. The focus will be on providing concrete tips and strategies to reduce reliance on these frameworks, based on real-world examples and practical considerations. The goal is to equip developers with the skills and knowledge to create more flexible and future-proof web applications. We'll explore the importance of maintaining autonomy in a rapidly changing tech landscape and how to make informed decisions in PHP development.
This talk is aimed at encouraging a more independent approach to using PHP frameworks, moving towards a more flexible and future-proof approach to PHP development.
State of ICS and IoT Cyber Threat Landscape Report 2024 previewPrayukth K V
The IoT and OT threat landscape report has been prepared by the Threat Research Team at Sectrio using data from Sectrio, cyber threat intelligence farming facilities spread across over 85 cities around the world. In addition, Sectrio also runs AI-based advanced threat and payload engagement facilities that serve as sinks to attract and engage sophisticated threat actors, and newer malware including new variants and latent threats that are at an earlier stage of development.
The latest edition of the OT/ICS and IoT security Threat Landscape Report 2024 also covers:
State of global ICS asset and network exposure
Sectoral targets and attacks as well as the cost of ransom
Global APT activity, AI usage, actor and tactic profiles, and implications
Rise in volumes of AI-powered cyberattacks
Major cyber events in 2024
Malware and malicious payload trends
Cyberattack types and targets
Vulnerability exploit attempts on CVEs
Attacks on counties – USA
Expansion of bot farms – how, where, and why
In-depth analysis of the cyber threat landscape across North America, South America, Europe, APAC, and the Middle East
Why are attacks on smart factories rising?
Cyber risk predictions
Axis of attacks – Europe
Systemic attacks in the Middle East
Download the full report from here:
https://sectrio.com/resources/ot-threat-landscape-reports/sectrio-releases-ot-ics-and-iot-security-threat-landscape-report-2024/
Transcript: Selling digital books in 2024: Insights from industry leaders - T...BookNet Canada
The publishing industry has been selling digital audiobooks and ebooks for over a decade and has found its groove. What’s changed? What has stayed the same? Where do we go from here? Join a group of leading sales peers from across the industry for a conversation about the lessons learned since the popularization of digital books, best practices, digital book supply chain management, and more.
Link to video recording: https://bnctechforum.ca/sessions/selling-digital-books-in-2024-insights-from-industry-leaders/
Presented by BookNet Canada on May 28, 2024, with support from the Department of Canadian Heritage.
DevOps and Testing slides at DASA ConnectKari Kakkonen
My and Rik Marselis slides at 30.5.2024 DASA Connect conference. We discuss about what is testing, then what is agile testing and finally what is Testing in DevOps. Finally we had lovely workshop with the participants trying to find out different ways to think about quality and testing in different parts of the DevOps infinity loop.
LF Energy Webinar: Electrical Grid Modelling and Simulation Through PowSyBl -...DanBrown980551
Do you want to learn how to model and simulate an electrical network from scratch in under an hour?
Then welcome to this PowSyBl workshop, hosted by Rte, the French Transmission System Operator (TSO)!
During the webinar, you will discover the PowSyBl ecosystem as well as handle and study an electrical network through an interactive Python notebook.
PowSyBl is an open source project hosted by LF Energy, which offers a comprehensive set of features for electrical grid modelling and simulation. Among other advanced features, PowSyBl provides:
- A fully editable and extendable library for grid component modelling;
- Visualization tools to display your network;
- Grid simulation tools, such as power flows, security analyses (with or without remedial actions) and sensitivity analyses;
The framework is mostly written in Java, with a Python binding so that Python developers can access PowSyBl functionalities as well.
What you will learn during the webinar:
- For beginners: discover PowSyBl's functionalities through a quick general presentation and the notebook, without needing any expert coding skills;
- For advanced developers: master the skills to efficiently apply PowSyBl functionalities to your real-world scenarios.
1. Tutorial
Quick Start
* Introduction
Gephi Tutorial
*
*
*
Import file
Visualization
Layout
Quick Start
* Ranking (color)
* Metrics
Welcome to this introduction tutorial. It will guide you to the basic steps of network
* Ranking (size) visualization and manipulation in Gephi.
* Layout again
* Show labels Gephi version 0.7alpha2 was used to do this tutorial.
* Community-detection
* Partition Get Gephi
* Filter
* Preview
* Export
* Save
* Conclusion
Last updated March 05th, 2010
2. Tutorial
Quick Start Open Graph File
* Introduction • Download the file LesMiserables.gexf
* Import file
* Visualization • In the menubar, go to File Menu and Open...
* Layout
* Ranking (color)
* Metrics
* Ranking (size)
* Layout again
* Show labels
* Community-detection
* Partition
* Filter
* Preview
* Export
Graph Format
* Save
* Conclusion
- GEXF - Tulip TLP
- GraphML - CSV
- Pajek NET - Compressed ZIP
- GDF
- GML
3. Tutorial
Quick Start Import Report
* Introduction • When your filed is opened, the report sum up data found and issues.
* Import file - Number of nodes
* Visualization - Number of edges
* Layout - Type of graph
* Ranking (color)
* Metrics
* Ranking (size)
* Layout again
* Show labels
* Community-detection
* Partition
* Filter
* Preview
* Export
* Save
* Conclusion
• Click on OK to validate and see the graph
4. Tutorial
Quick Start You should now see a graph
* Introduction We imported “Les Miserables” dataset1. Coappearance weighted network of
* Import file characters in the novel “Les Miserables” from Victor Hugo.
* Visualization
* Layout
* Ranking (color)
* Metrics
* Ranking (size)
* Layout again
* Show labels
* Community-detection
* Partition
* Filter
* Preview
* Export
* Save Nodes position is random at first, so you may see a slighty different representation.
* Conclusion
1
D. E. Knuth, The Stanford GraphBase: A Platform for Combinatorial Computing, Addison-Wesley,
Reading, MA (1993).
5. Tutorial
Quick Start Graph Visualization
* Introduction • Use your mouse to move and scale the visualization
* Import file - Zoom: Mouse Wheel
* Visualization - Pan: Right Mouse Drag
* Layout Zoom
* Ranking (color)
• Locate the “Edge Thickness” slider on the bottom
* Metrics
* Ranking (size)
* Layout again
* Show labels
* Community-detection
Drag
* Partition • If you loose your graph, reset the position
* Filter
* Preview
* Export
* Save
* Conclusion
6. Tutorial
Quick Start Layout the graph
* Introduction Layout algorithms sets the graph shape, it is the most essential action.
* Import file
* Visualization • Locate the Layout module, on the left panel.
* Layout
* Ranking (color) • Choose “Force Atlas”
* Metrics
* Ranking (size) You can see the layout properties below, leave default
values.
* Layout again
* Show labels
* Community-detection • Click on to launch the algorithm
* Partition
* Filter
* Preview
* Export
* Save
* Conclusion
Layout algorithms
Graphs are usually layouted with “Force-based” algorithms. Their principle is easy, linked nodes
attract each other and non-linked nodes are pushed apart.
7. Tutorial
Quick Start Control the layout
* Introduction The purpose of Layout Properties is to let you control the algorithm in order to make a
* Import file aesthetically pleasing representation.
* Visualization
* Layout
• Set the “Repulsion strengh” at 10 000 to expand
* Ranking (color) the graph.
* Metrics
* Ranking (size) • Type “Enter” to validate the changed value.
* Layout again
* Show labels
* Community-detection
* Partition
* Filter
* Preview • And now the algorithm.
* Export
* Save
* Conclusion
8. Tutorial
Quick Start You should now see a layouted graph
* Introduction
* Import file
* Visualization
* Layout
* Ranking (color)
* Metrics
* Ranking (size)
* Layout again
* Show labels
* Community-detection
* Partition
* Filter
* Preview
* Export
* Save
* Conclusion
9. Tutorial
Quick Start Ranking (color)
* Introduction Ranking module lets you configure node’s color and size.
* Import file
* Visualization • Locate Ranking module, in the top left.
* Layout
* Ranking (color) • Choose “Degree” as a rank parameter.
* Metrics
* Ranking (size)
* Layout again
* Show labels You should obtain the configuration panel below:
* Community-detection
* Partition
* Filter • Click on to see the result.
* Preview
* Export
* Save
* Conclusion
10. Tutorial
Quick Start Let’s configure colors
* Introduction
* Import file • Move your mouse over the gradient component.
* Visualization
* Layout
* Ranking (color)
* Metrics • Double-click on triangles to configure the color
* Ranking (size)
* Layout again
* Show labels
* Community-detection
* Partition
* Filter
* Preview
* Export
* Save
Palette
* Conclusion
Use palette by right-clicking on the panel.
11. Tutorial
Quick Start Ranking result table
* Introduction You can see rank values by enabling the result table. Valjean has 36 links and is the most
* Import file connected node in the network.
* Visualization
* Layout • Enable table result view at the bottom toolbar
* Ranking (color)
* Metrics
* Ranking (size) • Click again on
* Layout again
* Show labels
* Community-detection
* Partition
* Filter
* Preview
* Export
* Save
* Conclusion
12. Tutorial
Quick Start Metrics
* Introduction We will calculate the average path length for the network. It computes the path length for
* Import file all possibles pairs of nodes and give information about how nodes are close from each other.
* Visualization
* Layout
* Ranking (color)
• Locate the Statistics module on the right panel.
* Metrics
* Ranking (size)
* Layout again
* Show labels • Click on near “Average Path Length”.
* Community-detection
* Partition
* Filter
* Preview
* Export
* Save
Metrics available
* Conclusion
- Diameter - Betweeness Centrality
- Average Path Length - Closeness Centrality
- Clustering Coefficient - Eccentricity
- PageRank - Community Detection
- HITS (Modularity)
13. Tutorial
Quick Start Metric settings
* Introduction The settings panel immediately appears.
* Import file
* Visualization
* Layout
* Ranking (color)
* Metrics
* Ranking (size)
* Layout again
* Show labels
* Community-detection
* Partition
* Filter
* Preview
* Export
* Save
* Conclusion
• Select “Directed” and click on OK to compute the metric.
14. Tutorial
Quick Start Metric result
* Introduction When finished,
* Import file the metric dis-
* Visualization plays its result in
* Layout a report
* Ranking (color)
* Metrics
* Ranking (size)
* Layout again
* Show labels
* Community-detection
* Partition
* Filter
* Preview
* Export
* Save
* Conclusion
15. Tutorial
Quick Start Ranking (size)
* Introduction Metrics generates general reports but also results for each node. Thus three new values
* Import file have been created by the “Average Path Length” algorithm we ran.
* Visualization - Betweeness Centrality
* Layout - Closeness Centrality
* Ranking (color) - Eccentricity
* Metrics
* Ranking (size)
* Layout again
* Show labels • Go back to Ranking
* Community-detection
* Partition • Select “Betweeness Centrality” in the list.
* Filter
This metrics indicates influencial nodes for highest
* Preview
value.
* Export
* Save
* Conclusion
16. Tutorial
Quick Start Ranking (size)
* Introduction The node’s size will be set now. Colors remain the “Degree” indicator.
* Import file
* Visualization • Select the diamond icon in the toolbar for size.
* Layout
* Ranking (color)
• Set a min size at 10 and a max size at 50.
* Metrics
* Ranking (size)
* Layout again
* Show labels
* Community-detection
* Partition
* Filter
* Preview • And click on to see the result.
* Export
* Save
* Conclusion
17. Tutorial
Quick Start You should see a colored and sized graph
* Introduction
* Import file
* Visualization
* Layout
* Ranking (color)
* Metrics
* Ranking (size)
* Layout again
* Show labels
* Community-detection
* Partition
* Filter
* Preview
* Export
* Save
* Conclusion
Color: Degree
Size: Betweeness Centrality metric
18. Tutorial
Quick Start Layout again
* Introduction The layout is not completely satisfying, as big nodes can overlap smaller.
* Import file
* Visualization The “Force Atlas” algorithm has an option to take node size in account when layouting.
* Layout
* Ranking (color)
* Metrics • Go Back to the Layout panel.
* Ranking (size)
* Layout again • Check the “Adjust by Sizes” option and run again the
* Show labels algorithm for short moment.
* Community-detection
* Partition
• You can see nodes are not overlapping anymore.
* Filter
* Preview
* Export
* Save
* Conclusion
19. Tutorial
Quick Start Show labels
* Introduction Let’s explore the network more in details now that colors and size indicates central
* Import file nodes.
* Visualization
* Layout • Display node labels
* Ranking (color)
* Metrics
* Ranking (size)
* Layout again
* Show labels • Set label size proportional to node size
* Community-detection
* Partition
* Filter
* Preview
* Export
* Save • Set label size with the scale slider
* Conclusion
20. Tutorial
Quick Start Community detection
* Introduction The ability to detect and study communities is central in network analysis. We would like
* Import file to colorize clusters in our example.
* Visualization
* Layout Gephi implements the Louvain method1, available from the Statistics panel.
* Ranking (color)
Click on near the “Modularity” line
* Metrics
* Ranking (size)
* Layout again
• Select “Randomize” on the panel.
* Show labels
* Community-detection
* Partition
* Filter • Click on OK to launch the detection.
* Preview
* Export
* Save
* Conclusion
1
Blondel V, Guillaume J, Lambiotte R, Mech E (2008) Fast unfolding of communities in large net-
works. J Stat Mech: Theory Exp 2008:P10008. (http://findcommunities.googlepages.com)
21. Tutorial
Quick Start Partition
* Introduction The community detection algorithm created a “Modularity Class” value for each node.
* Import file
* Visualization The partition module can use this new data to colorize communities.
* Layout
* Ranking (color) • Locate the Partition module on the left panel.
* Metrics
• Immediately click on the “Refresh” button to pop-
* Ranking (size)
ulate the partition list.
* Layout again
* Show labels
* Community-detection
* Partition
* Filter
* Preview
* Export
* Save
How to visualize nodes & edges columns?
* Conclusion
See columns and values for nodes and edges by looking at the Data Table view.
Select Data Laboratory tab and click on “Nodes” to refresh the table.
22. Tutorial
Quick Start Partition
* Introduction • Select “Modularity Class” in the partition list.
* Import file
* Visualization You can see that 9 communities were found, could
* Layout be different for you. A random color has been set for
each community identifier.
* Ranking (color)
* Metrics
* Ranking (size) • Click on to colorize nodes.
* Layout again
* Show labels
* Community-detection
* Partition
* Filter
* Preview
* Export Right-click on the panel to access the Randomize colors action.
* Save
* Conclusion
23. Tutorial
Quick Start What the network looks like now
* Introduction
* Import file
* Visualization
* Layout
* Ranking (color)
* Metrics
* Ranking (size)
* Layout again
* Show labels
* Community-detection
* Partition
* Filter
* Preview
* Export
* Save
* Conclusion
24. Tutorial
Quick Start Filter
* Introduction The last manipulation step is filtering. You create filters that can hide nodes and egdes
* Import file on the network. We will create a filter to remove leaves, i.e. nodes with a single edge.
* Visualization
* Layout • Locate the Filters module on the right panel.
* Ranking (color)
* Metrics • Select “Degree Range” in the “Topology” category.
* Ranking (size)
* Layout again
* Show labels
* Community-detection
* Partition
* Filter • Drag it to the Queries, drop it to “Drag filter here”.
* Preview
* Export
* Save
* Conclusion Drag
25. Tutorial
Quick Start Filter
* Introduction • Click on “Degree Range” to activate the filter. The parameters panel appears.
* Import file
* Visualization
* Layout
* Ranking (color)
It shows a range slider and the chart that represents the data, the degree distribution
* Metrics here.
* Ranking (size)
* Layout again • Move the slider to sets its lower bound to 2.
* Show labels
* Community-detection
* Partition • Enable filtering by pushing the button.
* Filter
* Preview
* Export Nodes with a degree inferior to 2 are now hidden.
* Save
* Conclusion
Tip
You can edit bounds manually by double-clicking on values.
26. Tutorial
Quick Start The filtered network
* Introduction
* Import file
* Visualization
* Layout
* Ranking (color)
* Metrics
* Ranking (size)
* Layout again
* Show labels
* Community-detection
* Partition
* Filter
* Preview
* Export
* Save
* Conclusion
That ends the manipulation. We will now preview the rendering and prepare to export.
27. Tutorial
Quick Start Preview
* Introduction • Before exporting your graph as a SVG or PDF file, go to the Preview to:
* Import file - See exactly how the graph will look like
* Visualization - Put the last touch
* Layout
* Ranking (color)
• Select the “Preview” tab in the banner:
* Metrics
* Ranking (size)
* Layout again
* Show labels
* Community-detection • Click on Refresh to see the preview
* Partition
* Filter
* Preview
* Export
* Save
* Conclusion
Tip
If the graph is big, reduce the “Preview ratio” slider to 50% or 25% to display a partial graph.
28. Tutorial
Quick Start Preview
* Introduction • In the Node properties, find “Show Labels” and
* Import file enable the option.
* Visualization
* Layout • Click on
* Ranking (color)
* Metrics
* Ranking (size)
* Layout again Preview Settings supports Presets, click on the
* Show labels presets list and try different configurations.
* Community-detection
* Partition
* Filter
* Preview
* Export
* Save
* Conclusion
30. Tutorial
Quick Start Export as SVG
* Introduction From Preview, click on SVG near Export.
* Import file
* Visualization
* Layout
* Ranking (color)
* Metrics SVG Files are vectorial graphics, like PDF. Images scale smoothly to different sizes and
* Ranking (size) can therefore be printed or integrated in high-res presentation.
* Layout again
* Show labels Transform and manipulate SVG files in Inkscape or Adobe Illustrator.
* Community-detection
* Partition
* Filter
* Preview
* Export
* Save
* Conclusion
High-resolution screenshots
If you prefer hi-resolution PNG screenshots only, look at the icon in the visualization properties
bar, located at the bottom of the visualization.
31. Tutorial
Quick Start Save your project
* Introduction Saving your project encapsulates all data and results in a single
* Import file session file.
* Visualization
* Layout
* Ranking (color)
* Metrics
* Ranking (size) If you missed some steps, you can download the session:
* Layout again
* Show labels LesMiserables.gephi
* Community-detection
* Partition
* Filter
* Preview
* Export
* Save
* Conclusion
32. Tutorial
Quick Start Conclusion
* Introduction In this tutorial you learned the basic process to open, visualize, manipulate and render
* Import file a network file with Gephi.
* Visualization
* Layout
* Ranking (color)
* Metrics
* Ranking (size)
* Layout again
* Show labels
* Community-detection
* Partition
* Filter
* Preview Go further:
* Export • Gephi Website
* Save • Gephi Wiki
• Gephi forum
* Conclusion