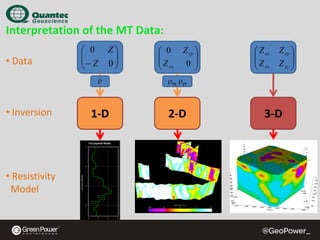
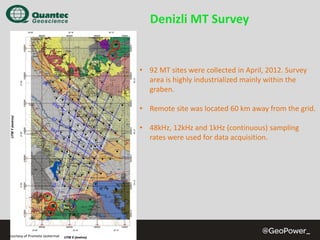
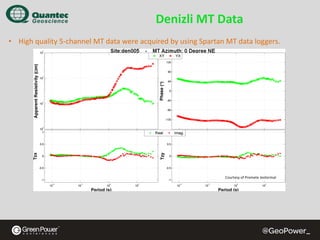
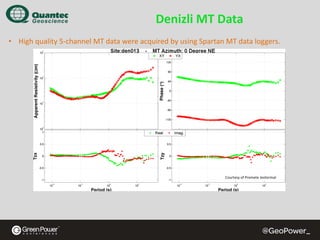
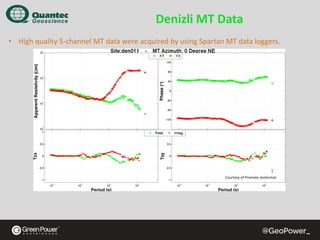
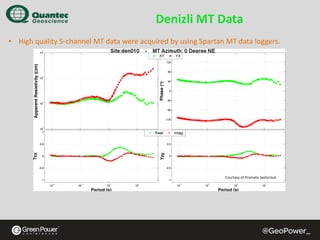
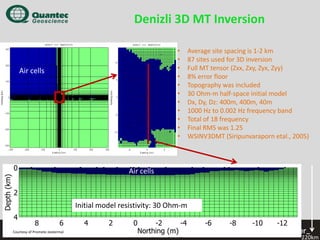
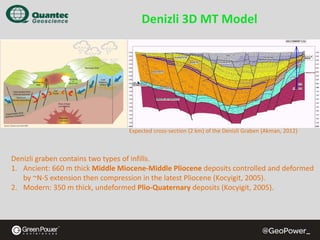
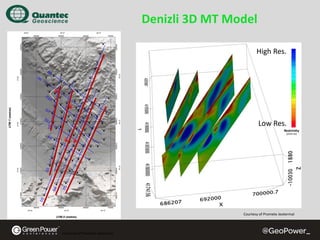
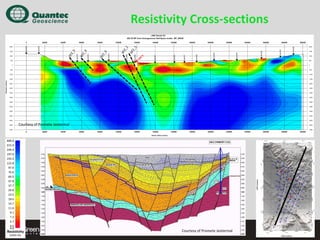
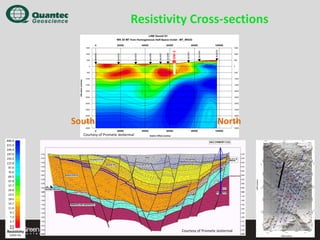
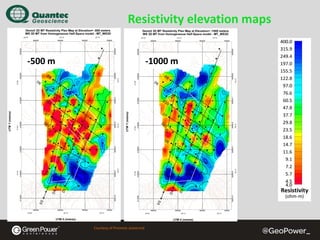
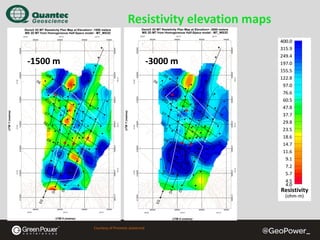
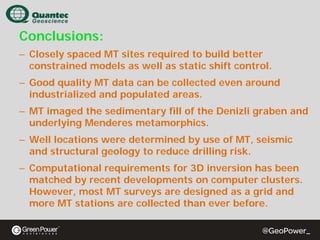
Geothermal resource 
exploration using MT 
in the 
west Anatolian extensional 
province
Mehran Gharibi
Ersan Turkoglu
Quantec Geoscience
Outline
•

Introduction to Quantec Technology & MT

•

Geothermal exploration using MT
•
•

•

Geothermal potential of western Turkey
3D MT Inversion and Interpretation
Summary
Quantec Geoscience Limited

is a world leader in non-seismic ground geophysical exploration with worldwide offices since 1986.
Quantec offers state-of-the-art Deep Earth Imaging Technologies thru our proprietary Orion 3D,
Titan 24 DCIP&MT and Spartan MT data acquisition, processing and interpretation, as well as the
full suite of conventional EM survey methods.

Toronto, Canada
Reno, USA
Hermosillo, Mexico

QIPS, Barbados

Arequipa, Peru
Santiago, Chile

Lobatse, Botswana

Mendoza, Argentina

Brisbane, Australia

www.quantecgeoscience.com
TECHNOLOGY

Stand alone 
5‐channel MT

2D DCIP & MT

3D DCIP & MT
Electric Field Sensors
Magnetic Field Sensors

Coil Calibration Chamber
•

Quantec owns and employs a calibration room
for calibrating magnetic field sensors.

•

The room provides both 3-layer passive
shielding and active field cancellation.

•

Each individual magnetic coil is calibrated
before deployment to the field and coil
calibration constants are archived for each and
every job.

•

Only two facilities of its kind in the world.
Introduction 
To

Magnetotelluric (MT) Method
MT Signal Sources
Lower Frequencies: f < 1 Hz Interaction 
of the solar wind with the earth’s 
magnetic field

NASA

E(ω ) = Z(ω )B(ω )
Higher Frequencies: f > 1 Hz 
Global lightning activities

Thunderstorms
NASA
Seasonal Lightning Map

National Space Science and Technology Centre
MT Signal Sources
• Sunspot activity has 11
year period.
• Last solar maximum was
in 2001.
• Past few years were
tough for MT acquisition
especially at high noise
areas.
Penetration Depth
(Skin Depth)

δ = 503 ρT
δ = 503 100Ωm × 4s

δ = 10060 m ~ 10 km
~ 100Ωm
f = 10 Hz ⇒ δ = 1.6km

f = 40 Hz ⇒ δ = 0.8km

~4s

Increasing depth
Magnetotellurics (MT)

100 ohm.m

10 km

10 ohm.m

1000 ohm.m

E(ω ) = Z(ω )B(ω )

ρa =

1

μ 0ω

Z

Ex
RhoXY ≈
Hy

2

NASA

φ = arg(Z )
Ey
RhoYX ≈
Hx
Interpretation of the MT Data: 
• Data

⎛ 0
⎜
⎜− Z
⎝

Z⎞
⎟
0⎟
⎠

⎛ 0
⎜
⎜Z
⎝ yx

Z xy ⎞
⎟
0 ⎟
⎠

ρ

• Inversion

• Resistivity
Model

2‐D

Z xy ⎞
⎟
Z yy ⎟
⎠

ρxy, ρyx

1‐D

⎛ Z xx
⎜
⎜Z
⎝ yx

3‐D
What is geothermal?
Why Turkey?
Why MT?
What is geothermal?
2

• Heat energy of the earth is 
called geothermal energy.
• Geothermal energy exposed 
to the surface as a result of 
Earth’s cooling mechanism, 
convection.

3

1
First geothermal 
power plant in 
Larderello in 1904 
by Prince Piero
Ginori Conti.

• 90 countries have 
geothermal potential and 70 
of those already utilized 
geothermal energy.
• USA, Philipines, Iceland, 
Indonesia and Italy are some 
of the largest geothermal 
user countries.
What is geothermal?
2

3

1

Courtesy of Promete Jeotermal
Regional Tectonics
• Northward motion of African and Arabian plates
• Closure of the Tehys Ocean 13 Ma
• Arabia‐Eurasia collision and uplifting 

Courtesy of Promete Jeotermal

• Development of NAF and EAF
• Extrusion of Anatolian Block
• Trench roll back and extension.
Geothermal Potential of Turkey
Curie point (580 C) depth 
and heat flow maps of 
Turkey (Aydin, et al., 2005).
Note that the Curie depth 
in western Anatolia is ~10 
km. This is significantly 
shallower than the rest of 
the country.
Higher heat flow values 
>100 mW/m2 are also 
coincident with shallow 
Curie depth.
Geothermal Potential of Turkey
The geothermal systems 
associated with volcanism are 
common in the central and 
eastern part.

500 m depth temperature distribution map, (Korkmaz et al., 2010)

Many hot springs and wells 
with  temperatures >200°C are 
indicating the geothermal 
potential in western Turkey. 
Faults play an important role 
as well as the reservoir in 
western Turkey.
Delineating of the basement 
structure and the faults is 
direct interest to geothermal 
exploration in western Turkey

Location of major geothermal fields in Turkey (Serpen et al., 2009)
Why MT for Geothermal?
High resistivity contrast
Deep penetration
Portable
Non‐invasive
“Lower” cost

after Cumming et al. 2009

after Cumming et al. 2009

Kuyumcu et al., 2009
Denizli MT Survey

• 92 MT sites were collected in April, 2012. Survey 
area is highly industrialized mainly within the 
graben.
• Remote site was located 60 km away from the grid.
• 48kHz, 12kHz and 1kHz (continuous) sampling 
rates were used for data acquisition.

Courtesy of Promete Jeotermal
Denizli MT Data
• High quality 5‐channel MT data were acquired by using Spartan MT data loggers.

Courtesy of Promete Jeotermal
Denizli MT Data
• High quality 5‐channel MT data were acquired by using Spartan MT data loggers.

Courtesy of Promete Jeotermal
Denizli MT Data
• High quality 5‐channel MT data were acquired by using Spartan MT data loggers.

Courtesy of Promete Jeotermal
Denizli MT Data
• High quality 5‐channel MT data were acquired by using Spartan MT data loggers.

Courtesy of Promete Jeotermal
Denizli 3D MT Inversion
•
•
•
•
•
•
•
•
•
•
•

Air cells

Average site spacing is 1‐2 km
87 sites used for 3D inversion
Full MT tensor (Zxx, Zxy, Zyx, Zyy)
8% error floor
Topography was included
30 Ohm‐m half‐space initial model
Dx, Dy, Dz: 400m, 400m, 40m
1000 Hz to 0.002 Hz frequency band
Total of 18 frequency
Final RMS was 1.25 
WSINV3DMT (Siripunvaraporn etal., 2005) 

Air cells

Initial model resistivity: 30 Ohm‐m

Courtesy of Promete Jeotermal

220km
Denizli 3D MT Model

Expected cross‐section (2 km) of the Denizli Graben (Akman, 2012)

Denizli graben contains two types of infills.
1. Ancient: 660 m thick Middle Miocene‐Middle Pliocene deposits controlled and deformed 
by ~N‐S extension then compression in the latest Pliocene (Kocyigit, 2005).
2. Modern: 350 m thick, undeformed Plio‐Quaternary deposits (Kocyigit, 2005).
Denizli 3D MT Model
High Res.

Low Res.

Courtesy of Promete Jeotermal

Courtesy of Promete Jeotermal
Resistivity Cross‐sections

South Jeotermal
Courtesy of Promete

North

Courtesy of Promete Jeotermal
Resistivity Cross‐sections

South

North

Courtesy of Promete Jeotermal

Courtesy of Promete Jeotermal
Resistivity elevation maps
‐500 m

‐1000 m

Courtesy of Promete Jeotermal
Resistivity elevation maps
‐1500 m

‐3000 m

Courtesy of Promete Jeotermal
Conclusions:
– Closely spaced MT sites required to build better
constrained models as well as static shift control.
– Good quality MT data can be collected even around
industrialized and populated areas.
– MT imaged the sedimentary fill of the Denizli graben and
underlying Menderes metamorphics.
– Well locations were determined by use of MT, seismic
and structural geology to reduce drilling risk.
– Computational requirements for 3D inversion has been
matched by recent developments on computer clusters.
However, most MT surveys are designed as a grid and
more MT stations are collected than ever before.
Pamukkale, Denizli, Turkey

Thank You

Geothermal Resource Exploration