Download as PDF, PPTX


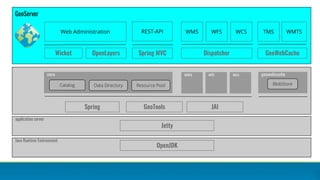


GeoServer is an open-source server designed for sharing and editing geospatial data, emphasizing interoperability and support for major spatial data sources using open standards. It provides functionalities for map publishing, data access, and editing through protocols that facilitate collaboration and integration with various client applications. The document outlines GeoServer's features, configuration processes, and a range of extensions that enhance its capabilities while promoting a community-driven development approach.


![[2018] 고객 사례를 통해 본 클라우드 전환 전략](https://cdn.slidesharecdn.com/ss_thumbnails/cloudinfra06-190131073402-thumbnail.jpg?width=640&height=640&fit=bounds)