This document provides a 3-step process for adding XY data to ArcMap:
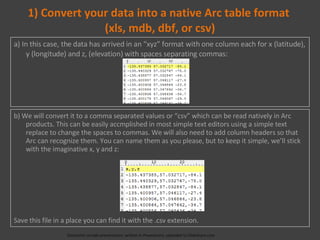
1) Convert data from an XYZ format to a CSV format with column headers for X, Y, and Z coordinates
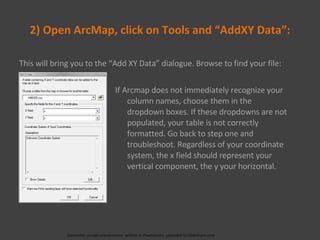
2) Open ArcMap, use the "Add XY Data" tool to browse and select the CSV file
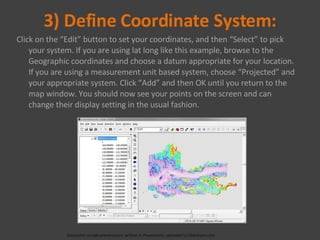
3) Define the coordinate system by selecting the appropriate geographic or projected system to display the points in ArcMap.


![452 Aretxabaleta Energia[1]](https://cdn.slidesharecdn.com/ss_thumbnails/452aretxabaletaenergia1-1210579321573432-8-thumbnail.jpg?width=640&height=640&fit=bounds)