HUMAN RESOURCES
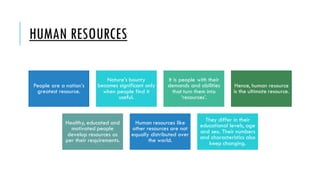
People area nation’s
greatest resource.
Nature’s bounty
becomes significant only
when people find it
useful.
It is people with their
demands and abilities
that turn them into
‘resources’.
Hence, human resource
is the ultimate resource.
Healthy, educated and
motivated people
develop resources as
per their requirements.
Human resources like
other resources are not
equally distributed over
the world.
They differ in their
educational levels, age
and sex. Their numbers
and characteristics also
keep changing.
3.
DO YOU KNOW?
TheGovernment of
India has a Ministry
of Human Resource
Development.
The Ministry was
created in 1985 with
an aim to improve
people’s skills.
This just shows how
important people are
as a resource for the
country.
This Photo by Unknown author is licensed under CC BY-SA.
DO YOU KNOW?
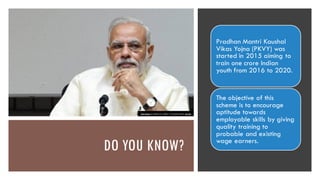
PradhanMantri Kaushal
Vikas Yojna (PKVY) was
started in 2015 aiming to
train one crore Indian
youth from 2016 to 2020.
The objective of this
scheme is to encourage
aptitude towards
employable skills by giving
quality training to
probable and existing
wage earners.
This Photo by Unknown author is licensed under CC BY.
6.
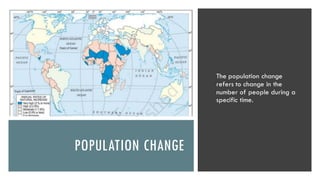
DISTRIBUTION OF POPULATION
Theway in which people are spread across the earth
surface is known as the pattern of population distribution.
More than 90 per cent of the world’s population lives in
about 30 per cent of the land surface.
The distribution of population in the world is extremely
uneven.
7.
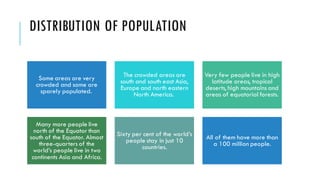
DISTRIBUTION OF POPULATION
Someareas are very
crowded and some are
sparely populated.
The crowded areas are
south and south east Asia,
Europe and north eastern
North America.
Very few people live in high
latitude areas, tropical
deserts, high mountains and
areas of equatorial forests.
Many more people live
north of the Equator than
south of the Equator. Almost
three-quarters of the
world’s people live in two
continents Asia and Africa.
Sixty per cent of the world’s
people stay in just 10
countries.
All of them have more than
a 100 million people.
8.
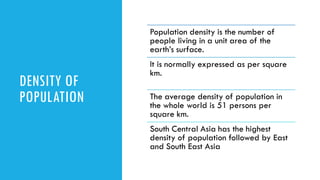
DENSITY OF
POPULATION
Population densityis the number of
people living in a unit area of the
earth’s surface.
It is normally expressed as per square
km.
The average density of population in
the whole world is 51 persons per
square km.
South Central Asia has the highest
density of population followed by East
and South East Asia
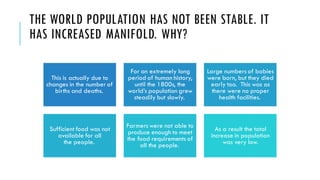
THE WORLD POPULATIONHAS NOT BEEN STABLE. IT
HAS INCREASED MANIFOLD. WHY?
This is actually due to
changes in the number of
births and deaths.
For an extremely long
period of human history,
until the 1800s, the
world’s population grew
steadily but slowly.
Large numbers of babies
were born, but they died
early too. This was as
there were no proper
health facilities.
Sufficient food was not
available for all
the people.
Farmers were not able to
produce enough to meet
the food requirements of
all the people.
As a result the total
increase in population
was very low.
BIRTHS AND DEATHSRATE
Births are usually measured using the birth rate i.e. the number of
live births per 1,000 people.
Deaths are usually measured using the death rate i.e. the number of
deaths per 1,000 people.
Migrations is the movement of people in and out of an area.
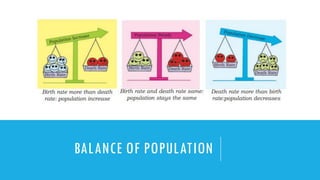
Births and deaths are the natural causes of population change.
The difference between the birth rate and the death rate of a
country is called the natural growth rate.
16.
MIGRATION
Migration is anotherway by which population size
changes.
People may move within a country or between
countries.
Emigrants are people who leave a country;
Immigrants are those who arrive in a country.
Countries like the United States of America and
Australia have gained in-numbers by in-migration
or immigration.
Sudan is an example of a country that has
experienced a loss in population numbers due to
out-migration or emigration.
GENERAL TREND OFINTERNATIONAL
MIGRATIONS
The general trend of international
migrations is from the less developed
nations to the more developed nations-
in search of better employment
opportunities.
19.
WITHIN COUNTRIES LARGENUMBER OF PEOPLE
MAY MOVE FROM THE RURAL TO URBAN
AREAS-
in search of employment
education
health facilities
20.
COMPOSITION OF POPULATION
Thecomposition
of population
helps us to know -
how many are
males or
females,
which age group
they belong to,
how educated
they are and
what type of
occupations they
are employed in,
what their income
levels and health
conditions are.
21.
POPULATION COMPOSITION
To understandthe role of people as a resource, we need to know more
about their qualities.
People vary greatly in their age, sex, literacy level, health condition,
occupation and income level.
It is essential to understand these characteristics of the people.
Population composition refers to the structure of the population.
22.
POPULATION PYRAMID, ALSO
CALLEDAN AGE-SEX PYRAMID.
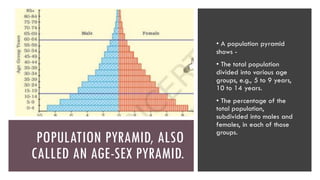
• A population pyramid
shows -
• The total population
divided into various age
groups, e.g., 5 to 9 years,
10 to 14 years.
• The percentage of the
total population,
subdivided into males and
females, in each of those
groups.
23.
POPULATION PYRAMID
The shapeof the population pyramid tells the story of the
people living in that particular country.
The numbers of children (below 15 years) are shown at the
bottom and reflect the level of births.
The size of the top shows the numbers of aged people (above
65 years) and reflects the number of deaths
24.
FUTURE OF ANYNATION
DEPENDS ON -
- Skilled, spirited and hopeful young people
endowed with a positive outlook.
- We in India are fortunate to have such a
resource.
- They must be educated and provided skills
and opportunities to become able and
productive.