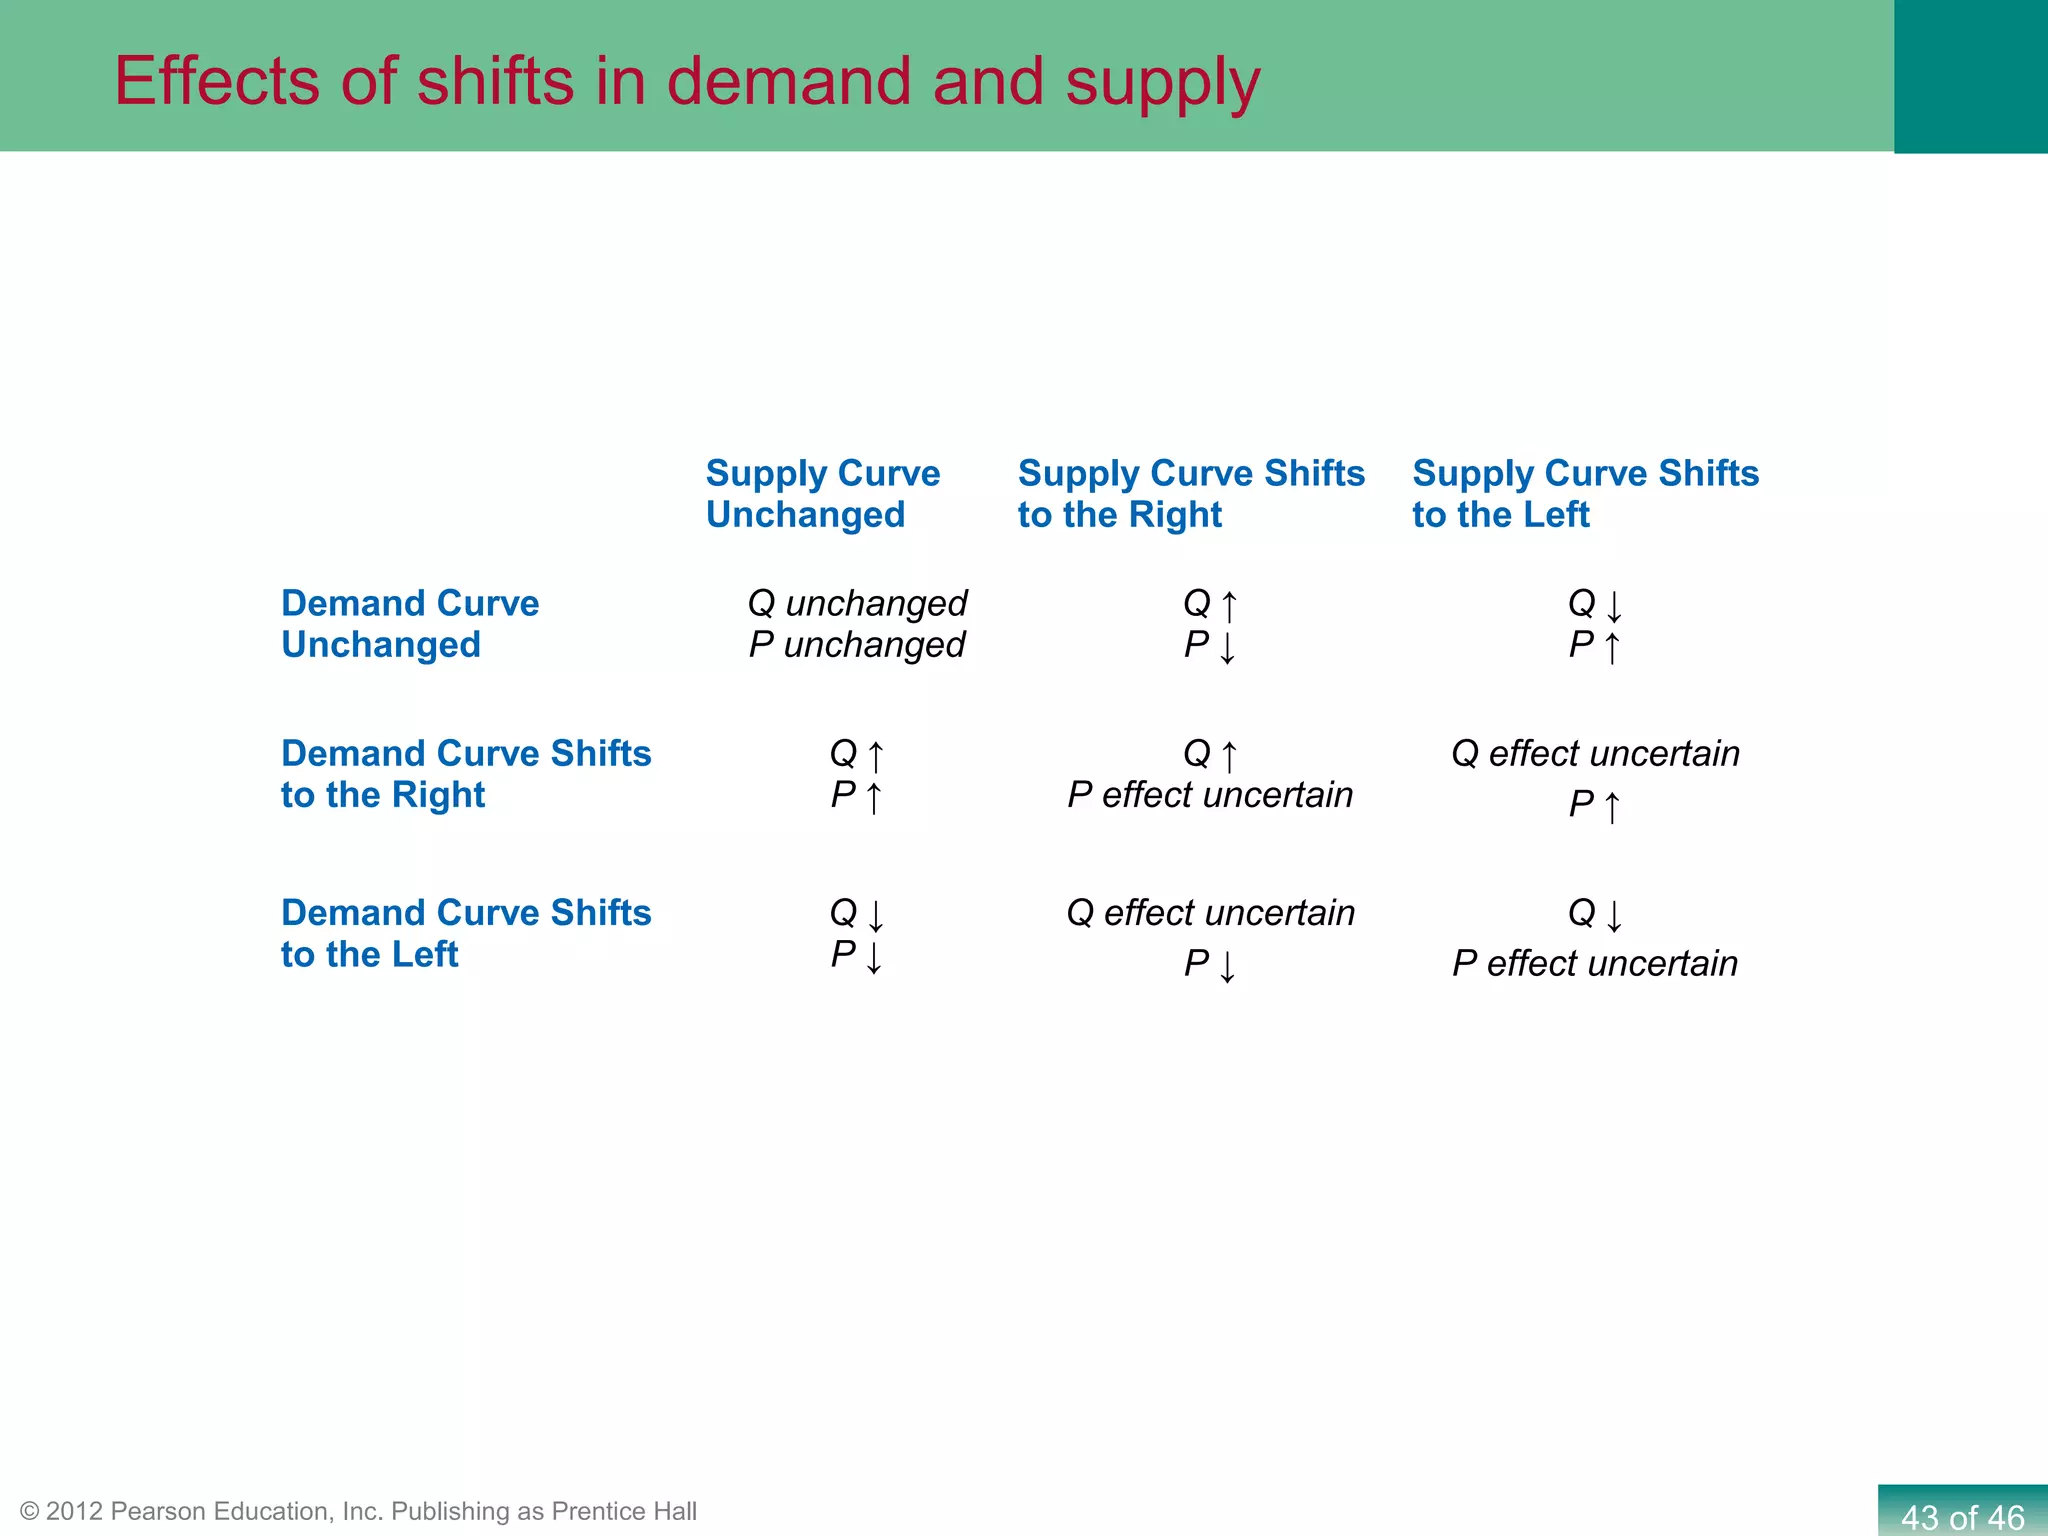
SlideShare a Scribd company logo
1 of 46
R. GLENN
HUBBAR
D
Economics
FOURTH EDITION
ANTHONY PATRICK
O’BRIE
N
2 of 46© 2012 Pearson Education, Inc. Publishing as Prentice Hall
Chapter Outline and
Learning Objectives
CHAPTER
3
3.1 The Demand Side of the
Market
3.2 The Supply Side of the Market
3.3 Market Equilibrium: Putting
Demand and Supply Together
3.4 The Effect of Demand and
Supply Shifts on Equilibrium
Where Prices Come
From: The Interaction
of Demand and Supply
3 of 46© 2012 Pearson Education, Inc. Publishing as Prentice Hall
Demand for tablet computers
•How many tablets do consumers want to buy?
• Affected by price of the tablets
• Affected by other factors, including prices of other goods
Supply of tablet computers
•How many tablets are producers willing to sell?
• Affected by price of the tablets
• Affected by other factors, including prices of other goods
What determines the price of a tablet computer?
4 of 46© 2012 Pearson Education, Inc. Publishing as Prentice Hall
Discuss the variables that influence demand.
3.1 LEARNING OBJECTIVE
The Demand Side of the Market
5 of 46© 2012 Pearson Education, Inc. Publishing as Prentice Hall
Demand Schedule:
Table showing how
many of a product will
be purchased at
various prices.
Demand Curve:
Graphical
representation of
demand schedule.
Price on y-axis.
Quantity demanded on
x-axis.
Figure 3.1
Demand
6 of 46© 2012 Pearson Education, Inc. Publishing as Prentice Hall
Law of Demand:
As price changes,
quantity demanded
changes in opposite
direction, ceteris
paribus.
Implication:
Demand curve slopes
downward
Ceteris Paribus:
Latin phrase meaning
“all else equal”
Figure 3.1
Demand
7 of 46© 2012 Pearson Education, Inc. Publishing as Prentice Hall
Figure 3.2A change in
something other than
price that affects
demand causes the
entire demand curve
to shift.
A shift to the right (D1
to D2) is an increase
in demand.
A shift to the left (D1
to D3) is a decrease
in demand.
Changes in demand
8 of 46© 2012 Pearson Education, Inc. Publishing as Prentice Hall
Figure 3.2As the demand curve
shifts, the quantity
demanded is likely to
change, even if the
price doesn’t change.
The quantity
demanded changes
at every possible
price.
P1
Q3 Q1 Q2
Changes in demand
9 of 46© 2012 Pearson Education, Inc. Publishing as Prentice Hall
Income of consumers
Increase in income increases demand if product is normal,
decreases demand if product is inferior.
Price of related goods
Increase in price of related good increases demand if
products are substitutes, decreases demand if products are
complements
Tastes and preferences
Population and demographics
Expected future prices
What would cause a change in demand?
10 of 46© 2012 Pearson Education, Inc. Publishing as Prentice Hall
Normal goods:
Goods for which the demand increases as
income rises, and decreases as income falls
Examples: Clothing
Restaurant meals
Vacations
Inferior goods:
Goods for which the demand decreases as
income rises, and increases as income falls
Examples: Second-hand clothing
Ramen noodles
Are tablet computers normal or inferior goods?
Probably normal
Effect of increase in income,
if good is normal
Effect of increase in income,
if good is inferior
Changes in demand: consumer incomes
11 of 46© 2012 Pearson Education, Inc. Publishing as Prentice Hall
Substitutes:
Goods and services that can be used for
the same purpose
Examples: Big Mac and Whopper
Ford F-150 and Dodge Ram
Jeans and Khakis
Complements:
Goods and services that are consumed
together
Examples: Big Mac and McDonald’s fries
Hot dogs and hot dog buns
Left shoes and right shoes
Effect on demand for Big
Macs, if price of Whopper
increases
Effect on demand for Big
Macs, if price of McDonald’s
fries increases
Changes in demand: Price of related goods
12 of 46© 2012 Pearson Education, Inc. Publishing as Prentice Hall
If consumers’ tastes or preferences change,
they may buy more or less of the product
Example:
If consumers become more concerned
about eating healthily, they might decrease
their demand for fast food
Effect on demand for fast food,
if consumers want to eat
healthy
Increases in the number of people buying
something will increase the amount
demanded
Example: An increase in the elderly
population increases the
demand for medical care
Effect on demand for medical
care, as the population ages
Changes in demand: Tastes and preferences
Changes in demand: Population and demographics
13 of 46© 2012 Pearson Education, Inc. Publishing as Prentice Hall
Consumers decide which products to buy
and when to buy them.
•Future products are substitutes for current
products
•An expected increase in the price
tomorrow increases demand today.
•An expected decrease in the price
tomorrow decreases demand today.
Example: If you found out the price of
gasoline would go up
tomorrow, you would
increase your demand today.
Effect on today’s gasoline
demand, if price will rise tomorrow
Changes in demand: Expected future prices
14 of 46© 2012 Pearson Education, Inc. Publishing as Prentice Hall
Apple’s policy on speculation about
future products
Making
the
Connection
Apple strongly discourages its employees from speculating about
when a new model will appear. Why?
Suppose a customer learns that a new iPad model will be
available next month.
•The new model is a potential substitute for the current model
•The price of the current model will likely fall next month
•Both effects decrease current demand (bad for Apple!)
15 of 46© 2012 Pearson Education, Inc. Publishing as Prentice Hall
Figure 3.3
A change in the price
of the product being
examined causes a
movement along the
demand curve.
This is a change in
quantity demanded.
Any other change
affecting demand
causes the entire
demand curve to
shift.
This is a change in
demand.
Change in demand vs. change in quantity demanded
16 of 46© 2012 Pearson Education, Inc. Publishing as Prentice Hall
Discuss the variables that influence supply.
3.2 LEARNING OBJECTIVE
The Supply Side of the Market
17 of 46© 2012 Pearson Education, Inc. Publishing as Prentice Hall
Figure 3.4Supply Schedule:
Table showing how
many of a product will
be available for
purchase at various
prices.
Supply Curve:
Graphical representation of supply
schedule.
Price on y-axis.
Quantity demanded on x-axis.
Supply schedule and supply curve
18 of 46© 2012 Pearson Education, Inc. Publishing as Prentice Hall
Figure 3.4
Law of Supply:
As price changes, quantity supplied
changes in the same direction, ceteris
paribus.
Implication:
supply curve slopes upward
Law of supply
19 of 46© 2012 Pearson Education, Inc. Publishing as Prentice Hall
Figure 3.5
A change in something
other than price that
affects supply causes
the entire supply curve
to shift.
A shift to the right (S1 to
S3) is an increase in
supply.
A shift to the left (S1 to
S2) is a decrease in
supply.
Changes in supply
20 of 46© 2012 Pearson Education, Inc. Publishing as Prentice Hall
Figure 3.5
As the supply curve
shifts, the quantity
supplied is likely to
change, even if the
price doesn’t
change.
The quantity
supplied changes
at every possible
price.
P1
Q2 Q1 Q3
Changes in supply
21 of 46© 2012 Pearson Education, Inc. Publishing as Prentice Hall
Price of inputs
Technological change
Prices of substitutes in production
Number of firms in the market
Expected future prices
What would cause a change in supply?
22 of 46© 2012 Pearson Education, Inc. Publishing as Prentice Hall
Inputs are things used in the production
of a good or service.
Examples of inputs for tablet computers:
Computer processor
Plastic housing
Labor
An increase in the price of an input
decreases the profitability of selling the
good, causing a decrease in supply.
A decrease in the price of an input
increases the profitability of selling the
good, causing an increase in supply.
Effect of an increase in the
price of input goods
Effect of a decrease in the
price of input goods
Changes in supply: Price of inputs
23 of 46© 2012 Pearson Education, Inc. Publishing as Prentice Hall
A firm may experience a positive or
negative change in its ability to produce
output given a fixed amount of inputs.
Examples:
A new, more productive variety of
wheat would increase the supply of
wheat.
Governmental restrictions on land
use for agriculture might decrease the
supply of wheat.
Changes raise or lower firms’ costs,
hence their supply of the good.
Effect of a positive change
in technology
Effect of a negative change
in technology
Changes in supply: Technological change
24 of 46© 2012 Pearson Education, Inc. Publishing as Prentice Hall
Many firms can produce and sell more
than one product.
Example:
An Illinois farmer can plant corn or
soybeans. If the price of soybeans rises,
he will plant (supply) less corn.
Effect on the supply of corn,
of an increase in the price of
soybeans
Effect of a increase in the
number of firms
More firms in the market will result in
more product available at a given price
(greater supply).
Fewer firms → supply decreases.
Changes in supply: Prices of substitutes in production
Changes in supply: Number of firms in the market
25 of 46© 2012 Pearson Education, Inc. Publishing as Prentice Hall
If a firm anticipates the price of its
product will be higher in the future, it
might decrease its supply today in order
to increase it in the future.
What types of products could be “stored”
like this?
Non-perishable products
Effect of an increase in
future expected price of a
good
Changes in supply: Expected future prices
26 of 46© 2012 Pearson Education, Inc. Publishing as Prentice Hall
Release timing of Collateral Damage
Making
the
Connection
The Schwartzenegger film Collateral Damage was originally
scheduled to be released on October 5, 2001.
The film contained plot elements about terrorist attacks.
The production company (Warner Bros.) decided the movie
would have higher demand (higher expected future prices) if it
did not show immediately after 9/11, so it was delayed until
February 2002.
27 of 46© 2012 Pearson Education, Inc. Publishing as Prentice Hall
Figure 3.6
A change in the price of
the product being
examined causes a
movement along the
supply curve.
This is a change in
quantity supplied.
Any other change
affecting supply causes
the entire supply curve to
shift.
This is a change in
supply.
Change in supply vs. change in quantity supplied
28 of 46© 2012 Pearson Education, Inc. Publishing as Prentice Hall
Use a graph to illustrate market equilibrium.
3.3 LEARNING OBJECTIVE
Market Equilibrium: Putting Demand and Supply
Together
29 of 46© 2012 Pearson Education, Inc. Publishing as Prentice Hall
Figure 3.8If the price of a tablet is
$600, consumers want to
buy 4 million per month,
while producers want to
sell 6 million.
This gives a surplus of 2
million tablets.
Prediction: sellers will
compete amongst
themselves, driving the
price down.
Surplus
30 of 46© 2012 Pearson Education, Inc. Publishing as Prentice Hall
If the price of a tablet is
$300, consumers want to
buy 7 million per month,
while producers want to
sell 3 million.
This gives a shortage of
4 million tablets.
Prediction: sellers will
realize they can increase
the price and still sell as
many tablets, so the price
will rise.
Shortage
Figure 3.8
31 of 46© 2012 Pearson Education, Inc. Publishing as Prentice Hall
At a price of $500,
consumers want to buy
5 million tablets, and
producers want to sell 5
million.
There is no reason for
the price to change.
Equilibrium price:
$500
Equilibrium quantity:
5 million per month
Figure 3.7
Market equilibrium
32 of 46© 2012 Pearson Education, Inc. Publishing as Prentice Hall
Price is determined by the interaction of buyers and sellers.
Neither group can dictate price in a competitive market (i.e. one
with many buyers and sellers).
However changes in supply and/or demand will affect the price
and quantity traded.
Who determines price, buyers or sellers?
33 of 46© 2012 Pearson Education, Inc. Publishing as Prentice Hall
Use demand and supply graphs to predict changes in prices and
quantities.
3.4 LEARNING OBJECTIVE
The Effect of Demand and Supply Shifts on Equilibrium
34 of 46© 2012 Pearson Education, Inc. Publishing as Prentice Hall
Predictions about price and quantity in model require us to know
supply and demand curves.
Typically, we know price and quantity, but do not know the
curves that generate them.
The power of the supply and demand model is in its ability to
predict directional changes in price and quantity traded.
Usefulness of the supply and demand model
35 of 46© 2012 Pearson Education, Inc. Publishing as Prentice Hall
Toshiba enters the tablet
computer market,
introducing the Thrive.
More tablets are
available at any given
price – an increase in
supply from S1 to S2.
Equilibrium price falls
from P1 to P2.
Equilibrium quantity rises
from Q1 to Q2.
The effect of shifts in supply on equilibrium
Figure 3.9
36 of 46© 2012 Pearson Education, Inc. Publishing as Prentice Hall
Figure 3.9
The effect of shifts in supply on equilibrium
By how much will price
fall? By how much will
quantity rise?
We cannot say, without
knowing more
information.
For now, we can only
predict that price will
fall and quantity traded
will rise.
37 of 46© 2012 Pearson Education, Inc. Publishing as Prentice Hall
Figure 3.10Consumer incomes
increase. What happens
to equilibrium in the
tablet market?
Tablets are normal
goods, so as income
rises, demand rises
(D1 to D2).
Equilibrium price rises
(P1 to P2).
Equilibrium quantity
rises (Q1 to Q2).
The effect of shifts in demand on equilibrium
38 of 46© 2012 Pearson Education, Inc. Publishing as Prentice Hall
Table 3.3
Supply Curve
Unchanged
Supply Curve Shifts
to the Right
Supply Curve Shifts
to the Left
Demand Curve
Unchanged
Q unchanged
P unchanged
Q ↑
P ↓
Q ↓
P ↑
Demand Curve Shifts
to the Right Q ↑
P ↑
Demand Curve Shifts
to the Left
Q ↓
P ↓
Effects of shifts in demand and supply
39 of 46© 2012 Pearson Education, Inc. Publishing as Prentice Hall
The Falling Price of Blu-ray Players
Making
the
Connection
From 2006 to 2010, the price of
Blu-ray players fell from almost
$1000 to about $120, while the
number of Blu-ray players traded
increased dramatically.
What best explains this change?
A: Increase in demand
B: Decrease in demand
C: Increase in supply
D: Decrease in supply
Can you show this change on a
supply-and-demand diagram?
40 of 46© 2012 Pearson Education, Inc. Publishing as Prentice Hall
The Falling Price of Blu-ray Players
Making
the
Connection
Supply increased as additional firms started manufacturing Blu-
ray players and input costs fell.
41 of 46© 2012 Pearson Education, Inc. Publishing as Prentice Hall
Suppose supply and demand
both increase.
What does our model predict?
S↑  ( P↓ and Q↑ )
D↑  ( P↑ and Q↑ )
So we can be sure
equilibrium quantity will rise;
but the effect on equilibrium
price is not clear.
Effect on price depends on
how far each curve moves.
In this graph, demand
moves more than supply.
Simultaneous shifts in supply and demand
42 of 46© 2012 Pearson Education, Inc. Publishing as Prentice Hall
Suppose supply and demand
both increase.
What does our model predict?
S↑  ( P↓ and Q↑ )
D↑  ( P↑ and Q↑ )
So we can be sure equilibrium
quantity will rise; but the effect
on equilibrium price is not
clear.
Effect on price depends on
how far each curve moves.
In this graph, supply moves
more than demand.
Simultaneous shifts in supply and demand
43 of 46© 2012 Pearson Education, Inc. Publishing as Prentice Hall
Supply Curve
Unchanged
Supply Curve Shifts
to the Right
Supply Curve Shifts
to the Left
Demand Curve
Unchanged
Q unchanged
P unchanged
Q ↑
P ↓
Q ↓
P ↑
Demand Curve Shifts
to the Right
Q ↑
P ↑
Q ↑
P effect uncertain
Q effect uncertain
P ↑
Demand Curve Shifts
to the Left
Q ↓
P ↓
Q effect uncertain
P ↓
Q ↓
P effect uncertain
Effects of shifts in demand and supply
44 of 46© 2012 Pearson Education, Inc. Publishing as Prentice Hall
Over time, it is common for both supply and demand to shift.
The stronger of the two effects will determine the overall change
in price and quantity.
In the Blu-ray example, demand for Blu-ray players increased
from 2006 to 2010. But the supply effect was stronger.
How can we tell? Because we know the price fell; if the demand
effect were stronger, the price would have risen.
Supply and demand shifts over time
45 of 46© 2012 Pearson Education, Inc. Publishing as Prentice Hall
Terminology: movement along the curve (caused by price
change) vs. shifting the curve (caused by other changes).
Not moving curves far enough to be able to illustrate a change.
Exaggerating curve shifts is okay.
Incompletely labeling diagrams.
Use your arrows!
Common misconceptions to avoid
46 of 46© 2012 Pearson Education, Inc. Publishing as Prentice Hall
Shifting a curve, then shifting another curve due to the resulting
price change.
The price change does not cause a further shift in demand or
supply.
Being certain of both price and quantity changes when both
demand and supply curves move.
Only one of these effects will be certain.
Common misconceptions to avoid

More Related Content

Viewers also liked

Viewers also liked (11)

Ge273.u5.pp1
Ge273.u5.pp1Ge273.u5.pp1
Ge273.u5.pp1
 
Ge273 u6 ho4e_micro_ch10_1click
Ge273 u6 ho4e_micro_ch10_1clickGe273 u6 ho4e_micro_ch10_1click
Ge273 u6 ho4e_micro_ch10_1click
 
Ge273.u3.pp2
Ge273.u3.pp2Ge273.u3.pp2
Ge273.u3.pp2
 
Micro ch4 ppt
Micro ch4 pptMicro ch4 ppt
Micro ch4 ppt
 
Ge273.u1.pp1
Ge273.u1.pp1Ge273.u1.pp1
Ge273.u1.pp1
 
Ge273.u2.pp1
Ge273.u2.pp1Ge273.u2.pp1
Ge273.u2.pp1
 
Ge273.u10.pp1
Ge273.u10.pp1Ge273.u10.pp1
Ge273.u10.pp1
 
Ge273.u4.pp1
Ge273.u4.pp1Ge273.u4.pp1
Ge273.u4.pp1
 
Ge273.u2.pp1
Ge273.u2.pp1Ge273.u2.pp1
Ge273.u2.pp1
 
4.1 the chain rule
4.1 the chain rule4.1 the chain rule
4.1 the chain rule
 
Les5e ppt 04
Les5e ppt 04Les5e ppt 04
Les5e ppt 04
 

Similar to Ge273.u3.pp1

Chapter 3 lecture presentation
Chapter 3 lecture presentationChapter 3 lecture presentation
Chapter 3 lecture presentationAhmed Mousa
 
chapter 3 microeconomics.pptx
chapter 3 microeconomics.pptxchapter 3 microeconomics.pptx
chapter 3 microeconomics.pptxHaider Ali
 
basiceconomicsppt-13100406150jbhbhh9-phpapp01.pdf
basiceconomicsppt-13100406150jbhbhh9-phpapp01.pdfbasiceconomicsppt-13100406150jbhbhh9-phpapp01.pdf
basiceconomicsppt-13100406150jbhbhh9-phpapp01.pdfesiyasmengesha
 
Economics Presentation PGDM.pptx
Economics Presentation PGDM.pptxEconomics Presentation PGDM.pptx
Economics Presentation PGDM.pptxSaurabhMehra30
 
Basics of economics
Basics of economicsBasics of economics
Basics of economicsDoukan10
 
Basic of Supply and Demand - Economic
Basic of Supply and Demand - EconomicBasic of Supply and Demand - Economic
Basic of Supply and Demand - EconomicAbdullah Kareem
 
2. market demand compared with supply
2. market demand compared with supply2. market demand compared with supply
2. market demand compared with supplyhfonfe
 
Unit 2 Lesson 3 Presentation
Unit 2 Lesson 3 PresentationUnit 2 Lesson 3 Presentation
Unit 2 Lesson 3 PresentationDerek D'Angelo
 
PARKIN12E_ECONOMICS_Ch03.pptx, IOBM University
PARKIN12E_ECONOMICS_Ch03.pptx, IOBM UniversityPARKIN12E_ECONOMICS_Ch03.pptx, IOBM University
PARKIN12E_ECONOMICS_Ch03.pptx, IOBM Universitylamiasalahuddin93
 
Factors affecting demand and supply by jaya singh
Factors affecting demand and supply by jaya singhFactors affecting demand and supply by jaya singh
Factors affecting demand and supply by jaya singhAMAN KUMAR KUSHWAHA
 
Module 2b demand and supply
Module 2b   demand and supplyModule 2b   demand and supply
Module 2b demand and supplyLumen Learning
 
ndsupply-udh0715165814-lva1-app6892.pptx
ndsupply-udh0715165814-lva1-app6892.pptxndsupply-udh0715165814-lva1-app6892.pptx
ndsupply-udh0715165814-lva1-app6892.pptxanaskhalidsheikh6395
 
How do we determine prices?
How do we determine prices?How do we determine prices?
How do we determine prices?Susanna Pierce
 

Similar to Ge273.u3.pp1 (20)

Micro ch3 ppt
Micro ch3 pptMicro ch3 ppt
Micro ch3 ppt
 
Chapter 3 lecture presentation
Chapter 3 lecture presentationChapter 3 lecture presentation
Chapter 3 lecture presentation
 
chapter 3 microeconomics.pptx
chapter 3 microeconomics.pptxchapter 3 microeconomics.pptx
chapter 3 microeconomics.pptx
 
ch03.ppt
ch03.pptch03.ppt
ch03.ppt
 
Basic economics ppt
Basic economics pptBasic economics ppt
Basic economics ppt
 
basiceconomicsppt-13100406150jbhbhh9-phpapp01.pdf
basiceconomicsppt-13100406150jbhbhh9-phpapp01.pdfbasiceconomicsppt-13100406150jbhbhh9-phpapp01.pdf
basiceconomicsppt-13100406150jbhbhh9-phpapp01.pdf
 
Economics Presentation PGDM.pptx
Economics Presentation PGDM.pptxEconomics Presentation PGDM.pptx
Economics Presentation PGDM.pptx
 
Basics of economics
Basics of economicsBasics of economics
Basics of economics
 
Supply
SupplySupply
Supply
 
Basic of Supply and Demand - Economic
Basic of Supply and Demand - EconomicBasic of Supply and Demand - Economic
Basic of Supply and Demand - Economic
 
Law Of Supply PPT
Law Of Supply PPTLaw Of Supply PPT
Law Of Supply PPT
 
2. market demand compared with supply
2. market demand compared with supply2. market demand compared with supply
2. market demand compared with supply
 
Demand
DemandDemand
Demand
 
Unit 2 Lesson 3 Presentation
Unit 2 Lesson 3 PresentationUnit 2 Lesson 3 Presentation
Unit 2 Lesson 3 Presentation
 
Supply 2
Supply 2Supply 2
Supply 2
 
PARKIN12E_ECONOMICS_Ch03.pptx, IOBM University
PARKIN12E_ECONOMICS_Ch03.pptx, IOBM UniversityPARKIN12E_ECONOMICS_Ch03.pptx, IOBM University
PARKIN12E_ECONOMICS_Ch03.pptx, IOBM University
 
Factors affecting demand and supply by jaya singh
Factors affecting demand and supply by jaya singhFactors affecting demand and supply by jaya singh
Factors affecting demand and supply by jaya singh
 
Module 2b demand and supply
Module 2b   demand and supplyModule 2b   demand and supply
Module 2b demand and supply
 
ndsupply-udh0715165814-lva1-app6892.pptx
ndsupply-udh0715165814-lva1-app6892.pptxndsupply-udh0715165814-lva1-app6892.pptx
ndsupply-udh0715165814-lva1-app6892.pptx
 
How do we determine prices?
How do we determine prices?How do we determine prices?
How do we determine prices?
 

More from Subas Nandy

Les7e ppt ada_0103
Les7e ppt ada_0103Les7e ppt ada_0103
Les7e ppt ada_0103Subas Nandy
 
Les7e ppt ada_0102
Les7e ppt ada_0102Les7e ppt ada_0102
Les7e ppt ada_0102Subas Nandy
 
Les7e ppt ada_0101
Les7e ppt ada_0101Les7e ppt ada_0101
Les7e ppt ada_0101Subas Nandy
 
Week1 newtons laws_of_motion
Week1 newtons laws_of_motionWeek1 newtons laws_of_motion
Week1 newtons laws_of_motionSubas Nandy
 
052516 week11 quantum computers
052516 week11 quantum computers052516 week11 quantum computers
052516 week11 quantum computersSubas Nandy
 
052516 week11 quantum3
052516 week11 quantum3052516 week11 quantum3
052516 week11 quantum3Subas Nandy
 
052516 week11 quantum2
052516 week11 quantum2052516 week11 quantum2
052516 week11 quantum2Subas Nandy
 
052516 week11 quantum1
052516 week11 quantum1052516 week11 quantum1
052516 week11 quantum1Subas Nandy
 
0511 week10 resonance
0511 week10 resonance0511 week10 resonance
0511 week10 resonanceSubas Nandy
 
0511 week10 second_reflection
0511 week10 second_reflection0511 week10 second_reflection
0511 week10 second_reflectionSubas Nandy
 
0511 week10 reflection and refraction
0511 week10  reflection and refraction0511 week10  reflection and refraction
0511 week10 reflection and refractionSubas Nandy
 
Sound&resonance
Sound&resonanceSound&resonance
Sound&resonanceSubas Nandy
 
051116 week9 waves
051116 week9 waves051116 week9 waves
051116 week9 wavesSubas Nandy
 
050316 week8 c12-electromagnetic_waves
050316 week8 c12-electromagnetic_waves050316 week8 c12-electromagnetic_waves
050316 week8 c12-electromagnetic_wavesSubas Nandy
 
050316 week 8_electromagnetism (1)
050316 week 8_electromagnetism (1)050316 week 8_electromagnetism (1)
050316 week 8_electromagnetism (1)Subas Nandy
 
0503 week8 electromagnetism
0503 week8 electromagnetism0503 week8 electromagnetism
0503 week8 electromagnetismSubas Nandy
 
Ge273.u7 ho4e micro_ch11_1click
Ge273.u7 ho4e micro_ch11_1clickGe273.u7 ho4e micro_ch11_1click
Ge273.u7 ho4e micro_ch11_1clickSubas Nandy
 

More from Subas Nandy (20)

Les7e ppt ada_0103
Les7e ppt ada_0103Les7e ppt ada_0103
Les7e ppt ada_0103
 
Les7e ppt ada_0102
Les7e ppt ada_0102Les7e ppt ada_0102
Les7e ppt ada_0102
 
Les7e ppt ada_0101
Les7e ppt ada_0101Les7e ppt ada_0101
Les7e ppt ada_0101
 
Week1 newtons laws_of_motion
Week1 newtons laws_of_motionWeek1 newtons laws_of_motion
Week1 newtons laws_of_motion
 
Les5e ppt 05
Les5e ppt 05Les5e ppt 05
Les5e ppt 05
 
052516 week11 quantum computers
052516 week11 quantum computers052516 week11 quantum computers
052516 week11 quantum computers
 
052516 week11 quantum3
052516 week11 quantum3052516 week11 quantum3
052516 week11 quantum3
 
052516 week11 quantum2
052516 week11 quantum2052516 week11 quantum2
052516 week11 quantum2
 
052516 week11 quantum1
052516 week11 quantum1052516 week11 quantum1
052516 week11 quantum1
 
Ge273.u9.pp1
Ge273.u9.pp1Ge273.u9.pp1
Ge273.u9.pp1
 
0511 week10 resonance
0511 week10 resonance0511 week10 resonance
0511 week10 resonance
 
0511 week10 second_reflection
0511 week10 second_reflection0511 week10 second_reflection
0511 week10 second_reflection
 
0511 week10 reflection and refraction
0511 week10  reflection and refraction0511 week10  reflection and refraction
0511 week10 reflection and refraction
 
Ge273.u8.pp1
Ge273.u8.pp1Ge273.u8.pp1
Ge273.u8.pp1
 
Sound&resonance
Sound&resonanceSound&resonance
Sound&resonance
 
051116 week9 waves
051116 week9 waves051116 week9 waves
051116 week9 waves
 
050316 week8 c12-electromagnetic_waves
050316 week8 c12-electromagnetic_waves050316 week8 c12-electromagnetic_waves
050316 week8 c12-electromagnetic_waves
 
050316 week 8_electromagnetism (1)
050316 week 8_electromagnetism (1)050316 week 8_electromagnetism (1)
050316 week 8_electromagnetism (1)
 
0503 week8 electromagnetism
0503 week8 electromagnetism0503 week8 electromagnetism
0503 week8 electromagnetism
 
Ge273.u7 ho4e micro_ch11_1click
Ge273.u7 ho4e micro_ch11_1clickGe273.u7 ho4e micro_ch11_1click
Ge273.u7 ho4e micro_ch11_1click
 

Recently uploaded

BAG TECHNIQUE Bag technique-a tool making use of public health bag through wh...
BAG TECHNIQUE Bag technique-a tool making use of public health bag through wh...BAG TECHNIQUE Bag technique-a tool making use of public health bag through wh...
BAG TECHNIQUE Bag technique-a tool making use of public health bag through wh...Sapna Thakur
 
BASLIQ CURRENT LOOKBOOK LOOKBOOK(1) (1).pdf
BASLIQ CURRENT LOOKBOOK  LOOKBOOK(1) (1).pdfBASLIQ CURRENT LOOKBOOK  LOOKBOOK(1) (1).pdf
BASLIQ CURRENT LOOKBOOK LOOKBOOK(1) (1).pdfSoniaTolstoy
 
fourth grading exam for kindergarten in writing
fourth grading exam for kindergarten in writingfourth grading exam for kindergarten in writing
fourth grading exam for kindergarten in writingTeacherCyreneCayanan
 
Web & Social Media Analytics Previous Year Question Paper.pdf
Web & Social Media Analytics Previous Year Question Paper.pdfWeb & Social Media Analytics Previous Year Question Paper.pdf
Web & Social Media Analytics Previous Year Question Paper.pdfJayanti Pande
 
Explore beautiful and ugly buildings. Mathematics helps us create beautiful d...
Explore beautiful and ugly buildings. Mathematics helps us create beautiful d...Explore beautiful and ugly buildings. Mathematics helps us create beautiful d...
Explore beautiful and ugly buildings. Mathematics helps us create beautiful d...christianmathematics
 
General AI for Medical Educators April 2024
General AI for Medical Educators April 2024General AI for Medical Educators April 2024
General AI for Medical Educators April 2024Janet Corral
 
Software Engineering Methodologies (overview)
Software Engineering Methodologies (overview)Software Engineering Methodologies (overview)
Software Engineering Methodologies (overview)eniolaolutunde
 
The basics of sentences session 2pptx copy.pptx
The basics of sentences session 2pptx copy.pptxThe basics of sentences session 2pptx copy.pptx
The basics of sentences session 2pptx copy.pptxheathfieldcps1
 
Class 11th Physics NEET formula sheet pdf
Class 11th Physics NEET formula sheet pdfClass 11th Physics NEET formula sheet pdf
Class 11th Physics NEET formula sheet pdfAyushMahapatra5
 
Paris 2024 Olympic Geographies - an activity
Paris 2024 Olympic Geographies - an activityParis 2024 Olympic Geographies - an activity
Paris 2024 Olympic Geographies - an activityGeoBlogs
 
Z Score,T Score, Percential Rank and Box Plot Graph
Z Score,T Score, Percential Rank and Box Plot GraphZ Score,T Score, Percential Rank and Box Plot Graph
Z Score,T Score, Percential Rank and Box Plot GraphThiyagu K
 
Unit-IV- Pharma. Marketing Channels.pptx
Unit-IV- Pharma. Marketing Channels.pptxUnit-IV- Pharma. Marketing Channels.pptx
Unit-IV- Pharma. Marketing Channels.pptxVishalSingh1417
 
Ecosystem Interactions Class Discussion Presentation in Blue Green Lined Styl...
Ecosystem Interactions Class Discussion Presentation in Blue Green Lined Styl...Ecosystem Interactions Class Discussion Presentation in Blue Green Lined Styl...
Ecosystem Interactions Class Discussion Presentation in Blue Green Lined Styl...fonyou31
 
microwave assisted reaction. General introduction
microwave assisted reaction. General introductionmicrowave assisted reaction. General introduction
microwave assisted reaction. General introductionMaksud Ahmed
 
The Most Excellent Way | 1 Corinthians 13
The Most Excellent Way | 1 Corinthians 13The Most Excellent Way | 1 Corinthians 13
The Most Excellent Way | 1 Corinthians 13Steve Thomason
 
Disha NEET Physics Guide for classes 11 and 12.pdf
Disha NEET Physics Guide for classes 11 and 12.pdfDisha NEET Physics Guide for classes 11 and 12.pdf
Disha NEET Physics Guide for classes 11 and 12.pdfchloefrazer622
 
Russian Escort Service in Delhi 11k Hotel Foreigner Russian Call Girls in Delhi
Russian Escort Service in Delhi 11k Hotel Foreigner Russian Call Girls in DelhiRussian Escort Service in Delhi 11k Hotel Foreigner Russian Call Girls in Delhi
Russian Escort Service in Delhi 11k Hotel Foreigner Russian Call Girls in Delhikauryashika82
 
Call Girls in Dwarka Mor Delhi Contact Us 9654467111
Call Girls in Dwarka Mor Delhi Contact Us 9654467111Call Girls in Dwarka Mor Delhi Contact Us 9654467111
Call Girls in Dwarka Mor Delhi Contact Us 9654467111Sapana Sha
 

Recently uploaded (20)

BAG TECHNIQUE Bag technique-a tool making use of public health bag through wh...
BAG TECHNIQUE Bag technique-a tool making use of public health bag through wh...BAG TECHNIQUE Bag technique-a tool making use of public health bag through wh...
BAG TECHNIQUE Bag technique-a tool making use of public health bag through wh...
 
BASLIQ CURRENT LOOKBOOK LOOKBOOK(1) (1).pdf
BASLIQ CURRENT LOOKBOOK  LOOKBOOK(1) (1).pdfBASLIQ CURRENT LOOKBOOK  LOOKBOOK(1) (1).pdf
BASLIQ CURRENT LOOKBOOK LOOKBOOK(1) (1).pdf
 
fourth grading exam for kindergarten in writing
fourth grading exam for kindergarten in writingfourth grading exam for kindergarten in writing
fourth grading exam for kindergarten in writing
 
Web & Social Media Analytics Previous Year Question Paper.pdf
Web & Social Media Analytics Previous Year Question Paper.pdfWeb & Social Media Analytics Previous Year Question Paper.pdf
Web & Social Media Analytics Previous Year Question Paper.pdf
 
Explore beautiful and ugly buildings. Mathematics helps us create beautiful d...
Explore beautiful and ugly buildings. Mathematics helps us create beautiful d...Explore beautiful and ugly buildings. Mathematics helps us create beautiful d...
Explore beautiful and ugly buildings. Mathematics helps us create beautiful d...
 
General AI for Medical Educators April 2024
General AI for Medical Educators April 2024General AI for Medical Educators April 2024
General AI for Medical Educators April 2024
 
Software Engineering Methodologies (overview)
Software Engineering Methodologies (overview)Software Engineering Methodologies (overview)
Software Engineering Methodologies (overview)
 
The basics of sentences session 2pptx copy.pptx
The basics of sentences session 2pptx copy.pptxThe basics of sentences session 2pptx copy.pptx
The basics of sentences session 2pptx copy.pptx
 
Mattingly "AI & Prompt Design: Structured Data, Assistants, & RAG"
Mattingly "AI & Prompt Design: Structured Data, Assistants, & RAG"Mattingly "AI & Prompt Design: Structured Data, Assistants, & RAG"
Mattingly "AI & Prompt Design: Structured Data, Assistants, & RAG"
 
Class 11th Physics NEET formula sheet pdf
Class 11th Physics NEET formula sheet pdfClass 11th Physics NEET formula sheet pdf
Class 11th Physics NEET formula sheet pdf
 
Paris 2024 Olympic Geographies - an activity
Paris 2024 Olympic Geographies - an activityParis 2024 Olympic Geographies - an activity
Paris 2024 Olympic Geographies - an activity
 
Z Score,T Score, Percential Rank and Box Plot Graph
Z Score,T Score, Percential Rank and Box Plot GraphZ Score,T Score, Percential Rank and Box Plot Graph
Z Score,T Score, Percential Rank and Box Plot Graph
 
Unit-IV- Pharma. Marketing Channels.pptx
Unit-IV- Pharma. Marketing Channels.pptxUnit-IV- Pharma. Marketing Channels.pptx
Unit-IV- Pharma. Marketing Channels.pptx
 
Ecosystem Interactions Class Discussion Presentation in Blue Green Lined Styl...
Ecosystem Interactions Class Discussion Presentation in Blue Green Lined Styl...Ecosystem Interactions Class Discussion Presentation in Blue Green Lined Styl...
Ecosystem Interactions Class Discussion Presentation in Blue Green Lined Styl...
 
Advance Mobile Application Development class 07
Advance Mobile Application Development class 07Advance Mobile Application Development class 07
Advance Mobile Application Development class 07
 
microwave assisted reaction. General introduction
microwave assisted reaction. General introductionmicrowave assisted reaction. General introduction
microwave assisted reaction. General introduction
 
The Most Excellent Way | 1 Corinthians 13
The Most Excellent Way | 1 Corinthians 13The Most Excellent Way | 1 Corinthians 13
The Most Excellent Way | 1 Corinthians 13
 
Disha NEET Physics Guide for classes 11 and 12.pdf
Disha NEET Physics Guide for classes 11 and 12.pdfDisha NEET Physics Guide for classes 11 and 12.pdf
Disha NEET Physics Guide for classes 11 and 12.pdf
 
Russian Escort Service in Delhi 11k Hotel Foreigner Russian Call Girls in Delhi
Russian Escort Service in Delhi 11k Hotel Foreigner Russian Call Girls in DelhiRussian Escort Service in Delhi 11k Hotel Foreigner Russian Call Girls in Delhi
Russian Escort Service in Delhi 11k Hotel Foreigner Russian Call Girls in Delhi
 
Call Girls in Dwarka Mor Delhi Contact Us 9654467111
Call Girls in Dwarka Mor Delhi Contact Us 9654467111Call Girls in Dwarka Mor Delhi Contact Us 9654467111
Call Girls in Dwarka Mor Delhi Contact Us 9654467111
 

Ge273.u3.pp1

  • 2. 2 of 46© 2012 Pearson Education, Inc. Publishing as Prentice Hall Chapter Outline and Learning Objectives CHAPTER 3 3.1 The Demand Side of the Market 3.2 The Supply Side of the Market 3.3 Market Equilibrium: Putting Demand and Supply Together 3.4 The Effect of Demand and Supply Shifts on Equilibrium Where Prices Come From: The Interaction of Demand and Supply
  • 3. 3 of 46© 2012 Pearson Education, Inc. Publishing as Prentice Hall Demand for tablet computers •How many tablets do consumers want to buy? • Affected by price of the tablets • Affected by other factors, including prices of other goods Supply of tablet computers •How many tablets are producers willing to sell? • Affected by price of the tablets • Affected by other factors, including prices of other goods What determines the price of a tablet computer?
  • 4. 4 of 46© 2012 Pearson Education, Inc. Publishing as Prentice Hall Discuss the variables that influence demand. 3.1 LEARNING OBJECTIVE The Demand Side of the Market
  • 5. 5 of 46© 2012 Pearson Education, Inc. Publishing as Prentice Hall Demand Schedule: Table showing how many of a product will be purchased at various prices. Demand Curve: Graphical representation of demand schedule. Price on y-axis. Quantity demanded on x-axis. Figure 3.1 Demand
  • 6. 6 of 46© 2012 Pearson Education, Inc. Publishing as Prentice Hall Law of Demand: As price changes, quantity demanded changes in opposite direction, ceteris paribus. Implication: Demand curve slopes downward Ceteris Paribus: Latin phrase meaning “all else equal” Figure 3.1 Demand
  • 7. 7 of 46© 2012 Pearson Education, Inc. Publishing as Prentice Hall Figure 3.2A change in something other than price that affects demand causes the entire demand curve to shift. A shift to the right (D1 to D2) is an increase in demand. A shift to the left (D1 to D3) is a decrease in demand. Changes in demand
  • 8. 8 of 46© 2012 Pearson Education, Inc. Publishing as Prentice Hall Figure 3.2As the demand curve shifts, the quantity demanded is likely to change, even if the price doesn’t change. The quantity demanded changes at every possible price. P1 Q3 Q1 Q2 Changes in demand
  • 9. 9 of 46© 2012 Pearson Education, Inc. Publishing as Prentice Hall Income of consumers Increase in income increases demand if product is normal, decreases demand if product is inferior. Price of related goods Increase in price of related good increases demand if products are substitutes, decreases demand if products are complements Tastes and preferences Population and demographics Expected future prices What would cause a change in demand?
  • 10. 10 of 46© 2012 Pearson Education, Inc. Publishing as Prentice Hall Normal goods: Goods for which the demand increases as income rises, and decreases as income falls Examples: Clothing Restaurant meals Vacations Inferior goods: Goods for which the demand decreases as income rises, and increases as income falls Examples: Second-hand clothing Ramen noodles Are tablet computers normal or inferior goods? Probably normal Effect of increase in income, if good is normal Effect of increase in income, if good is inferior Changes in demand: consumer incomes
  • 11. 11 of 46© 2012 Pearson Education, Inc. Publishing as Prentice Hall Substitutes: Goods and services that can be used for the same purpose Examples: Big Mac and Whopper Ford F-150 and Dodge Ram Jeans and Khakis Complements: Goods and services that are consumed together Examples: Big Mac and McDonald’s fries Hot dogs and hot dog buns Left shoes and right shoes Effect on demand for Big Macs, if price of Whopper increases Effect on demand for Big Macs, if price of McDonald’s fries increases Changes in demand: Price of related goods
  • 12. 12 of 46© 2012 Pearson Education, Inc. Publishing as Prentice Hall If consumers’ tastes or preferences change, they may buy more or less of the product Example: If consumers become more concerned about eating healthily, they might decrease their demand for fast food Effect on demand for fast food, if consumers want to eat healthy Increases in the number of people buying something will increase the amount demanded Example: An increase in the elderly population increases the demand for medical care Effect on demand for medical care, as the population ages Changes in demand: Tastes and preferences Changes in demand: Population and demographics
  • 13. 13 of 46© 2012 Pearson Education, Inc. Publishing as Prentice Hall Consumers decide which products to buy and when to buy them. •Future products are substitutes for current products •An expected increase in the price tomorrow increases demand today. •An expected decrease in the price tomorrow decreases demand today. Example: If you found out the price of gasoline would go up tomorrow, you would increase your demand today. Effect on today’s gasoline demand, if price will rise tomorrow Changes in demand: Expected future prices
  • 14. 14 of 46© 2012 Pearson Education, Inc. Publishing as Prentice Hall Apple’s policy on speculation about future products Making the Connection Apple strongly discourages its employees from speculating about when a new model will appear. Why? Suppose a customer learns that a new iPad model will be available next month. •The new model is a potential substitute for the current model •The price of the current model will likely fall next month •Both effects decrease current demand (bad for Apple!)
  • 15. 15 of 46© 2012 Pearson Education, Inc. Publishing as Prentice Hall Figure 3.3 A change in the price of the product being examined causes a movement along the demand curve. This is a change in quantity demanded. Any other change affecting demand causes the entire demand curve to shift. This is a change in demand. Change in demand vs. change in quantity demanded
  • 16. 16 of 46© 2012 Pearson Education, Inc. Publishing as Prentice Hall Discuss the variables that influence supply. 3.2 LEARNING OBJECTIVE The Supply Side of the Market
  • 17. 17 of 46© 2012 Pearson Education, Inc. Publishing as Prentice Hall Figure 3.4Supply Schedule: Table showing how many of a product will be available for purchase at various prices. Supply Curve: Graphical representation of supply schedule. Price on y-axis. Quantity demanded on x-axis. Supply schedule and supply curve
  • 18. 18 of 46© 2012 Pearson Education, Inc. Publishing as Prentice Hall Figure 3.4 Law of Supply: As price changes, quantity supplied changes in the same direction, ceteris paribus. Implication: supply curve slopes upward Law of supply
  • 19. 19 of 46© 2012 Pearson Education, Inc. Publishing as Prentice Hall Figure 3.5 A change in something other than price that affects supply causes the entire supply curve to shift. A shift to the right (S1 to S3) is an increase in supply. A shift to the left (S1 to S2) is a decrease in supply. Changes in supply
  • 20. 20 of 46© 2012 Pearson Education, Inc. Publishing as Prentice Hall Figure 3.5 As the supply curve shifts, the quantity supplied is likely to change, even if the price doesn’t change. The quantity supplied changes at every possible price. P1 Q2 Q1 Q3 Changes in supply
  • 21. 21 of 46© 2012 Pearson Education, Inc. Publishing as Prentice Hall Price of inputs Technological change Prices of substitutes in production Number of firms in the market Expected future prices What would cause a change in supply?
  • 22. 22 of 46© 2012 Pearson Education, Inc. Publishing as Prentice Hall Inputs are things used in the production of a good or service. Examples of inputs for tablet computers: Computer processor Plastic housing Labor An increase in the price of an input decreases the profitability of selling the good, causing a decrease in supply. A decrease in the price of an input increases the profitability of selling the good, causing an increase in supply. Effect of an increase in the price of input goods Effect of a decrease in the price of input goods Changes in supply: Price of inputs
  • 23. 23 of 46© 2012 Pearson Education, Inc. Publishing as Prentice Hall A firm may experience a positive or negative change in its ability to produce output given a fixed amount of inputs. Examples: A new, more productive variety of wheat would increase the supply of wheat. Governmental restrictions on land use for agriculture might decrease the supply of wheat. Changes raise or lower firms’ costs, hence their supply of the good. Effect of a positive change in technology Effect of a negative change in technology Changes in supply: Technological change
  • 24. 24 of 46© 2012 Pearson Education, Inc. Publishing as Prentice Hall Many firms can produce and sell more than one product. Example: An Illinois farmer can plant corn or soybeans. If the price of soybeans rises, he will plant (supply) less corn. Effect on the supply of corn, of an increase in the price of soybeans Effect of a increase in the number of firms More firms in the market will result in more product available at a given price (greater supply). Fewer firms → supply decreases. Changes in supply: Prices of substitutes in production Changes in supply: Number of firms in the market
  • 25. 25 of 46© 2012 Pearson Education, Inc. Publishing as Prentice Hall If a firm anticipates the price of its product will be higher in the future, it might decrease its supply today in order to increase it in the future. What types of products could be “stored” like this? Non-perishable products Effect of an increase in future expected price of a good Changes in supply: Expected future prices
  • 26. 26 of 46© 2012 Pearson Education, Inc. Publishing as Prentice Hall Release timing of Collateral Damage Making the Connection The Schwartzenegger film Collateral Damage was originally scheduled to be released on October 5, 2001. The film contained plot elements about terrorist attacks. The production company (Warner Bros.) decided the movie would have higher demand (higher expected future prices) if it did not show immediately after 9/11, so it was delayed until February 2002.
  • 27. 27 of 46© 2012 Pearson Education, Inc. Publishing as Prentice Hall Figure 3.6 A change in the price of the product being examined causes a movement along the supply curve. This is a change in quantity supplied. Any other change affecting supply causes the entire supply curve to shift. This is a change in supply. Change in supply vs. change in quantity supplied
  • 28. 28 of 46© 2012 Pearson Education, Inc. Publishing as Prentice Hall Use a graph to illustrate market equilibrium. 3.3 LEARNING OBJECTIVE Market Equilibrium: Putting Demand and Supply Together
  • 29. 29 of 46© 2012 Pearson Education, Inc. Publishing as Prentice Hall Figure 3.8If the price of a tablet is $600, consumers want to buy 4 million per month, while producers want to sell 6 million. This gives a surplus of 2 million tablets. Prediction: sellers will compete amongst themselves, driving the price down. Surplus
  • 30. 30 of 46© 2012 Pearson Education, Inc. Publishing as Prentice Hall If the price of a tablet is $300, consumers want to buy 7 million per month, while producers want to sell 3 million. This gives a shortage of 4 million tablets. Prediction: sellers will realize they can increase the price and still sell as many tablets, so the price will rise. Shortage Figure 3.8
  • 31. 31 of 46© 2012 Pearson Education, Inc. Publishing as Prentice Hall At a price of $500, consumers want to buy 5 million tablets, and producers want to sell 5 million. There is no reason for the price to change. Equilibrium price: $500 Equilibrium quantity: 5 million per month Figure 3.7 Market equilibrium
  • 32. 32 of 46© 2012 Pearson Education, Inc. Publishing as Prentice Hall Price is determined by the interaction of buyers and sellers. Neither group can dictate price in a competitive market (i.e. one with many buyers and sellers). However changes in supply and/or demand will affect the price and quantity traded. Who determines price, buyers or sellers?
  • 33. 33 of 46© 2012 Pearson Education, Inc. Publishing as Prentice Hall Use demand and supply graphs to predict changes in prices and quantities. 3.4 LEARNING OBJECTIVE The Effect of Demand and Supply Shifts on Equilibrium
  • 34. 34 of 46© 2012 Pearson Education, Inc. Publishing as Prentice Hall Predictions about price and quantity in model require us to know supply and demand curves. Typically, we know price and quantity, but do not know the curves that generate them. The power of the supply and demand model is in its ability to predict directional changes in price and quantity traded. Usefulness of the supply and demand model
  • 35. 35 of 46© 2012 Pearson Education, Inc. Publishing as Prentice Hall Toshiba enters the tablet computer market, introducing the Thrive. More tablets are available at any given price – an increase in supply from S1 to S2. Equilibrium price falls from P1 to P2. Equilibrium quantity rises from Q1 to Q2. The effect of shifts in supply on equilibrium Figure 3.9
  • 36. 36 of 46© 2012 Pearson Education, Inc. Publishing as Prentice Hall Figure 3.9 The effect of shifts in supply on equilibrium By how much will price fall? By how much will quantity rise? We cannot say, without knowing more information. For now, we can only predict that price will fall and quantity traded will rise.
  • 37. 37 of 46© 2012 Pearson Education, Inc. Publishing as Prentice Hall Figure 3.10Consumer incomes increase. What happens to equilibrium in the tablet market? Tablets are normal goods, so as income rises, demand rises (D1 to D2). Equilibrium price rises (P1 to P2). Equilibrium quantity rises (Q1 to Q2). The effect of shifts in demand on equilibrium
  • 38. 38 of 46© 2012 Pearson Education, Inc. Publishing as Prentice Hall Table 3.3 Supply Curve Unchanged Supply Curve Shifts to the Right Supply Curve Shifts to the Left Demand Curve Unchanged Q unchanged P unchanged Q ↑ P ↓ Q ↓ P ↑ Demand Curve Shifts to the Right Q ↑ P ↑ Demand Curve Shifts to the Left Q ↓ P ↓ Effects of shifts in demand and supply
  • 39. 39 of 46© 2012 Pearson Education, Inc. Publishing as Prentice Hall The Falling Price of Blu-ray Players Making the Connection From 2006 to 2010, the price of Blu-ray players fell from almost $1000 to about $120, while the number of Blu-ray players traded increased dramatically. What best explains this change? A: Increase in demand B: Decrease in demand C: Increase in supply D: Decrease in supply Can you show this change on a supply-and-demand diagram?
  • 40. 40 of 46© 2012 Pearson Education, Inc. Publishing as Prentice Hall The Falling Price of Blu-ray Players Making the Connection Supply increased as additional firms started manufacturing Blu- ray players and input costs fell.
  • 41. 41 of 46© 2012 Pearson Education, Inc. Publishing as Prentice Hall Suppose supply and demand both increase. What does our model predict? S↑  ( P↓ and Q↑ ) D↑  ( P↑ and Q↑ ) So we can be sure equilibrium quantity will rise; but the effect on equilibrium price is not clear. Effect on price depends on how far each curve moves. In this graph, demand moves more than supply. Simultaneous shifts in supply and demand
  • 42. 42 of 46© 2012 Pearson Education, Inc. Publishing as Prentice Hall Suppose supply and demand both increase. What does our model predict? S↑  ( P↓ and Q↑ ) D↑  ( P↑ and Q↑ ) So we can be sure equilibrium quantity will rise; but the effect on equilibrium price is not clear. Effect on price depends on how far each curve moves. In this graph, supply moves more than demand. Simultaneous shifts in supply and demand
  • 43. 43 of 46© 2012 Pearson Education, Inc. Publishing as Prentice Hall Supply Curve Unchanged Supply Curve Shifts to the Right Supply Curve Shifts to the Left Demand Curve Unchanged Q unchanged P unchanged Q ↑ P ↓ Q ↓ P ↑ Demand Curve Shifts to the Right Q ↑ P ↑ Q ↑ P effect uncertain Q effect uncertain P ↑ Demand Curve Shifts to the Left Q ↓ P ↓ Q effect uncertain P ↓ Q ↓ P effect uncertain Effects of shifts in demand and supply
  • 44. 44 of 46© 2012 Pearson Education, Inc. Publishing as Prentice Hall Over time, it is common for both supply and demand to shift. The stronger of the two effects will determine the overall change in price and quantity. In the Blu-ray example, demand for Blu-ray players increased from 2006 to 2010. But the supply effect was stronger. How can we tell? Because we know the price fell; if the demand effect were stronger, the price would have risen. Supply and demand shifts over time
  • 45. 45 of 46© 2012 Pearson Education, Inc. Publishing as Prentice Hall Terminology: movement along the curve (caused by price change) vs. shifting the curve (caused by other changes). Not moving curves far enough to be able to illustrate a change. Exaggerating curve shifts is okay. Incompletely labeling diagrams. Use your arrows! Common misconceptions to avoid
  • 46. 46 of 46© 2012 Pearson Education, Inc. Publishing as Prentice Hall Shifting a curve, then shifting another curve due to the resulting price change. The price change does not cause a further shift in demand or supply. Being certain of both price and quantity changes when both demand and supply curves move. Only one of these effects will be certain. Common misconceptions to avoid

Editor's Notes

  1. Price on y-axis despite price “causing” quantity
  2. Extension: point out that some goods are normal in some income ranges, and inferior in others. Example: Honda Civic: as income rises, initially demand for Civics rises (Civics are normal); but when you become rich, you want to drive something more expensive (Civics are inferior).
  3. Try naming some products, and ask students to come up with complements and substitutes for the products. Then use one of those examples to illustrate effects.
  4. “Tastes and preferences” is the generic category here. If it doesn’t fit elsewhere, it fits here. A “close-to-home” example: what happens to the demand on campus as students return in the fall?
  5. Strictly, these are “changes in expected future prices”; if you already knew the price of gasoline would go up tomorrow, it wouldn’t “change” your demand today – your demand would already incorporate this knowledge. Relate this to stock prices: if a firm reports unexpectedly high earnings, that raises its stock price due to the increased demand for the stock. But if a firm reports earnings as expected, the stock price doesn’t change.
  6. Reference: http://www.macworld.co.uk/apple-business/news/?newsid=3322764
  7. Students often initially think that increases in prices of inputs automatically raise the price of the output. To explain why firms can’t just unilaterally raise their price, explain that if the firm could have raised its price and not lost customers before the input increased in price, it would have.
  8. Emphasize that “technology” to an economist means “method of transforming inputs into outputs”, meaning that positive or negative changes can occur.
  9. Corn becomes less profitable relative to soybeans. A common misconception here is that the students think the price of soybeans must have risen because they got more expensive to produce. Emphasize that we don’t know (aren’t told) why the price of soybeans rose – perhaps it was just an increase in demand.
  10. Might be better to think about what types of products could not be stored. Services in general are hard to “store”: a lawyer can’t store up 500 hours to use in the same week.
  11. This mechanism is not emphasized in the textbook.
  12. May want to mention assumptions of a perfectly competitive market here: many buyers and sellers, identical product, etc.
  13. You can talk about the difference between the theoretical formulation of the model, and the practical use of the model, and how this is a typical paradigm in both social and physical sciences.
  14. Emphasize the logical steps of this diagram. You might want to have the students draw it along with you, adding on each element in turn. Students are often concerned with how far to move the curves. Let them know that they should move the curve far enough to be able to illustrate the directions of change; “realistic” changes are not necessary.
  15. Emphasize that these are interesting questions that will be addressed later in the chapter on elasticity.You can note that many economists for firms and consulting companies earn great money answering questions like these.
  16. You might make the students do the graphs to fill in this table themselves. The previous slides give two of the answers, of course. Rest of table will be filled in later.
  17. Students may point out that there were also increases in demand, due to (1) network effects, and (2) Sony winning the “High-definition video format war” over Toshiba and its HD-DVD format. This can be incorporated by showing a second diagram with an increase in demand but a “larger” increase in supply. This can lead in to the next slides on simultaneous changes in supply and demand.
  18. Emphasize that when both curves change, the effect on one of price and quantity is certain, and the effect on the other is uncertain or ambiguous, if you prefer that terminology. A common mistake is for students to believe the increase and decrease “cancel out”. Try to discourage this idea.