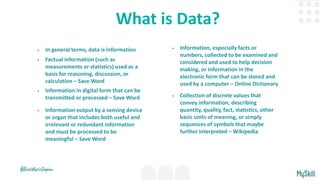
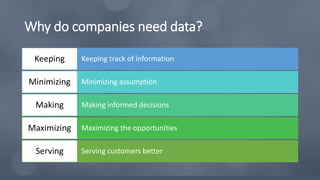
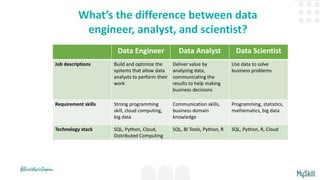
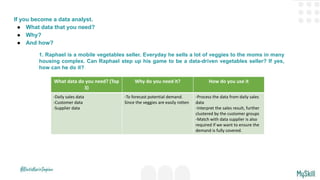
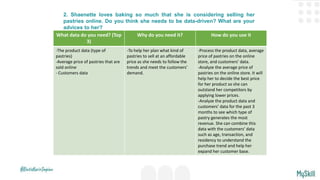
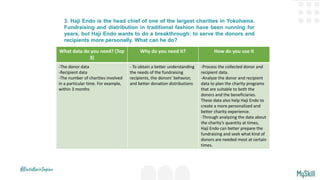
First Session - Kickstart Career as Data Analyst presents the definition of data, 5 parameters of big data, why many companies today need data, and different data-related jobs including data engineer, data analyst, and data scientist.
Utiliser les flux RSS pour sa veille : Pourquoi et comment ?URFIST de Paris
Les flux RSS sont-ils toujours d'actualité après la fermeture en 2013 de Google Reader, "leader" dans le domaine et quelles sont les alternatives gratuites ou peu onéreuses qui s'offrent à tous ceux qui souhaitent mettre en place une veille sur une ou plusieurs thématiques ? Ce support de formation se propose d'apporter quelques pistes en présentant un agrégateur de flux aux fonctionnalités riches et sans cesse en train d'évoluer : Inoreader.
Atelier d'initiation à Arduino, donné au Faclab de Gennevilliers dans le cadre du DU facilitateur 2019. Pour rendre cela plus... fun, nous avons choisi de l'orienter sur un usage musical.
Sistem informasi kasir menggunakan aplikasi Netbeans 7.2 dan Xampp 1.5.3. Laporan ini membahas pembuatan sistem informasi kasir untuk mempermudah transaksi penjualan dan pengecekan data transaksi. Sistem ini menggunakan Netbeans sebagai IDE dan Xampp sebagai server databasenya.
Sistem informasi penggajian ini membahas pengolahan data pegawai terkait proses penggajian seperti data pegawai, golongan, jabatan, gaji pokok, tunjangan, dan laporan gaji. Sistem ini dirancang untuk memasukkan, mengubah, dan menghapus data serta menghitung dan membuat laporan gaji pegawai.
Use of Data Mining in Marketing
Different tools for Marketing
Case Study
Data mining in marketing
Knowledge Base Marketing
Market Basket
Social Media Marketing
and many more
Effective Business Practices 101 (5/8): Power Your Business With InformationDmitri Tcherbadji
This deck is a part of an eight-day introductory course that I originally designed for the residents of Inle Lake (Nyang Shwe), Myanmar during my volunteer work with Partnership for Change org. This is a basic introductory course for those who wish to start a businesses but aren't sure where to begin or what would be an effective way to run and operate a company geared for Western customers.
This deck is free for anyone to modify and use, but please keep in mind that I do not own copyrights for most of the images on those slides (with some exceptions).
1. The document outlines strategies for making data actionable, including developing a big data strategy, setting milestones, identifying relevant data sources, and using data to create organizational efficiencies.
2. It emphasizes focusing marketing and data use on engagement, lead generation, and utilization metrics. Data should be used to move from broad approaches like blast marketing to more targeted segmented marketing.
3. Key steps include gathering, organizing, and identifying relevant data, then using data to track activities and outcomes, store results for future use, and continuously tweak marketing based on lessons learned.
Achieving Marketing Excellence Through Data Analyticssherynevillazon
The document discusses data analytics and its importance for marketing. It defines data analytics as the process of analyzing raw data to gain insights. Descriptive, diagnostic, predictive, and prescriptive analytics are described. Common data types used in marketing like customer, financial, and operational data are also outlined. The benefits of data analytics for marketing include uncovering best channels/messaging, personalization, business reach/growth, and ROI analysis. Data analytics aids market segmentation, targeting, and performance tracking.
This document discusses big data analytics and its impact on e-commerce. It begins with background on how data analysis motivates human actions and helps businesses understand customer expectations. It then defines big data as the collection of traditional and digital data used to discover insights. The document outlines how e-commerce businesses can apply big data analytics to identify customer segments, make recommendations, optimize operations, and contact customers at the right time. It also discusses the impact of big data on increasing sales and margins. Finally, it covers methods used in data analysis, benefits of big data for e-commerce, challenges faced in the author's experience with e-commerce projects, and future challenges around privacy and costs.
The Portland Trail Blazers were facing slowing ticket sales revenues as the team struggled with relevance. Marketing research was conducted to identify actions to increase ticket sales. Surveys found issues with the purchase process and information technology revealed the fan base was older. Experiments showed lower prices near the "Find Tickets" button increased revenues. Actions taken included improving the website, reducing fees, and targeting demographics. These actions led to increased traffic, ticket sales, and new, younger buyers. Future marketing may include digital ads in Seattle, a strong market for individual games.
Accounting Information Systems 13Th Chapter 1Don Dooley
This document outlines the key learning objectives for a chapter on accounting information systems. The objectives cover distinguishing data from information, explaining how information is used to make decisions, identifying information flows within an accounting system, describing major business processes and the basic functions of an accounting information system. It also covers how an accounting system can add value and how the system relates to corporate strategy and a company's value chain.
Business Analytics in Fashion marketingTaanyaGupta1
Business analytics uses quantitative techniques to analyze market trends and provide insights for growth in competitive industries like fashion. Traditional fashion retail lacked data on pricing, trends and competitors. Analytics now helps identify global markets, analyze trends, understand audiences, improve cross-selling, and measure brand ambassador influence. Techniques like social media analysis, markdown optimization, and market basket analysis provide data-backed decisions for designers, retailers and executives to sustain in competition.
Rplus offers analytics solution for retail industry through cloud based DemandSense application and big data analytics platform. Retail companies can leverage data to improving the profitability and efficiency of operations at a low cost in a faster timeframe.
I volunteered my time to share about big data to those looking to understand the space.
This was for Networking with Grace, a group that is focused on helping those get back to work. I put this presentation together to help people learn about big data and how to transition their skill sets to the space.
This document provides an overview of HR analytics and business analytics. It defines HR analytics as using analytical processes and data to improve employee performance and retention. Business analytics involves collecting, analyzing, and modeling business data to gain insights. The document discusses the evolution of business analytics from operations research during WWII to modern tools like Google Analytics. It also covers the scope, advantages, and challenges of business analytics, as well as its applications in different business domains like finance, e-commerce, and aviation.
This document discusses how small businesses can benefit from analyzing big data. It defines big data as large volumes of data from various sources that are created quickly. While big data was once only for large companies, small businesses already have customer data from their website, social media, emails, and CRM that can be analyzed. The document provides examples of how small businesses can use big data for social listening, customer service, and trends/forecasting. It then offers advice on getting started with big data solutions, including using CRM software and analytics tools, and introduces Tabor Consulting as a provider that can help small businesses with big data needs.
Age Friendly Economy - Improving your business with dataAgeFriendlyEconomy
The objective of this module is to gain an overview how you can use the data you already have available to improve your business.
Upon completion of this module you will:
- Learn the tips of how take advantage of the existing data you already have
- Be able to locate where internal data already lies within your company
- See how data can help you to build your brand
Visuals present better and quicker insights when forecasting sales. At a glance business strategies can be planned - time periods, geographic locations, pick variables that can highlight what works or doesn't, where it scores or doesn't, join two or more variables that work in specific geographical locations or don't, etc. All this put together makes data virtualization a very nifty tool to project what can make or break your predictions for sales!
Marketing analytics is the study of consumer data to evaluate marketing performance and optimize campaigns. It involves collecting, cleaning, and analyzing consumer data using statistical techniques to understand consumer behavior, refine marketing strategies, and predict future trends. Marketing analytics helps target consumers based on their interests and serve them the right messages at the right time through the right channels. It evaluates past marketing performance, reports on previous campaigns, and predicts future trends to improve marketing plans.
Lesson 6 value & importance of informationOneil Powers
This document discusses the importance and value of information. It notes that information is a valuable resource for organizations, just like capital and people. It is essential for organizations to collect and analyze information on things like market trends, customer preferences, and buying behaviors in order to make strategic decisions. For information to be useful, it needs to be accurate, complete, and up-to-date. Maintaining high quality information involves costs and overhead related to collection, storage, processing, and updating the data.
Hadoop is an open-source software framework used for storing and processing large datasets in a distributed manner across commodity hardware. It was created in 2005 by Doug Cutting and Mike Cafarella to address the issue of processing big data at a reasonable cost and time. Hadoop uses HDFS for storage and MapReduce for processing data distributed over a network of nodes in parallel. It allows organizations to gain insights from vast amounts of structured and unstructured data faster and at lower costs than traditional approaches.
The document discusses marketing research and the marketing research process. It describes 5 marketing problems that research could help address, such as a restaurant wanting to understand student dining habits and a company assessing advertising effectiveness. The 6 steps of the marketing research process are outlined as defining problems/objectives, developing a research plan, collecting information, analyzing the information, presenting findings, and making decisions. Various sources of marketing data are also examined, including internal records, secondary data, publicly and privately generated data, and methods for collecting primary data both online and in real-space.
Module 2 - Improving current business with your own data - Online caniceconsulting
The document discusses how companies can improve their current business using their own internal data. It provides tips on locating internal data sources within a company, implementing data enrichment, and using data to build a company's brand. The key internal data sources discussed include transactional data, customer relationship management systems, internal documents/archives, and data from other business applications and device sensors. Data enrichment is presented as an important part of big data projects, to integrate and extract more value from existing data.
This dashboard aims to evaluate the monthly sales achievement per month for mobiles and tablets, computing, and appliances in a superstore. The tool that is used in this project is Looker Studio.
This project focused on creating data frames, filtering data, grouping data, merging, and displaying data. Furthermore, it also includes creating new columns in which specific conditions can be applied. The data is used to solve business problems within a superstore.
The first problem statement is determining the prizes taken from the Top 5 products from the Mobiles & Tablet Category. Second, the data is processed to fulfill the requirement to check whether there is a decrease in the sales of the Others Category in 2022. The task also requires the display of the top 20 products that have the highest decrease. Third, I utilize the data to process the Customer ID and Registered Data of the consumers who have checked out but have not yet made payment. Fourth, the data is sorted and analyzed to compare the average daily sales on the weekends and those on the weekdays in the time range of 3 months.
More Related Content
Similar to Kickstart Career as Data Analyst - Elyada Wigati Pramaresti.pptx
1. The document outlines strategies for making data actionable, including developing a big data strategy, setting milestones, identifying relevant data sources, and using data to create organizational efficiencies.
2. It emphasizes focusing marketing and data use on engagement, lead generation, and utilization metrics. Data should be used to move from broad approaches like blast marketing to more targeted segmented marketing.
3. Key steps include gathering, organizing, and identifying relevant data, then using data to track activities and outcomes, store results for future use, and continuously tweak marketing based on lessons learned.
Achieving Marketing Excellence Through Data Analyticssherynevillazon
The document discusses data analytics and its importance for marketing. It defines data analytics as the process of analyzing raw data to gain insights. Descriptive, diagnostic, predictive, and prescriptive analytics are described. Common data types used in marketing like customer, financial, and operational data are also outlined. The benefits of data analytics for marketing include uncovering best channels/messaging, personalization, business reach/growth, and ROI analysis. Data analytics aids market segmentation, targeting, and performance tracking.
This document discusses big data analytics and its impact on e-commerce. It begins with background on how data analysis motivates human actions and helps businesses understand customer expectations. It then defines big data as the collection of traditional and digital data used to discover insights. The document outlines how e-commerce businesses can apply big data analytics to identify customer segments, make recommendations, optimize operations, and contact customers at the right time. It also discusses the impact of big data on increasing sales and margins. Finally, it covers methods used in data analysis, benefits of big data for e-commerce, challenges faced in the author's experience with e-commerce projects, and future challenges around privacy and costs.
The Portland Trail Blazers were facing slowing ticket sales revenues as the team struggled with relevance. Marketing research was conducted to identify actions to increase ticket sales. Surveys found issues with the purchase process and information technology revealed the fan base was older. Experiments showed lower prices near the "Find Tickets" button increased revenues. Actions taken included improving the website, reducing fees, and targeting demographics. These actions led to increased traffic, ticket sales, and new, younger buyers. Future marketing may include digital ads in Seattle, a strong market for individual games.
Accounting Information Systems 13Th Chapter 1Don Dooley
This document outlines the key learning objectives for a chapter on accounting information systems. The objectives cover distinguishing data from information, explaining how information is used to make decisions, identifying information flows within an accounting system, describing major business processes and the basic functions of an accounting information system. It also covers how an accounting system can add value and how the system relates to corporate strategy and a company's value chain.
Business Analytics in Fashion marketingTaanyaGupta1
Business analytics uses quantitative techniques to analyze market trends and provide insights for growth in competitive industries like fashion. Traditional fashion retail lacked data on pricing, trends and competitors. Analytics now helps identify global markets, analyze trends, understand audiences, improve cross-selling, and measure brand ambassador influence. Techniques like social media analysis, markdown optimization, and market basket analysis provide data-backed decisions for designers, retailers and executives to sustain in competition.
Rplus offers analytics solution for retail industry through cloud based DemandSense application and big data analytics platform. Retail companies can leverage data to improving the profitability and efficiency of operations at a low cost in a faster timeframe.
I volunteered my time to share about big data to those looking to understand the space.
This was for Networking with Grace, a group that is focused on helping those get back to work. I put this presentation together to help people learn about big data and how to transition their skill sets to the space.
This document provides an overview of HR analytics and business analytics. It defines HR analytics as using analytical processes and data to improve employee performance and retention. Business analytics involves collecting, analyzing, and modeling business data to gain insights. The document discusses the evolution of business analytics from operations research during WWII to modern tools like Google Analytics. It also covers the scope, advantages, and challenges of business analytics, as well as its applications in different business domains like finance, e-commerce, and aviation.
This document discusses how small businesses can benefit from analyzing big data. It defines big data as large volumes of data from various sources that are created quickly. While big data was once only for large companies, small businesses already have customer data from their website, social media, emails, and CRM that can be analyzed. The document provides examples of how small businesses can use big data for social listening, customer service, and trends/forecasting. It then offers advice on getting started with big data solutions, including using CRM software and analytics tools, and introduces Tabor Consulting as a provider that can help small businesses with big data needs.
Age Friendly Economy - Improving your business with dataAgeFriendlyEconomy
The objective of this module is to gain an overview how you can use the data you already have available to improve your business.
Upon completion of this module you will:
- Learn the tips of how take advantage of the existing data you already have
- Be able to locate where internal data already lies within your company
- See how data can help you to build your brand
Visuals present better and quicker insights when forecasting sales. At a glance business strategies can be planned - time periods, geographic locations, pick variables that can highlight what works or doesn't, where it scores or doesn't, join two or more variables that work in specific geographical locations or don't, etc. All this put together makes data virtualization a very nifty tool to project what can make or break your predictions for sales!
Marketing analytics is the study of consumer data to evaluate marketing performance and optimize campaigns. It involves collecting, cleaning, and analyzing consumer data using statistical techniques to understand consumer behavior, refine marketing strategies, and predict future trends. Marketing analytics helps target consumers based on their interests and serve them the right messages at the right time through the right channels. It evaluates past marketing performance, reports on previous campaigns, and predicts future trends to improve marketing plans.
Lesson 6 value & importance of informationOneil Powers
This document discusses the importance and value of information. It notes that information is a valuable resource for organizations, just like capital and people. It is essential for organizations to collect and analyze information on things like market trends, customer preferences, and buying behaviors in order to make strategic decisions. For information to be useful, it needs to be accurate, complete, and up-to-date. Maintaining high quality information involves costs and overhead related to collection, storage, processing, and updating the data.
Hadoop is an open-source software framework used for storing and processing large datasets in a distributed manner across commodity hardware. It was created in 2005 by Doug Cutting and Mike Cafarella to address the issue of processing big data at a reasonable cost and time. Hadoop uses HDFS for storage and MapReduce for processing data distributed over a network of nodes in parallel. It allows organizations to gain insights from vast amounts of structured and unstructured data faster and at lower costs than traditional approaches.
The document discusses marketing research and the marketing research process. It describes 5 marketing problems that research could help address, such as a restaurant wanting to understand student dining habits and a company assessing advertising effectiveness. The 6 steps of the marketing research process are outlined as defining problems/objectives, developing a research plan, collecting information, analyzing the information, presenting findings, and making decisions. Various sources of marketing data are also examined, including internal records, secondary data, publicly and privately generated data, and methods for collecting primary data both online and in real-space.
Module 2 - Improving current business with your own data - Online caniceconsulting
The document discusses how companies can improve their current business using their own internal data. It provides tips on locating internal data sources within a company, implementing data enrichment, and using data to build a company's brand. The key internal data sources discussed include transactional data, customer relationship management systems, internal documents/archives, and data from other business applications and device sensors. Data enrichment is presented as an important part of big data projects, to integrate and extract more value from existing data.
Similar to Kickstart Career as Data Analyst - Elyada Wigati Pramaresti.pptx (20)
This dashboard aims to evaluate the monthly sales achievement per month for mobiles and tablets, computing, and appliances in a superstore. The tool that is used in this project is Looker Studio.
This project focused on creating data frames, filtering data, grouping data, merging, and displaying data. Furthermore, it also includes creating new columns in which specific conditions can be applied. The data is used to solve business problems within a superstore.
The first problem statement is determining the prizes taken from the Top 5 products from the Mobiles & Tablet Category. Second, the data is processed to fulfill the requirement to check whether there is a decrease in the sales of the Others Category in 2022. The task also requires the display of the top 20 products that have the highest decrease. Third, I utilize the data to process the Customer ID and Registered Data of the consumers who have checked out but have not yet made payment. Fourth, the data is sorted and analyzed to compare the average daily sales on the weekends and those on the weekdays in the time range of 3 months.
This final project presents my analysis of sales and methods of payment for electronics, fashions, entertainment, and other products offered by a superstore. I used many SQL commands including Create Table, Select, From, Where, Group By, Order By, Limit, Left Join, and Extract.
This task presents SQL basic commands which I used to create a new table with its data. I queried the sales data of furniture, office supplies, and technology.
Through my task, I learned about how to work with the Google Sheet. This task covers data extraction, number formatting, conditional formatting, how to remove duplicate data, and data validation. The data presents the sales and consumer segment of office supplies, furniture, and technology in the United States.
This work explains the Basic Statistics for Data Analysis which includes the type of data, measure of centric (mean, median, etc.), measure of distribution (variance, deviation standard), quartile, percentile, and outliers. In this task, I used statistics to analyze voucher redeems, the service-level agreements, and compare payment with living costs.
Improvement as Data Analyst presents business problems, different problem-solving tools (5 Why, Action Priority Chart, Fishbone, and Flow Mapping), and data analysis process.
Hello everyone! This is my Excel Portfolio which covers all of my tasks during my intensive bootcamp. Through this bootcamp, I learned about Basic Formula and Functions, Data Cleaning, Data Validation, Conditional Formatting, Data Visualization, VLookup and Match, Pivot, Dashboard Reporting, and Macro VBA. This portfolio presents my analysis of sales, revenue, profit, and popular marketplace of office supplies and furniture. Hopefully, this will help me to open my career path.
06-04-2024 - NYC Tech Week - Discussion on Vector Databases, Unstructured Data and AI
Discussion on Vector Databases, Unstructured Data and AI
https://www.meetup.com/unstructured-data-meetup-new-york/
This meetup is for people working in unstructured data. Speakers will come present about related topics such as vector databases, LLMs, and managing data at scale. The intended audience of this group includes roles like machine learning engineers, data scientists, data engineers, software engineers, and PMs.This meetup was formerly Milvus Meetup, and is sponsored by Zilliz maintainers of Milvus.
ViewShift: Hassle-free Dynamic Policy Enforcement for Every Data LakeWalaa Eldin Moustafa
Dynamic policy enforcement is becoming an increasingly important topic in today’s world where data privacy and compliance is a top priority for companies, individuals, and regulators alike. In these slides, we discuss how LinkedIn implements a powerful dynamic policy enforcement engine, called ViewShift, and integrates it within its data lake. We show the query engine architecture and how catalog implementations can automatically route table resolutions to compliance-enforcing SQL views. Such views have a set of very interesting properties: (1) They are auto-generated from declarative data annotations. (2) They respect user-level consent and preferences (3) They are context-aware, encoding a different set of transformations for different use cases (4) They are portable; while the SQL logic is only implemented in one SQL dialect, it is accessible in all engines.
#SQL #Views #Privacy #Compliance #DataLake
STATATHON: Unleashing the Power of Statistics in a 48-Hour Knowledge Extravag...sameer shah
"Join us for STATATHON, a dynamic 2-day event dedicated to exploring statistical knowledge and its real-world applications. From theory to practice, participants engage in intensive learning sessions, workshops, and challenges, fostering a deeper understanding of statistical methodologies and their significance in various fields."
State of Artificial intelligence Report 2023kuntobimo2016
Artificial intelligence (AI) is a multidisciplinary field of science and engineering whose goal is to create intelligent machines.
We believe that AI will be a force multiplier on technological progress in our increasingly digital, data-driven world. This is because everything around us today, ranging from culture to consumer products, is a product of intelligence.
The State of AI Report is now in its sixth year. Consider this report as a compilation of the most interesting things we’ve seen with a goal of triggering an informed conversation about the state of AI and its implication for the future.
We consider the following key dimensions in our report:
Research: Technology breakthroughs and their capabilities.
Industry: Areas of commercial application for AI and its business impact.
Politics: Regulation of AI, its economic implications and the evolving geopolitics of AI.
Safety: Identifying and mitigating catastrophic risks that highly-capable future AI systems could pose to us.
Predictions: What we believe will happen in the next 12 months and a 2022 performance review to keep us honest.
Enhanced Enterprise Intelligence with your personal AI Data Copilot.pdfGetInData
Recently we have observed the rise of open-source Large Language Models (LLMs) that are community-driven or developed by the AI market leaders, such as Meta (Llama3), Databricks (DBRX) and Snowflake (Arctic). On the other hand, there is a growth in interest in specialized, carefully fine-tuned yet relatively small models that can efficiently assist programmers in day-to-day tasks. Finally, Retrieval-Augmented Generation (RAG) architectures have gained a lot of traction as the preferred approach for LLMs context and prompt augmentation for building conversational SQL data copilots, code copilots and chatbots.
In this presentation, we will show how we built upon these three concepts a robust Data Copilot that can help to democratize access to company data assets and boost performance of everyone working with data platforms.
Why do we need yet another (open-source ) Copilot?
How can we build one?
Architecture and evaluation
The Ipsos - AI - Monitor 2024 Report.pdfSocial Samosa
According to Ipsos AI Monitor's 2024 report, 65% Indians said that products and services using AI have profoundly changed their daily life in the past 3-5 years.
4th Modern Marketing Reckoner by MMA Global India & Group M: 60+ experts on W...Social Samosa
The Modern Marketing Reckoner (MMR) is a comprehensive resource packed with POVs from 60+ industry leaders on how AI is transforming the 4 key pillars of marketing – product, place, price and promotions.
4th Modern Marketing Reckoner by MMA Global India & Group M: 60+ experts on W...
Kickstart Career as Data Analyst - Elyada Wigati Pramaresti.pptx
1.
2.
3. What is Data?
• In general terms, data is information
• Factual information (such as
measurements or statistics) used as a
basis for reasoning, discussion, or
calculation – Save Word
• Information in digital form that can be
transmitted or processed – Save Word
• Information output by a sensing device
or organ that includes both useful and
irrelevant or redundant information
and must be processed to be
meaningful – Save Word
• Information, especially facts or
numbers, collected to be examined and
considered and used to help decision
making, or information in the
electronic form that can be stored and
used by a computer – Online Dictionary
• Collection of discrete values that
convey information, describing
quantity, quality, fact, statistics, other
basic units of meaning, or simply
sequences of symbols that maybe
further interpreted – Wikipedia
5. Why do companies need data?
Keeping track of information
Keeping
Minimizing assumption
Minimizing
Making informed decisions
Making
Maximizing the opportunities
Maximizing
Serving customers better
Serving
6. How Big Companies Use
Data?
• Google autocompletes and predicts what you type just in milliseconds
• Spotify random shuffle plays songs with similar theme
• Netflix use personalized trailer to hook viewers to watch genres that
they are usually not like to watch
• Amazon has a dynamic pricing feature to set the price automatically
based on user behavior, past purchases, trends, etc
• Instagram: when people talk with each other, ads will pop up just like
what those people talking about
7. What’s the difference between data
engineer, analyst, and scientist?
Data Engineer Data Analyst Data Scientist
Job descriptions Build and optimize the
systems that allow data
analysts to perform their
work
Deliver value by
analyzing data,
communicating the
results to help making
business decisions
Use data to solve
business problems
Requirement skills Strong programming
skill, cloud computing,
big data
Communication skills,
business domain
knowledge
Programming, statistics,
mathematics, big data
Technology stack SQL, Python, Cloud,
Distributed Computing
SQL, BI Tools, Python, R SQL, Python, R, Cloud
8.
9. If you become a data analyst.
● What data that you need?
● Why?
● And how?
1. Raphael is a mobile vegetables seller. Everyday he sells a lot of veggies to the moms in many
housing complex. Can Raphael step up his game to be a data-driven vegetables seller? If yes,
how can he do it?
What data do you need? (Top
3)
Why do you need it? How do you use it
-Daily sales data
-Customer data
-Supplier data
-To forecast potential demand.
Since the veggies are easily rotten
-Process the data from daily sales
data
-Interpret the sales result, further
clustered by the customer groups
-Match with data supplier is also
required if we want to ensure the
demand is fully covered.
10. 2. Shaenette loves baking so much that she is considering selling her
pastries online. Do you think she needs to be data-driven? What are your
advices to her?
What data do you need? (Top
3)
Why do you need it? How do you use it
-The product data (type of
pastries)
-Average price of pastries that are
sold online
- Customers data
-To help her plan what kind of
pastries to sell at an affordable
price as she needs to follow the
trends and meet the customers’
demand.
-Process the product data, average
price of pastries on the online
store, and customers’ data.
-Analyze the average price of
pastries on the online store. It will
help her to decide the best price
for her product so she can
outstand her competitors by
applying lower prices.
-Analyze the product data and
customers’ data for the past 3
months to see which type of
pastry generates the most
revenue. She can combine this
data with the customers’ data
such as age, transaction, and
residency to understand the
purchase trend and help her
expand her customer base.
11. 3. Haji Endo is the head chief of one of the largest charities in Yokohama.
Fundraising and distribution in traditional fashion have been running for
years, but Haji Endo wants to do a breakthrough: to serve the donors and
recipients more personally. What can he do?
What data do you need? (Top
3)
Why do you need it? How do you use it
-The donor data
-Recipient data
-The number of charities involved
in a particular time. For example,
within 3 months
- To obtain a better understanding
the needs of the fundraising
recipients, the donors’ behavior,
and better donation distributions
-Process the collected donor and
recipient data.
-Analyze the donor and recipient
data to plan the charity programs
that are suitable to both the
donors and the beneficiaries.
These data also help Haji Endo to
create a more personalized and
better charity experience.
-Through analyzing the data about
the charity’s quantity at times,
Haji Endo can better prepare the
fundraising and seek what kind of
donors are needed most at certain
times.
12. Follow me!
Instagram : elyadawigatip
Twitter : @EliNoBishamon
LinkedIn : https://www.linkedin.com/in/elyada-wigati-
pramaresti-1a2387170/
Bootcamp Data Analysis
by @myskill.id