Downloaded 79 times

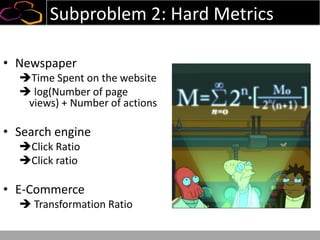
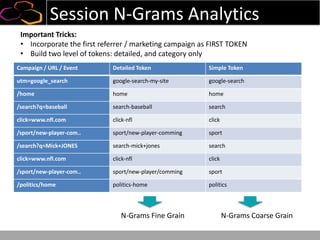
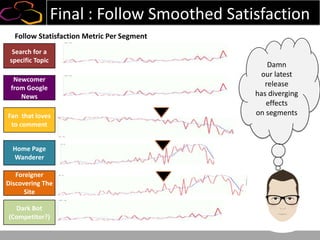
![N-Grams Model For Sessions
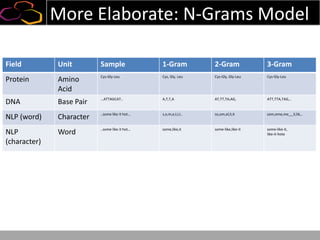
Field Unit Sample 1-Gram 2-Gram 3-Gram
Protein Amino
Acid
Cys-Gly-Leu Cys, Gly, Leu Cys-Gly, Gly-Leu Cys-Gly-Leu
DNA Base Pair …ATTAGCAT.. A,T,T,A AT,TT,TA,AG, ATT,TTA,TAG,..
NLP (word) Character ..some like it hot… s,o,m,e,l,i,t.. so,om,el,li,it som,ome,me_,_li,lik,..
NLP
(character)
Word ..some like it hot… some,like,it some-like,like-it some-like-it,
like-it-hote
Web Sessions Page View [/home , /products, /trynow,
/blog]
/home, /products, /trynow,
/blog
/home /products, /products
/trynow, /trynow /blog
/home-/products-/trynow,
/products-/trynow-/blog](https://image.slidesharecdn.com/dataiku-hadoopsummit-semi-supervisedlearningwithhadoopforunderstandinguserwebbehaviours-140404124119-phpapp02/85/Dataiku-hadoop-summit-semi-supervised-learning-with-hadoop-for-understanding-user-web-behaviours-26-320.jpg)
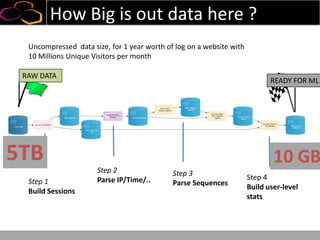
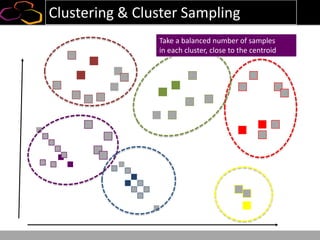
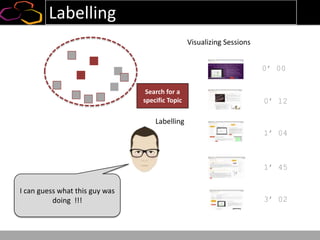
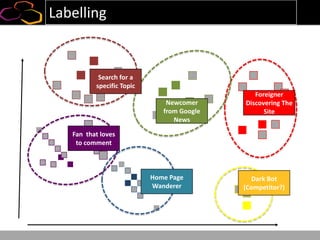
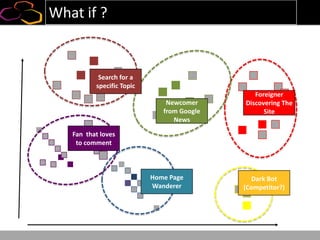
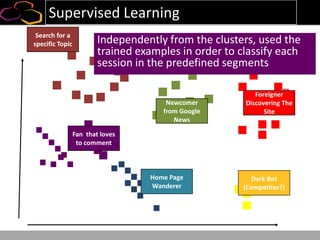
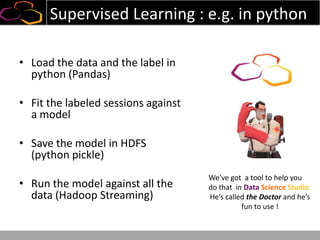
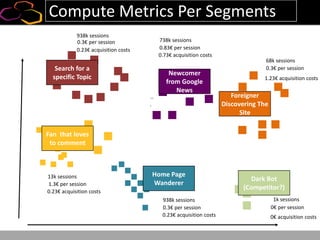
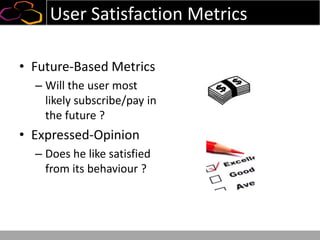
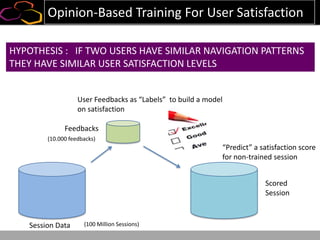
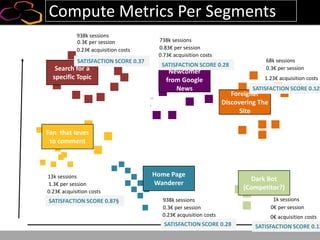
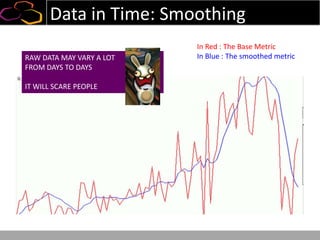
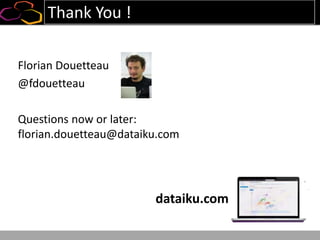

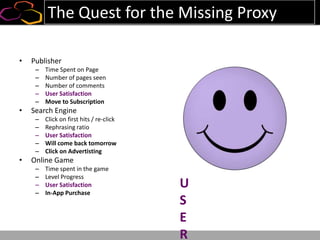
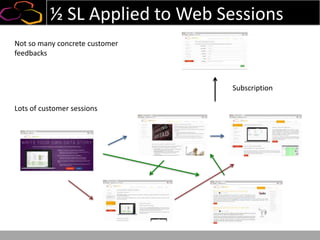
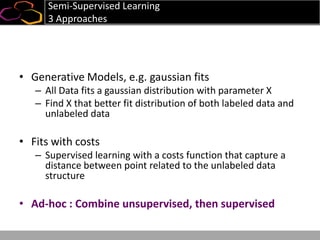
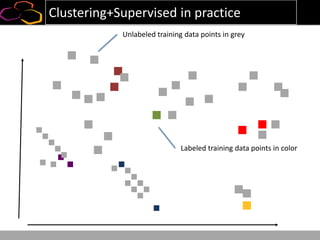
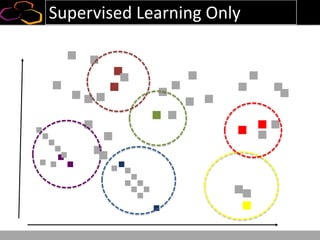
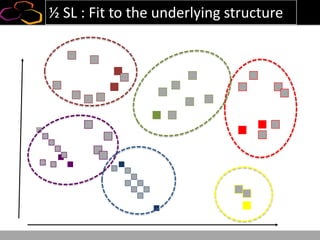
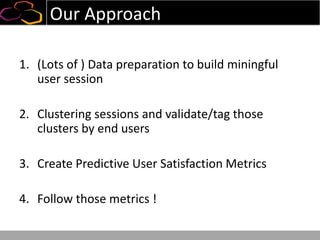
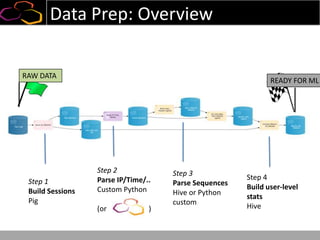
This document summarizes a presentation on using semi-supervised learning on Hadoop to understand user behaviors on large websites. It discusses clustering user sessions to identify different user segments, labeling the clusters, then using supervised learning to classify all sessions. Key metrics like satisfaction scores are then computed for each segment to identify opportunities to improve the user experience and business metrics. Smoothing is applied to metrics over time to avoid scaring people with daily fluctuations. The overall goal is to measure and drive user satisfaction across diverse users.