

Recommended
Recommended
More Related Content
What's hot
What's hot (20)
Viewers also liked
Viewers also liked (20)
Similar to 7UP annual report 2015
Similar to 7UP annual report 2015 (20)
More from Michael Olafusi
More from Michael Olafusi (20)
Recently uploaded
Recently uploaded (20)
7UP annual report 2015
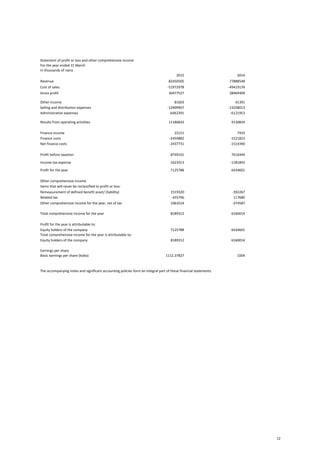
- 1. Statement of profit or loss and other comprehensive income For the year ended 31 March In thousands of naira 2015 2014 Revenue 82450505 77888548 Cost of sales -51972978 -49419139 Gross profit 30477527 28469409 Other income 81603 41391 Selling and distribution expenses -12909907 -13258013 Administrative expenses -6462391 -6121953 Results from operating activities 11186832 9130834 Finance income 22151 7433 Finance costs -2459882 -1521823 Net finance costs -2437731 -1514390 Profit before taxation 8749101 7616444 Income tax expense -1623313 -1181843 Profit for the year 7125788 6434601 Other comprehensive income Items that will never be reclassified to profit or loss: Remeasurement of defined benefit asset/ (liability) 1519320 -392267 Related tax -455796 117680 Other comprehensive income for the year, net of tax 1063524 -274587 Total comprehensive income for the year 8189312 6160014 Profit for the year is attributable to: Equity holders of the company 7125788 6434601 Total comprehensive income for the year is attributable to: Equity holders of the company 8189312 6160014 Earnings per share Basic earnings per share (kobo) 1112.37827 1004 The accompanying notes and significant accounting policies form an integral part of these financial statements. 12
- 2. Statement of financial position As at 31 March In thousands of naira 2015 2014 Assets Property, plant and equipment 44440675 37893504 Intangible assets 27698 47961 Prepayment 58535 169617 Other receivables 175663 126983 Total non-current assets 44702571 38238065 Inventories 9568469 9460369 Trade and other receivables 4421832 2839697 Prepayments 471195 406162 Cash and cash equivalents 8522772 4918916 Total current assets 22984268 17625144 Total assets 67686839 55863209 Equity Share capital 320295 320295 Share premium 299140 299140 Retained earnings 23314198 16709260 Total Equity 23933633 17328695 Liabilities Loans and borrowings 4433469 1433469 Employee benefits 3669295 4760323 Deferred tax liabilities 3226789 2472898 Total non- current liabilities 11329553 8666690 Bank overdraft 4619707 1337887 Current tax liabilities 1339805 1500579 Loans and borrowings 11032831 13033337 Trade and other payables 15431310 13996021 Total current liabilities 32423653 29867824 Total liabilities 43753206 38534514 Total equity and liabilities 67686839 55863209 FAYSAL EL-KHALIL SUNIL SAWHNEY ALI JAFARI These financial statements were approved by the Board of Directors on 23 June 2015 and signed on its behalf by the directors listed below: The accompanying notes and significant accounting policies form an integral part of these financial statements. 13
- 3. Statement of cash flows For the year ended 31 March In thousands of naira 2015 2014 Cash flows from operating activities Profit for the year 7125788 6434601 Adjustments for: Depreciation 8520745 7923895 Amortization of intangible assets 28139 21821 Finance income -22151 -7433 Finance costs 1961624 1521823 Employee benefit charge 638052 1227242 (Gain)/loss on sale of property, plant and equipment -39927 69182 Assets written off 0 97215 Income tax expense 1623313 1181843 19835583 18470189 Change in inventories -480784 -730872 Change in trade and other receivables -1658284 422125 Change in prepayments 46049 64980 Change in trade and other payables (excluding dividend payable)* 3297326 3588480 Cash generated from operating activities 21039890 21814902 Value Added Tax (VAT) paid * -2210619 -1741706 Income tax paid -1485992 -650942 Employee benefit paid -209760 -196654 Net cash from operating activities 17133519 19225600 Cash flow from investing activities Finance income 22151 7433 Proceeds from sale of property, plant and equipment 83007 70772 Acquisition of property, plant and equipment -14461016 -10602899 Acquisition of Intangible assets -7876 -11380 Net cash used in investing activities -14363734 -10536074 Cash flow from financing activities Proceeds from loans and borrowings 8778758 9590231 Repayment of loans and borrowings -7954316 -14147559 Interest paid -1786572 -1483585 Dividends paid -1513088 -1333619 Net cash used in financing activities -2475218 -7374532 Net (decrease)/increase in cash and cash equivalents 294567 1314994.1 Cash and cash equivalents at the beginning of the year 3581029 2267265 Effect of exchange rate fluctuations on cash held 27469 -1230 Cash and cash equivalents at the end of the year 3903065 3581029 The accompanying notes and significant accounting policies form an integral part of these financial statements. *Change in trade and other payables have been adjusted for the effect of Value added tax (VAT) paid shown separately on the statement of cash flows. 14
- 4. Statement of changes in equity For the year ended 31 March In thousands of naira Share capital Share premium Retained earnings Total equity Balance , 1 April 2013 320295 299140 11958545 12577980 Total comprehensive income Profit for the year 0 0 6434601 6434601 Other Comprehensive income 0 0 -274587 -274587 Total comprehensive income 0 0 6160014 6160014 Transactions with owners of the Company Contribution and distribution Dividend to equity holders 0 0 -1409299 -1409299 Total transactions with owners of the Company 0 0 -1409299 -1409299 Balance, 31 March 2014 320295 299140 16709260 17328695 Balance , 1 April 2014 320295 299140 16709260 17328695 Profit for the year 0 0 7125788 7125788 Other comprehensive income 0 0 1063524 1063524 Total comprehensive income 0 0 8189312 8189312 Transactions with owners of the Company Contribution and distribution Dividend to equity holders 0 0 -1601476 -1601476 Unclaimed dividend written back 0 0 17102 17102 Unclaimed dividend written back Total transactions with owners of the Company 0 0 -1584374 -1584374 Balance, 31 March 2015 320295 299140 23314198 23933633 The accompanying notes and significant accounting policies form an integral part of these financial statements. 15