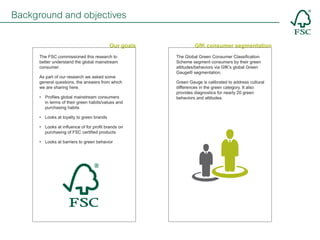
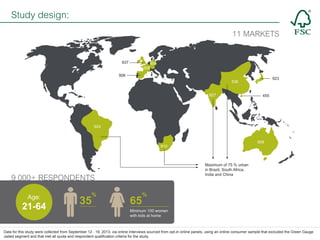
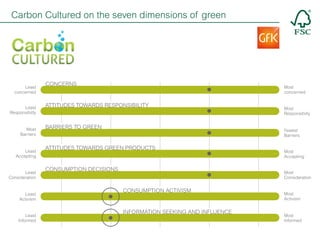
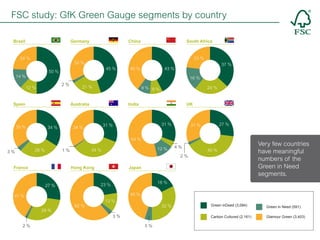
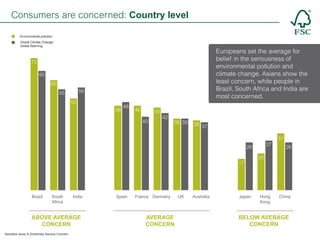
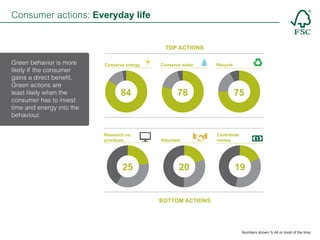
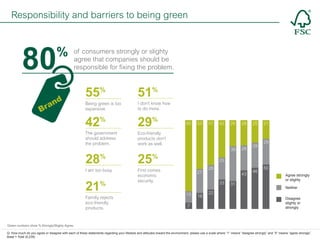
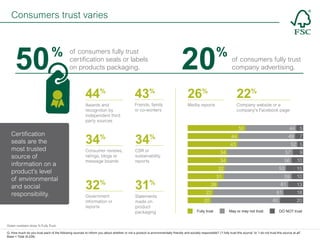
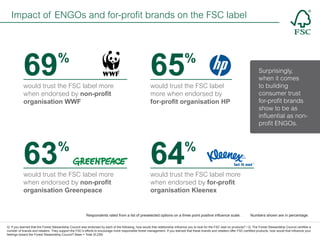
© Inger Kærgaard

A mainstream concern:
®

FSC Global Consumer Research Highlights
Background and objectives
Our goals
The FSC commissioned this research to
better understand the global mainstream
consumer.
As part of our research we asked some
general questions, the answers from which
we are sharing here.
•	 Profiles global mainstream consumers
in terms of their green habits/values and
purchasing habits
•	 Looks at loyalty to green brands
•	 Looks at influence of for profit brands on
purchasing of FSC certified products
•	 Looks at barriers to green behavior

GfK consumer segmentation
The Global Green Consumer Classification
Scheme segment consumers by their green
attitudes/behaviors via GfK’s global Green
Gauge® segmentation.
Green Gauge is calibrated to address cultural
differences in the green category. It also
provides diagnostics for nearly 20 green
behaviors and attitudes.
Study design:
11 MARKETS

937

904
908

906

923

536
927

455

924

909

910

Maximum of 75 % urban
in Brazil, South Africa,
India and China	

9 000+ RESPONDENTS
Age:

21-64

35

%

65

%

Minimum 100 women
with kids at home

Data for this study were collected from September 12 - 19, 2013, via online interviews sourced from opt-in online panels, using an online consumer sample that excluded the Green Gauge
Jaded segment and that met all quota and respondent qualification criteria for the study.
GfK Green Gauge

THE SEVEN DIMENSIONS OF GREEN
CONCERNS

1. Concerns/
Seriousness of
environmental
issues

ATTITUDES

2. Attitudes
towards
environmental
responsibility

The GfK Green Gauge Global
Segmentation algorithm was
used to clasify participants in
this research. This approach
profiles people broadly on multiple
dimensions of green attitudes and
behaviors.

3. Barriers
to green
living

BEHAVIORS

4. Attitudes
towards
green
products

5. Consumption
decisions

6. Activism

7. Information
seeking and
influence
Segment definitions: 5 green consumer segments

The greenest segment. This
group shows the highest
concern for the environment,
and they put their money
where their mouth is when it
comes to green behavior.

Many of these people are
located in markets where
green has long been on the
national agenda (mostly the
developed world). As a result
they show a high degree of
concern for the environment,
but some of their behaviors
lack.

A group that exists almost
exclusively in the developing
world. They have the desire,
but lack the means and
know-how to be more green.
Given the right tools, these
people could climb the
environmental ladder and
become Green inDeeds.

“Green” to this group
is a status symbol. The
environment is only skin deep
to them. They are less likely
to have core green values,
but they will participate if it
means they can display their
green badge of honor.

They do things that are
expected of them like
recycling and conserving
energy/water, but many of the
“harder” behaviours are still
at or below global norms.

A cynical an skeptical group. This group claims to be knowledgeable about the environment but is less concerned about itand does not
want issues to stand in the way of economic progress. Some may have rejected the “green movement”, and even be overly horsile towards
it. The proportion of Jaded consumers in the markets being tested is between 4 to 45 percent, underscoring the importance of using a
culturally-balanced segmentation scheme to classify customers when conducting global research.
In this survey Jaded consumers were screened out - as such our sample reflects consumers in each country who assign at least some
importance to environmental issues.
Green inDeed on the seven dimensions of green

Least
concerned
Least
Responsibitly

Most
Barriers

Least
Accepting

Least
Consideration

Least
Activism

Least
Informed

CONCERNS

ATTITUDES TOWARDS RESPONSIBILITY

BARRIERS TO GREEN

ATTITUDES TOWARDS GREEN PRODUCTS

CONSUMPTION DECISIONS

CONSUMPTION ACTIVISM

INFORMATION SEEKING AND INFLUENCE

Most
concerned

Most
Responsibiity

Fewest
Barriers

Most
Accepting

Most
Consideration

Most
Activism

Most
Informed
Carbon Cultured on the seven dimensions of green

Least
concerned
Least
Responsibitly

Most
Barriers

Least
Accepting

Least
Consideration

Least
Activism

Least
Informed

CONCERNS

Most
concerned

ATTITUDES TOWARDS RESPONSIBILITY

BARRIERS TO GREEN

Most
Responsibiity

Fewest
Barriers

ATTITUDES TOWARDS GREEN PRODUCTS

CONSUMPTION DECISIONS

Most
Accepting

Most
Consideration

CONSUMPTION ACTIVISM

INFORMATION SEEKING AND INFLUENCE

Most
Activism

Most
Informed
Green in Need on the seven dimensions of green

Least
concerned
Least
Responsibitly

Most
Barriers

Least
Accepting

Least
Consideration

Least
Activism

Least
Informed

CONCERNS

ATTITUDES TOWARDS RESPONSIBILITY

BARRIERS TO GREEN

ATTITUDES TOWARDS GREEN PRODUCTS

CONSUMPTION DECISIONS

CONSUMPTION ACTIVISM

INFORMATION SEEKING AND INFLUENCE

Most
concerned

Most
Responsibiity

Fewest
Barriers

Most
Accepting

Most
Consideration

Most
Activism

Most
Informed
Glamour Green on the seven dimensions of green

Least
concerned
Least
Responsibitly

Most
Barriers

Least
Accepting

Least
Consideration

Least
Activism

Least
Informed

CONCERNS

ATTITUDES TOWARDS RESPONSIBILITY

BARRIERS TO GREEN

ATTITUDES TOWARDS GREEN PRODUCTS

CONSUMPTION DECISIONS

CONSUMPTION ACTIVISM

INFORMATION SEEKING AND INFLUENCE

Most
concerned

Most
Responsibiity

Fewest
Barriers

Most
Accepting

Most
Consideration

Most
Activism

Most
Informed
FSC study: GfK Green Gauge segments by country
Brazil

Germany

24 %

China

South Africa

23 %

32 %
45 %

50 %

14 %

40 %

37 %

43 %
16 %

2%

12 %

Spain

21 %

Australia

35 %

34 %

24 %

9% 9%
India

UK

31 %

31 %

34 %

27 %

31 %

54 %
28 %

3%

12 %

34 %

1%

4%

40 %

2%

France

Hong Kong

Japan
18 %

23 %

27 %

45 %

41 %
29 %

62 %

13 %

5%

Green inDeed (3,084)

Green in Need (591)

Carbon Cultured (2,161)

32 %

3%
2%

Very few countries
have meaningful
numbers of the
Green in Need
segments.

Glamour Green (3,403)
FSC study: GfK Green Gauge segments by country

Europe:
Closer balance
between Green
inDeed, Carbon
Cultured, and
Glamour Green.

France

Spain

Germany

27 %

32 %

35 %

45 %

41 %
29 %

2%

21 %

UK

3%

2%

28 %

27 %

31 %

34 %

40 %

2%

Hong Kong

China

Brazil

24 %

14 %
12 %

Green inDeed

India

23 %
50 %

40 %

31 %

43 %
62 %

13 %

9% 9%

Carbon Cultured

3%

Green in Need

Glamour Green

54 %
12 %

4%

Developing
countries: Majority
of respondents fall
into Green inDeed
and Glamour Green,
thus exhibiting
stronger green
behaviors and
attitudes whether
genuinely committed
or as a skin-deep
badge of honor.
CONSUMERS ARE CONCERNED ABOUT THE ENVIRONMENT

© Helder Almeida
Consumers are concerned: Global level

The majority
of consumers
around the world
find both
environmental
pollution and
global climate
change/global
warming a high
concern.

ENVIRONMENTAL
POLLUTION
14 %

3%

15 %

84
Extremely or very serious
Somewhat serious
Not very or not at all serious

GLOBAL CLIMATE CHANGE/
GLOBAL WARMING

%

84 % find
environmental pollution
extremely or very
serious

3%

82

%

82 % find
global climate change/
global warming
extremely or very
serious

Q: Using a scale from 1 to 5, where “1” means “Not at all serious” and “5” means “Extremely serious”, please rate how serious a problem you think each of the following issues is? Base = Total (9,239)
Consumers are concerned: Country level
Environmental pollution
Global Climate Change/
Global Warming

Europeans set the average for
belief in the seriousness of
environmental pollution and
climate change. Asians show the
least concern, while people in
Brazil, South Africa and India are
most concerned.

7272
6565
6060
5656

5555

5050

4848 46
46
46
46
4040

4545
4242

3939 39 3838
39
3737

2626
1717

Brazil
Brazil
Brazil

South
Africa

India

ABOVE AVERAGE
CONCERN
Numbers show % Extremely Serious Concern

Spain

France Germany

AVERAGE
CONCERN

UK

Australia

Japan

2727

3131
2626

2020

Hong
Kong

China

BELOW AVERAGE
CONCERN
HOW DO CONSUMERS ACT UPON THIS CONCERN?

© gpointstudio
Consumer actions: Everyday life
Conserve energy

Conserve water

Recycle

84 84
84

78
78 78

75
75 75

8484
8484

7878
7878

7575
7575

Consider green
when purchasing

8484
84
52 52
52

Use green
transportation

7878
78
51 51
51

Use greener
home/car energy

7575
75
47 47
47

Talk about it

40 40
40

5252
5252

5151
5151

4747
4747

4040
4040

5252
52
25 25
25

5151
51
20 20
20

4747
47
19 19
19

4040
40

Research co.
practices

2525
2525
2525
25

Volunteer

2020
2020
2020
20

Contribute
money

Consumers respond
to their concerns
about pollution and
climate change
by acting green.
However, the
motivation is highest
if the green behavior
is easily incorporated
into their everyday
life and routine.

Q: Please indicate how often you or
someone in your household does it:

1919
1919

All or most of the time

1919
19

Almost never or never

Some of the time

Numbers show % All or most of the
time.
Base = Total (9,239)
Consumer actions: Everyday life
TOP ACTIONS

Green behavior is more
likely if the consumer
gains a direct benefit.
Green actions are
least likely when the
consumer has to invest
time and energy into the
behaviour.

Conserve energy

8484
84

Conserve water

84 84
84

78
78 78

75
75 75

5252
52

5151
51

4747
47

Research co.
practices

52 52
52

7878
78

51 51
51

Volunteer

Recycle

7575
75

Contribute
money

47 47
47

2525
25

2020
20
20 20
20

40 40
40

1919
19

25 25
25

4040
40

19 19
19

BOTTOM ACTIONS

Numbers shown % All or most of the time.
Consumer actions: Purchase behavior

Globally, most consumers believe their
purchases can make a difference and
many intend to increase their ecospending in the next year.

59

%

I am willing to
pay more for ecofriendly/green
products.

76

%

The purchasing
choices I make can
make a difference to
the environment.

60

%

I plan to spend more
on eco-friendly/
green products in
the next year.

Q: Please tell us how much you agree or disagree with each of the following statements. Base = Total (9,239)

53

%

I am less likely to
switch to brands when
a product is ecofriendly/green than
when a product is not.

Furthermore, the majority of consumers are
willing to pay more for eco-friendly products
and are less likely to switch brands, when
the product is green.

Numbers show % Agree Somewhat/Strongly
Consumer actions: Purchase behavior

88

79

88
71

73
79
63

71

63

74

73
50

49

56
49

9
63

71

63

74

73

49

56
50 49
50

56

48

55

74

48

I am willing to pay more for
eco-friendly products.

Green inDeed (3,084)

48

55

56

62
56

I plan to spend more on ecofriendly/green products in the
next year.

The purchasing choices I make
can make a difference to the
environment.

73

50

56

74

Carbon Cultured (2,161)

56 55
55
48

62
56

62
46

51
48 46
48

51

62
Green inDeed
51
consumers believe 51
48
48
46
46
most in the impact
of eco-conscious
spending, are most
willing to pay more for
eco-friendly products,
and plan to increase
eco-spending in the
next year.

Carbon Cultured
consumers are least
likely to spend more or
increase spending on
eco-friendly products.

I am less likely to switch
brands when a product is
eco-friendly/green than when a
product is not.

Green in Need (591)

Glamour Green (3,403)

Numbers show % Agree Somewhat/Strongly
WHO IS RESPONSIBLE FOR FIXING THE PROBLEM?

© FSC Denmark
Responsibility and barriers to being green

80
Br

%

of consumers strongly or slighty
agree that companies should be
responsible for fixing the problem.

nd
a

55

%

42

%

Being green is too
expensive.

The government
should address
the problem.

28

%

I am too busy.

21

%

Familiy rejects
eco-friendly
products.

51

%

29

%

I don’t know how
to do more.

80

55

51

42

29

Eco-friendly
products don’t
work as well.

25

39

%

28

28

25

28

21

29

25

First comes
economic
security.

27

28
43
33

13
7

18

31

46

50
Agree strongly
or slighty
Neither

22
Disagree
slighty or
strongly

Green numbers show % Strongly/Slighty Agree.
Q: How much do you agree or disagree with each of these statements regarding your lifestyle and attitudes toward the envrionment, please use a scale where “1” means “disagree strongly” and “5” means “agree strongly”.
Base = Total (9,239)
Consumers trust varies

50

%

44

%

Awards and
recognition by
independent third
party sources

Certification
seals are the
most trusted
source of
information on a
product’s level
of environmental
and social
responsibility.

20

of consumers fully trust
certification seals or labels
on products packaging.

34

%

Consumer reviews,
ratings, blogs or
message boards

43

%

Friends, family
or co-workers

34

26

%

of consumers fully trust
company advertising.

22

%

Media reports

%

Company website or a
company’s Facebook page

50

%

44
49

44

32

CSR or
sustainability
reports

Government
information or
reports

31

7

43

52 5

34

57

9

34

56

10

53

32

%

5

31

%

Statements
made on
product
packaging

59
61

26
22

61

20
Fully trust

60
May or may not trust

15
10
13
18
20

DO NOT trust

Green numbers show % Fully Trust.
Q: How much do you trust each of the following sources to inform you about whether or not a product is environmentally friendly and socially responsible? (“I fully trust this source” to “I do not trust this source at all”.
Base = Total (9,239)
Impact of ENGOs and for-profit brands on the FSC label

69

%

63

%

65

%

would trust the FSC label more
when endorsed by non-profit
organisation WWF

would trust the FSC label
more when endorsed by
for-profit organisation HP

Surprisingly,
when it comes
to building
consumer trust
for-profit brands
show to be as
influential as nonprofit ENGOs.

64

%

would trust the FSC label more
when endorsed by non-profit
organisation Greenpeace

would trust the FSC label more
when endorsed by for-profit
organisation Kleenex

Respondents rated from a list of preselected options on a three point positive influence scale.

Numbers shown are in percentage.

Q: If you learned that the Forest Stewardship Council was endorsed by each of the following, how would that relationship influence you to look for the FSC seal on products? / Q: The Forest Stewardship Council certifies a
number of brands and retailers. They support the FSC’s efforts to encourage more responsible forest management. If you learned that these brands and retailers offer FSC-certified products, how would that influence your
feelings toward the Forest Stweardship Council? Base = Total (9,239)
Summary

1
2
3

Consumers are highly concerned
about environmental pollution and
global warming/global climate
change. And they want to do
their part by purchasing ‘green’
products.
Consumers believe that
companies are responsible for
solving environmental challenges,
but have high distrust for
companies specific messaging on
this topic.
Consumers trust is highest
for certification seals or labels
on product packaging, which
tell them if the product is
environmentally and socially
responsible.

4
5
6

Consumers report that trusted and
well-known brands can positively
influence their green purchasing
decisions.

The credibility of a certification
seal together with the consumer
equity of a trusted brand equals
an influence that is greater than
either group can exercise alone.

Telling the FSC story in
conjunction with a trusted brand
makes it easy for shoppers to be
confident that the company is
taking care of the environment.

© FSC Germany
Let’s talk...
If you would like to collaborate or discuss working with
FSC to achieve your sustainability goals please contact: 
Marcelle Peuckert, Business Development Director
m.peuckert@fsc.org
Carla Tavares, Marketing Manager
c.tavares@fsc.org
© Uwe Sayer
Forest Stewardship Council®

FSC Global Development GmbH
Charles de Gaulle Straße 5
53113 Bonn, Germany
T +49 (0) 228 367 660
F +49 (0) 228 367 66 30
www.fsc.org

FSC® F000100
Copyright © 2013 FSC G.D. All rights reserved

FSC Global Consumer Research Highlights

  • 1.
    © Inger Kærgaard Amainstream concern: ® FSC Global Consumer Research Highlights
  • 2.
    Background and objectives Ourgoals The FSC commissioned this research to better understand the global mainstream consumer. As part of our research we asked some general questions, the answers from which we are sharing here. • Profiles global mainstream consumers in terms of their green habits/values and purchasing habits • Looks at loyalty to green brands • Looks at influence of for profit brands on purchasing of FSC certified products • Looks at barriers to green behavior GfK consumer segmentation The Global Green Consumer Classification Scheme segment consumers by their green attitudes/behaviors via GfK’s global Green Gauge® segmentation. Green Gauge is calibrated to address cultural differences in the green category. It also provides diagnostics for nearly 20 green behaviors and attitudes.
  • 3.
    Study design: 11 MARKETS 937 904 908 906 923 536 927 455 924 909 910 Maximumof 75 % urban in Brazil, South Africa, India and China 9 000+ RESPONDENTS Age: 21-64 35 % 65 % Minimum 100 women with kids at home Data for this study were collected from September 12 - 19, 2013, via online interviews sourced from opt-in online panels, using an online consumer sample that excluded the Green Gauge Jaded segment and that met all quota and respondent qualification criteria for the study.
  • 4.
    GfK Green Gauge THESEVEN DIMENSIONS OF GREEN CONCERNS 1. Concerns/ Seriousness of environmental issues ATTITUDES 2. Attitudes towards environmental responsibility The GfK Green Gauge Global Segmentation algorithm was used to clasify participants in this research. This approach profiles people broadly on multiple dimensions of green attitudes and behaviors. 3. Barriers to green living BEHAVIORS 4. Attitudes towards green products 5. Consumption decisions 6. Activism 7. Information seeking and influence
  • 5.
    Segment definitions: 5green consumer segments The greenest segment. This group shows the highest concern for the environment, and they put their money where their mouth is when it comes to green behavior. Many of these people are located in markets where green has long been on the national agenda (mostly the developed world). As a result they show a high degree of concern for the environment, but some of their behaviors lack. A group that exists almost exclusively in the developing world. They have the desire, but lack the means and know-how to be more green. Given the right tools, these people could climb the environmental ladder and become Green inDeeds. “Green” to this group is a status symbol. The environment is only skin deep to them. They are less likely to have core green values, but they will participate if it means they can display their green badge of honor. They do things that are expected of them like recycling and conserving energy/water, but many of the “harder” behaviours are still at or below global norms. A cynical an skeptical group. This group claims to be knowledgeable about the environment but is less concerned about itand does not want issues to stand in the way of economic progress. Some may have rejected the “green movement”, and even be overly horsile towards it. The proportion of Jaded consumers in the markets being tested is between 4 to 45 percent, underscoring the importance of using a culturally-balanced segmentation scheme to classify customers when conducting global research. In this survey Jaded consumers were screened out - as such our sample reflects consumers in each country who assign at least some importance to environmental issues.
  • 6.
    Green inDeed onthe seven dimensions of green Least concerned Least Responsibitly Most Barriers Least Accepting Least Consideration Least Activism Least Informed CONCERNS ATTITUDES TOWARDS RESPONSIBILITY BARRIERS TO GREEN ATTITUDES TOWARDS GREEN PRODUCTS CONSUMPTION DECISIONS CONSUMPTION ACTIVISM INFORMATION SEEKING AND INFLUENCE Most concerned Most Responsibiity Fewest Barriers Most Accepting Most Consideration Most Activism Most Informed
  • 7.
    Carbon Cultured onthe seven dimensions of green Least concerned Least Responsibitly Most Barriers Least Accepting Least Consideration Least Activism Least Informed CONCERNS Most concerned ATTITUDES TOWARDS RESPONSIBILITY BARRIERS TO GREEN Most Responsibiity Fewest Barriers ATTITUDES TOWARDS GREEN PRODUCTS CONSUMPTION DECISIONS Most Accepting Most Consideration CONSUMPTION ACTIVISM INFORMATION SEEKING AND INFLUENCE Most Activism Most Informed
  • 8.
    Green in Needon the seven dimensions of green Least concerned Least Responsibitly Most Barriers Least Accepting Least Consideration Least Activism Least Informed CONCERNS ATTITUDES TOWARDS RESPONSIBILITY BARRIERS TO GREEN ATTITUDES TOWARDS GREEN PRODUCTS CONSUMPTION DECISIONS CONSUMPTION ACTIVISM INFORMATION SEEKING AND INFLUENCE Most concerned Most Responsibiity Fewest Barriers Most Accepting Most Consideration Most Activism Most Informed
  • 9.
    Glamour Green onthe seven dimensions of green Least concerned Least Responsibitly Most Barriers Least Accepting Least Consideration Least Activism Least Informed CONCERNS ATTITUDES TOWARDS RESPONSIBILITY BARRIERS TO GREEN ATTITUDES TOWARDS GREEN PRODUCTS CONSUMPTION DECISIONS CONSUMPTION ACTIVISM INFORMATION SEEKING AND INFLUENCE Most concerned Most Responsibiity Fewest Barriers Most Accepting Most Consideration Most Activism Most Informed
  • 10.
    FSC study: GfKGreen Gauge segments by country Brazil Germany 24 % China South Africa 23 % 32 % 45 % 50 % 14 % 40 % 37 % 43 % 16 % 2% 12 % Spain 21 % Australia 35 % 34 % 24 % 9% 9% India UK 31 % 31 % 34 % 27 % 31 % 54 % 28 % 3% 12 % 34 % 1% 4% 40 % 2% France Hong Kong Japan 18 % 23 % 27 % 45 % 41 % 29 % 62 % 13 % 5% Green inDeed (3,084) Green in Need (591) Carbon Cultured (2,161) 32 % 3% 2% Very few countries have meaningful numbers of the Green in Need segments. Glamour Green (3,403)
  • 11.
    FSC study: GfKGreen Gauge segments by country Europe: Closer balance between Green inDeed, Carbon Cultured, and Glamour Green. France Spain Germany 27 % 32 % 35 % 45 % 41 % 29 % 2% 21 % UK 3% 2% 28 % 27 % 31 % 34 % 40 % 2% Hong Kong China Brazil 24 % 14 % 12 % Green inDeed India 23 % 50 % 40 % 31 % 43 % 62 % 13 % 9% 9% Carbon Cultured 3% Green in Need Glamour Green 54 % 12 % 4% Developing countries: Majority of respondents fall into Green inDeed and Glamour Green, thus exhibiting stronger green behaviors and attitudes whether genuinely committed or as a skin-deep badge of honor.
  • 12.
    CONSUMERS ARE CONCERNEDABOUT THE ENVIRONMENT © Helder Almeida
  • 13.
    Consumers are concerned:Global level The majority of consumers around the world find both environmental pollution and global climate change/global warming a high concern. ENVIRONMENTAL POLLUTION 14 % 3% 15 % 84 Extremely or very serious Somewhat serious Not very or not at all serious GLOBAL CLIMATE CHANGE/ GLOBAL WARMING % 84 % find environmental pollution extremely or very serious 3% 82 % 82 % find global climate change/ global warming extremely or very serious Q: Using a scale from 1 to 5, where “1” means “Not at all serious” and “5” means “Extremely serious”, please rate how serious a problem you think each of the following issues is? Base = Total (9,239)
  • 14.
    Consumers are concerned:Country level Environmental pollution Global Climate Change/ Global Warming Europeans set the average for belief in the seriousness of environmental pollution and climate change. Asians show the least concern, while people in Brazil, South Africa and India are most concerned. 7272 6565 6060 5656 5555 5050 4848 46 46 46 46 4040 4545 4242 3939 39 3838 39 3737 2626 1717 Brazil Brazil Brazil South Africa India ABOVE AVERAGE CONCERN Numbers show % Extremely Serious Concern Spain France Germany AVERAGE CONCERN UK Australia Japan 2727 3131 2626 2020 Hong Kong China BELOW AVERAGE CONCERN
  • 15.
    HOW DO CONSUMERSACT UPON THIS CONCERN? © gpointstudio
  • 16.
    Consumer actions: Everydaylife Conserve energy Conserve water Recycle 84 84 84 78 78 78 75 75 75 8484 8484 7878 7878 7575 7575 Consider green when purchasing 8484 84 52 52 52 Use green transportation 7878 78 51 51 51 Use greener home/car energy 7575 75 47 47 47 Talk about it 40 40 40 5252 5252 5151 5151 4747 4747 4040 4040 5252 52 25 25 25 5151 51 20 20 20 4747 47 19 19 19 4040 40 Research co. practices 2525 2525 2525 25 Volunteer 2020 2020 2020 20 Contribute money Consumers respond to their concerns about pollution and climate change by acting green. However, the motivation is highest if the green behavior is easily incorporated into their everyday life and routine. Q: Please indicate how often you or someone in your household does it: 1919 1919 All or most of the time 1919 19 Almost never or never Some of the time Numbers show % All or most of the time. Base = Total (9,239)
  • 17.
    Consumer actions: Everydaylife TOP ACTIONS Green behavior is more likely if the consumer gains a direct benefit. Green actions are least likely when the consumer has to invest time and energy into the behaviour. Conserve energy 8484 84 Conserve water 84 84 84 78 78 78 75 75 75 5252 52 5151 51 4747 47 Research co. practices 52 52 52 7878 78 51 51 51 Volunteer Recycle 7575 75 Contribute money 47 47 47 2525 25 2020 20 20 20 20 40 40 40 1919 19 25 25 25 4040 40 19 19 19 BOTTOM ACTIONS Numbers shown % All or most of the time.
  • 18.
    Consumer actions: Purchasebehavior Globally, most consumers believe their purchases can make a difference and many intend to increase their ecospending in the next year. 59 % I am willing to pay more for ecofriendly/green products. 76 % The purchasing choices I make can make a difference to the environment. 60 % I plan to spend more on eco-friendly/ green products in the next year. Q: Please tell us how much you agree or disagree with each of the following statements. Base = Total (9,239) 53 % I am less likely to switch to brands when a product is ecofriendly/green than when a product is not. Furthermore, the majority of consumers are willing to pay more for eco-friendly products and are less likely to switch brands, when the product is green. Numbers show % Agree Somewhat/Strongly
  • 19.
    Consumer actions: Purchasebehavior 88 79 88 71 73 79 63 71 63 74 73 50 49 56 49 9 63 71 63 74 73 49 56 50 49 50 56 48 55 74 48 I am willing to pay more for eco-friendly products. Green inDeed (3,084) 48 55 56 62 56 I plan to spend more on ecofriendly/green products in the next year. The purchasing choices I make can make a difference to the environment. 73 50 56 74 Carbon Cultured (2,161) 56 55 55 48 62 56 62 46 51 48 46 48 51 62 Green inDeed 51 consumers believe 51 48 48 46 46 most in the impact of eco-conscious spending, are most willing to pay more for eco-friendly products, and plan to increase eco-spending in the next year. Carbon Cultured consumers are least likely to spend more or increase spending on eco-friendly products. I am less likely to switch brands when a product is eco-friendly/green than when a product is not. Green in Need (591) Glamour Green (3,403) Numbers show % Agree Somewhat/Strongly
  • 20.
    WHO IS RESPONSIBLEFOR FIXING THE PROBLEM? © FSC Denmark
  • 21.
    Responsibility and barriersto being green 80 Br % of consumers strongly or slighty agree that companies should be responsible for fixing the problem. nd a 55 % 42 % Being green is too expensive. The government should address the problem. 28 % I am too busy. 21 % Familiy rejects eco-friendly products. 51 % 29 % I don’t know how to do more. 80 55 51 42 29 Eco-friendly products don’t work as well. 25 39 % 28 28 25 28 21 29 25 First comes economic security. 27 28 43 33 13 7 18 31 46 50 Agree strongly or slighty Neither 22 Disagree slighty or strongly Green numbers show % Strongly/Slighty Agree. Q: How much do you agree or disagree with each of these statements regarding your lifestyle and attitudes toward the envrionment, please use a scale where “1” means “disagree strongly” and “5” means “agree strongly”. Base = Total (9,239)
  • 22.
    Consumers trust varies 50 % 44 % Awardsand recognition by independent third party sources Certification seals are the most trusted source of information on a product’s level of environmental and social responsibility. 20 of consumers fully trust certification seals or labels on products packaging. 34 % Consumer reviews, ratings, blogs or message boards 43 % Friends, family or co-workers 34 26 % of consumers fully trust company advertising. 22 % Media reports % Company website or a company’s Facebook page 50 % 44 49 44 32 CSR or sustainability reports Government information or reports 31 7 43 52 5 34 57 9 34 56 10 53 32 % 5 31 % Statements made on product packaging 59 61 26 22 61 20 Fully trust 60 May or may not trust 15 10 13 18 20 DO NOT trust Green numbers show % Fully Trust. Q: How much do you trust each of the following sources to inform you about whether or not a product is environmentally friendly and socially responsible? (“I fully trust this source” to “I do not trust this source at all”. Base = Total (9,239)
  • 23.
    Impact of ENGOsand for-profit brands on the FSC label 69 % 63 % 65 % would trust the FSC label more when endorsed by non-profit organisation WWF would trust the FSC label more when endorsed by for-profit organisation HP Surprisingly, when it comes to building consumer trust for-profit brands show to be as influential as nonprofit ENGOs. 64 % would trust the FSC label more when endorsed by non-profit organisation Greenpeace would trust the FSC label more when endorsed by for-profit organisation Kleenex Respondents rated from a list of preselected options on a three point positive influence scale. Numbers shown are in percentage. Q: If you learned that the Forest Stewardship Council was endorsed by each of the following, how would that relationship influence you to look for the FSC seal on products? / Q: The Forest Stewardship Council certifies a number of brands and retailers. They support the FSC’s efforts to encourage more responsible forest management. If you learned that these brands and retailers offer FSC-certified products, how would that influence your feelings toward the Forest Stweardship Council? Base = Total (9,239)
  • 24.
    Summary 1 2 3 Consumers are highlyconcerned about environmental pollution and global warming/global climate change. And they want to do their part by purchasing ‘green’ products. Consumers believe that companies are responsible for solving environmental challenges, but have high distrust for companies specific messaging on this topic. Consumers trust is highest for certification seals or labels on product packaging, which tell them if the product is environmentally and socially responsible. 4 5 6 Consumers report that trusted and well-known brands can positively influence their green purchasing decisions. The credibility of a certification seal together with the consumer equity of a trusted brand equals an influence that is greater than either group can exercise alone. Telling the FSC story in conjunction with a trusted brand makes it easy for shoppers to be confident that the company is taking care of the environment. © FSC Germany
  • 25.
    Let’s talk... If youwould like to collaborate or discuss working with FSC to achieve your sustainability goals please contact:  Marcelle Peuckert, Business Development Director m.peuckert@fsc.org Carla Tavares, Marketing Manager c.tavares@fsc.org © Uwe Sayer
  • 26.
    Forest Stewardship Council® FSCGlobal Development GmbH Charles de Gaulle Straße 5 53113 Bonn, Germany T +49 (0) 228 367 660 F +49 (0) 228 367 66 30 www.fsc.org FSC® F000100 Copyright © 2013 FSC G.D. All rights reserved