
Download to read offline
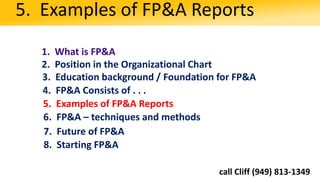
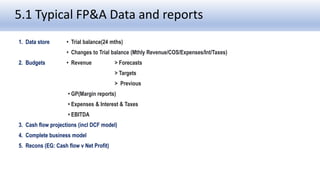
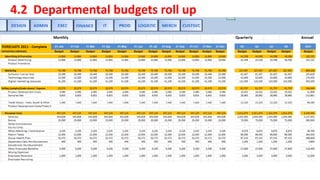


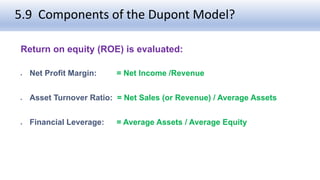
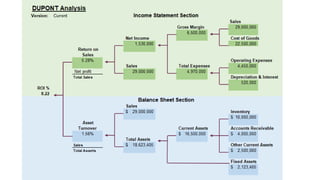
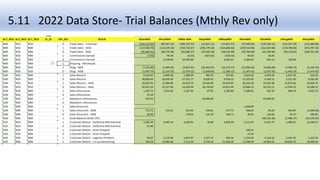
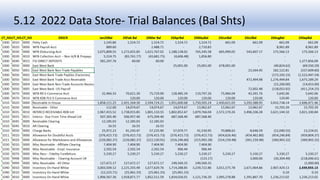
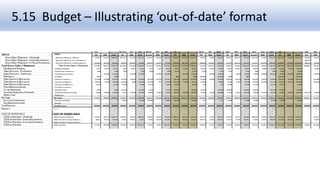
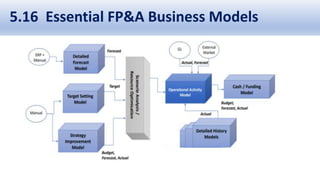


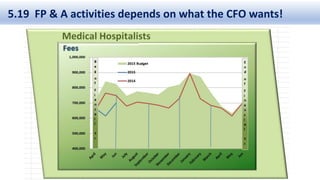
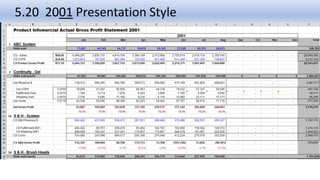
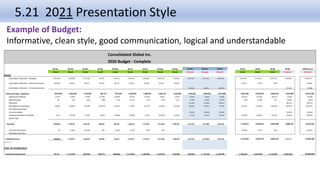
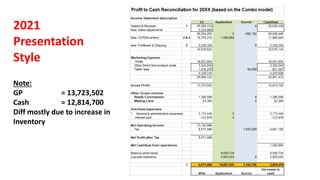


This document discusses financial planning and analysis (FP&A), including what FP&A is, where it fits in an organization, typical education and skills needed, common reports and techniques used, and the future of the field. It provides examples of monthly budget reports for revenue and cost of goods sold for a company, including line items for sales, discounts, returns, expenses, variances, and more. It also lists typical FP&A data and reports such as trial balances, budgets, cash flow projections, business models, and reconciliations.


