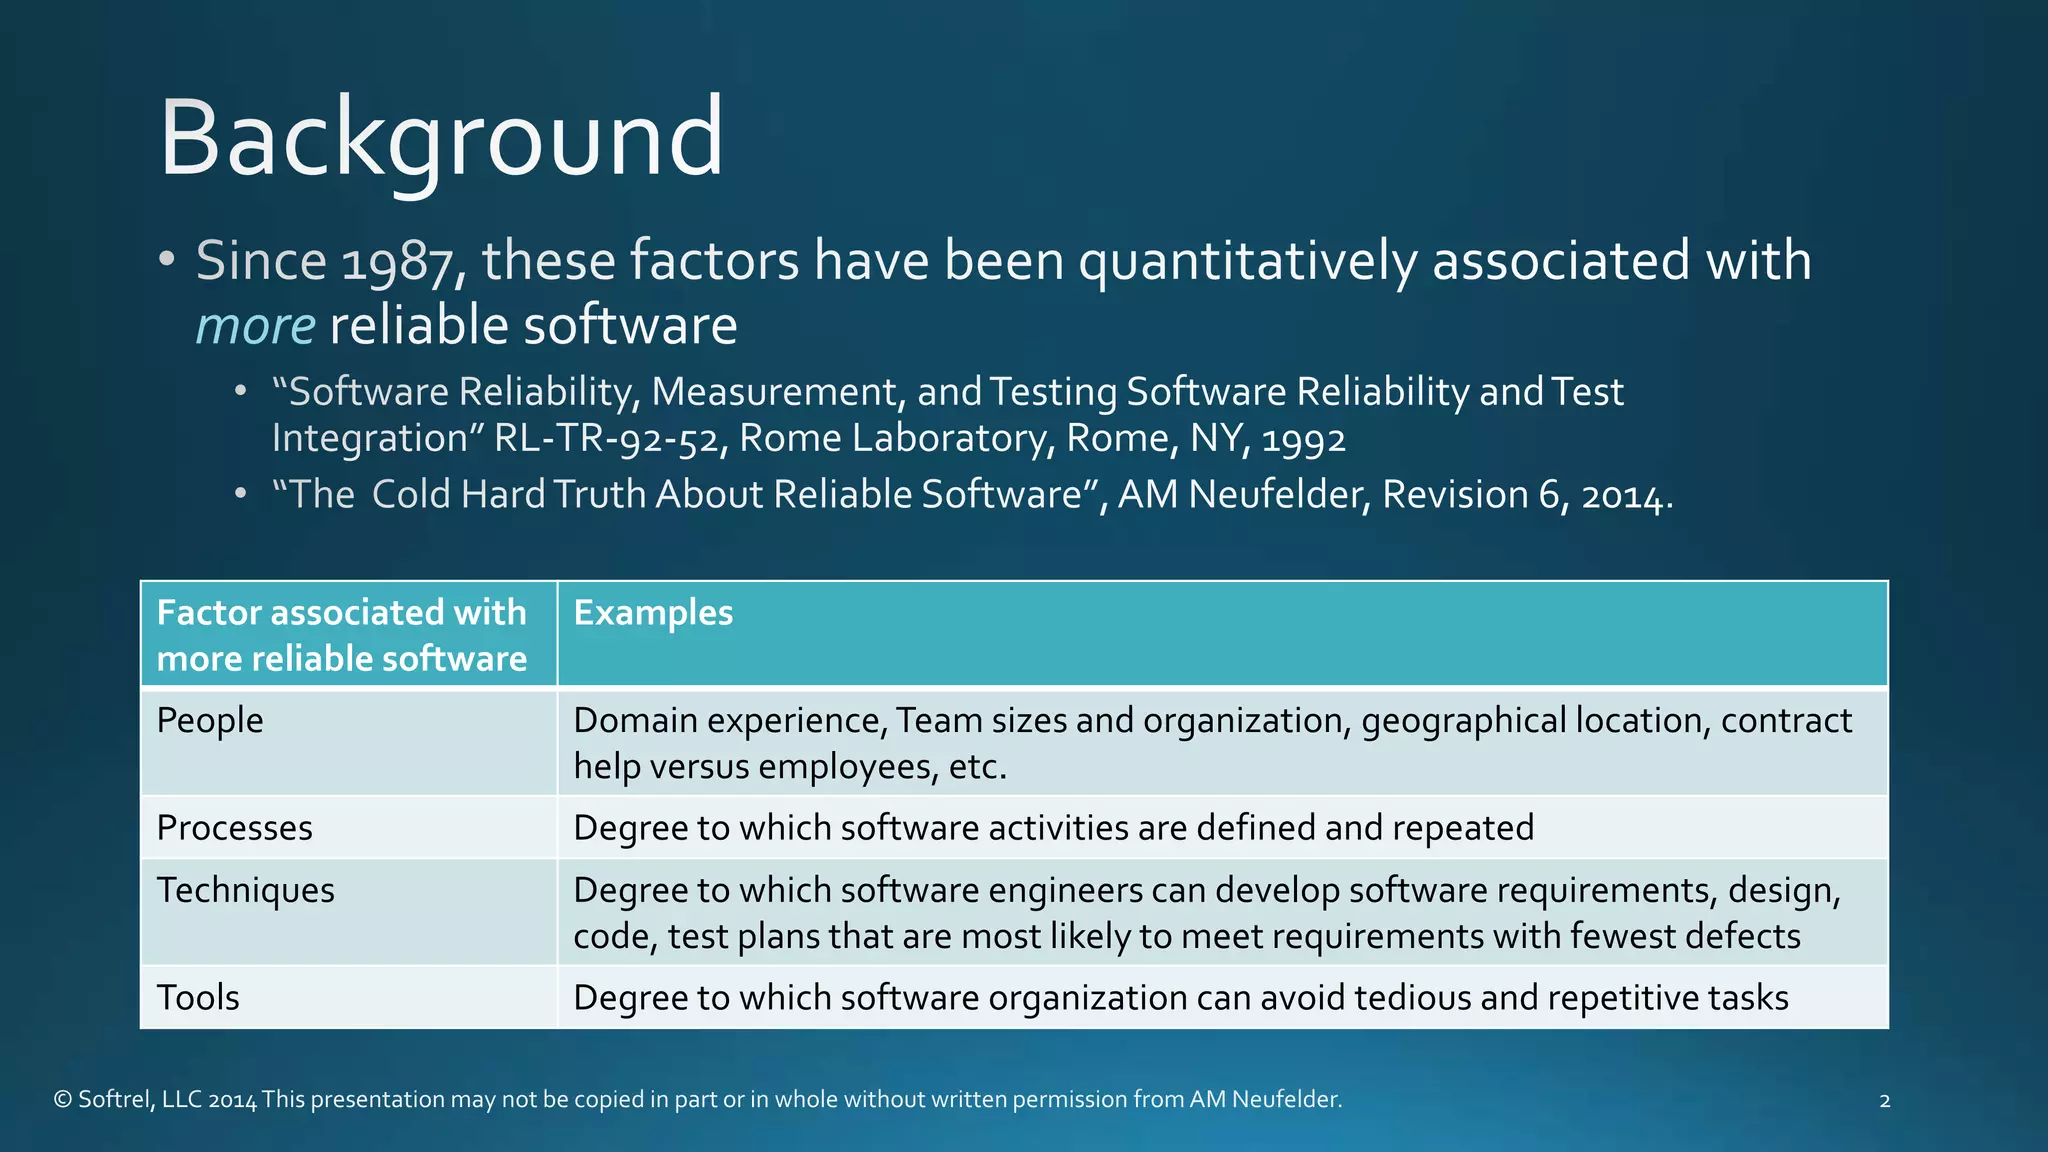
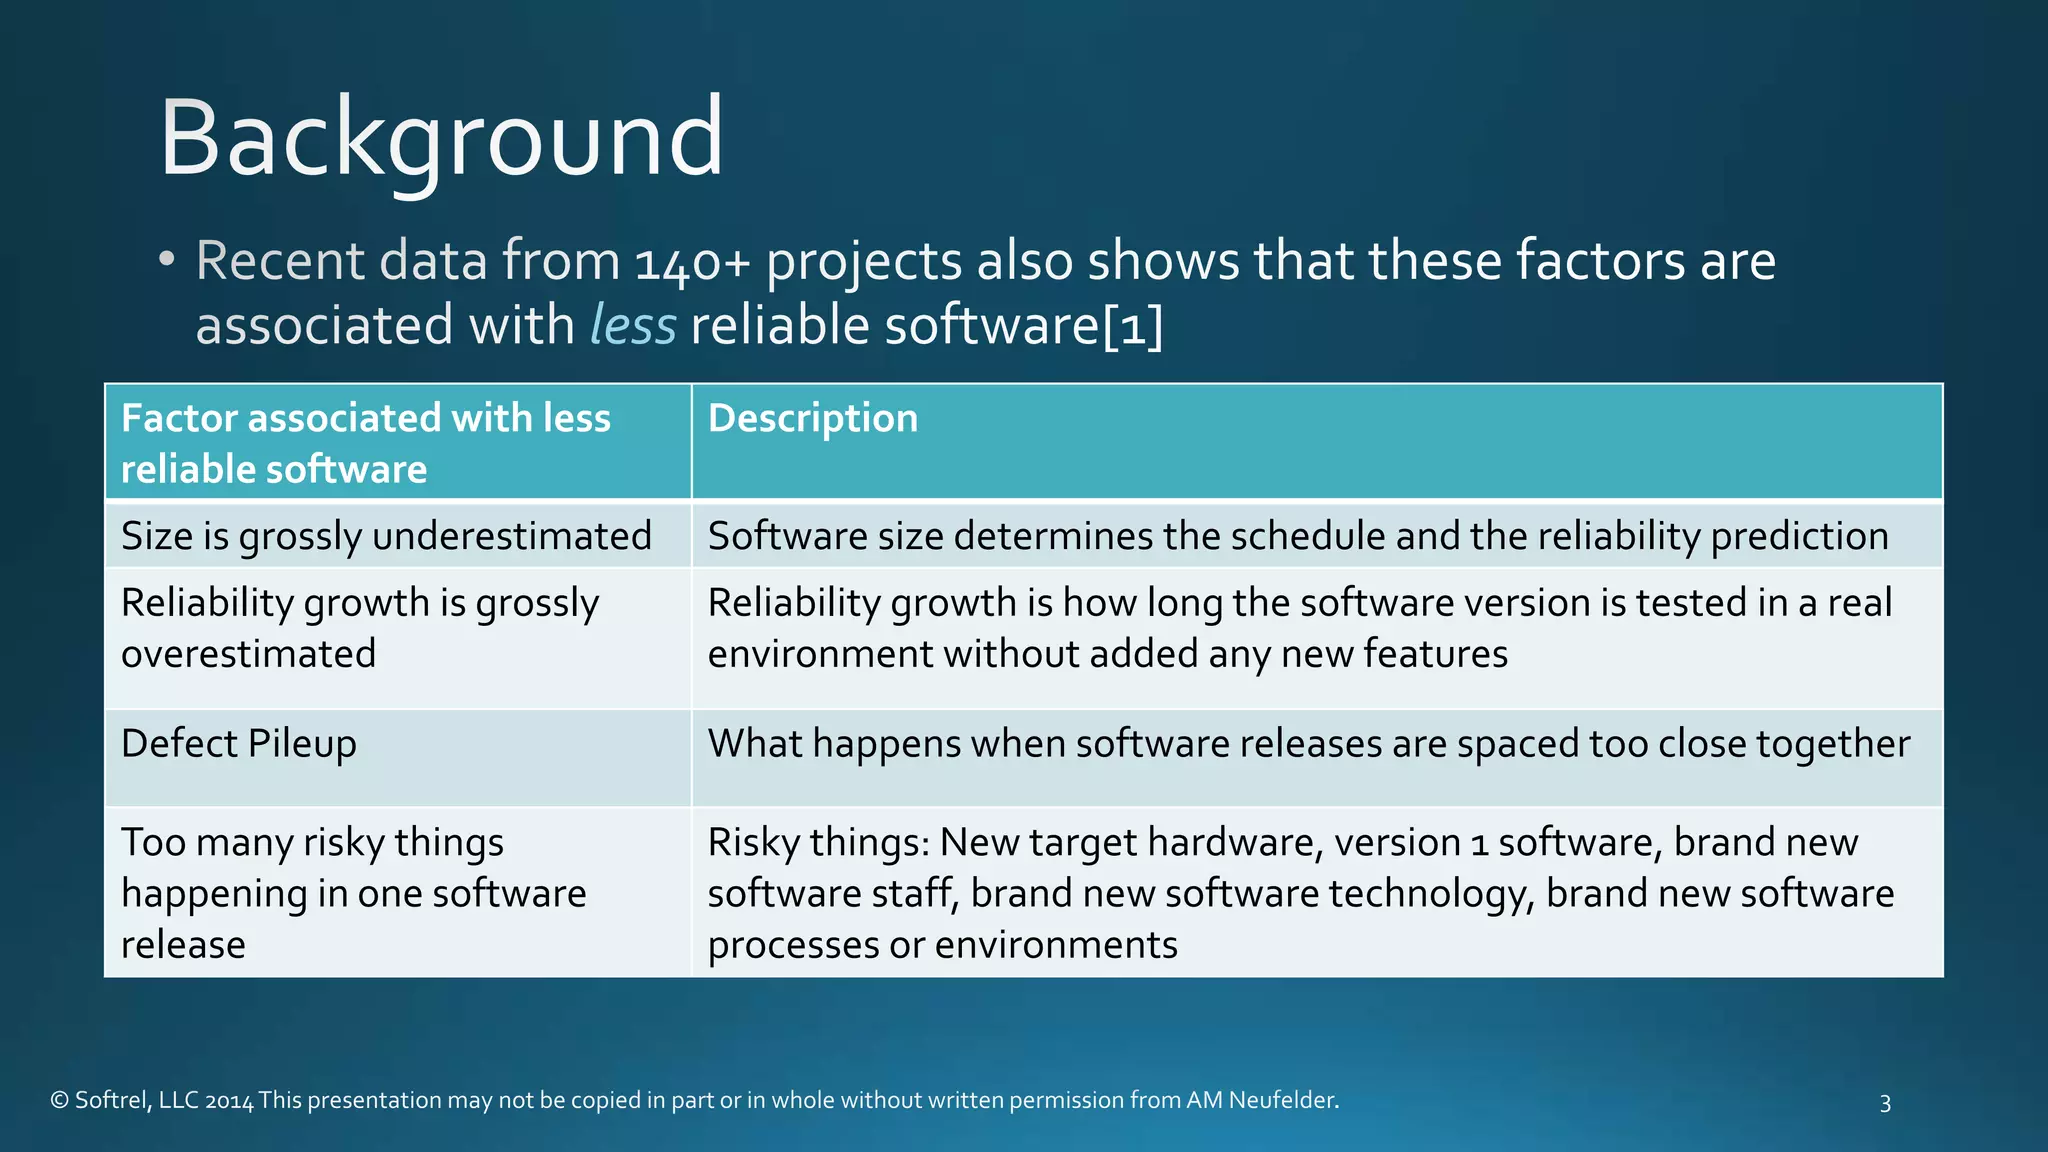
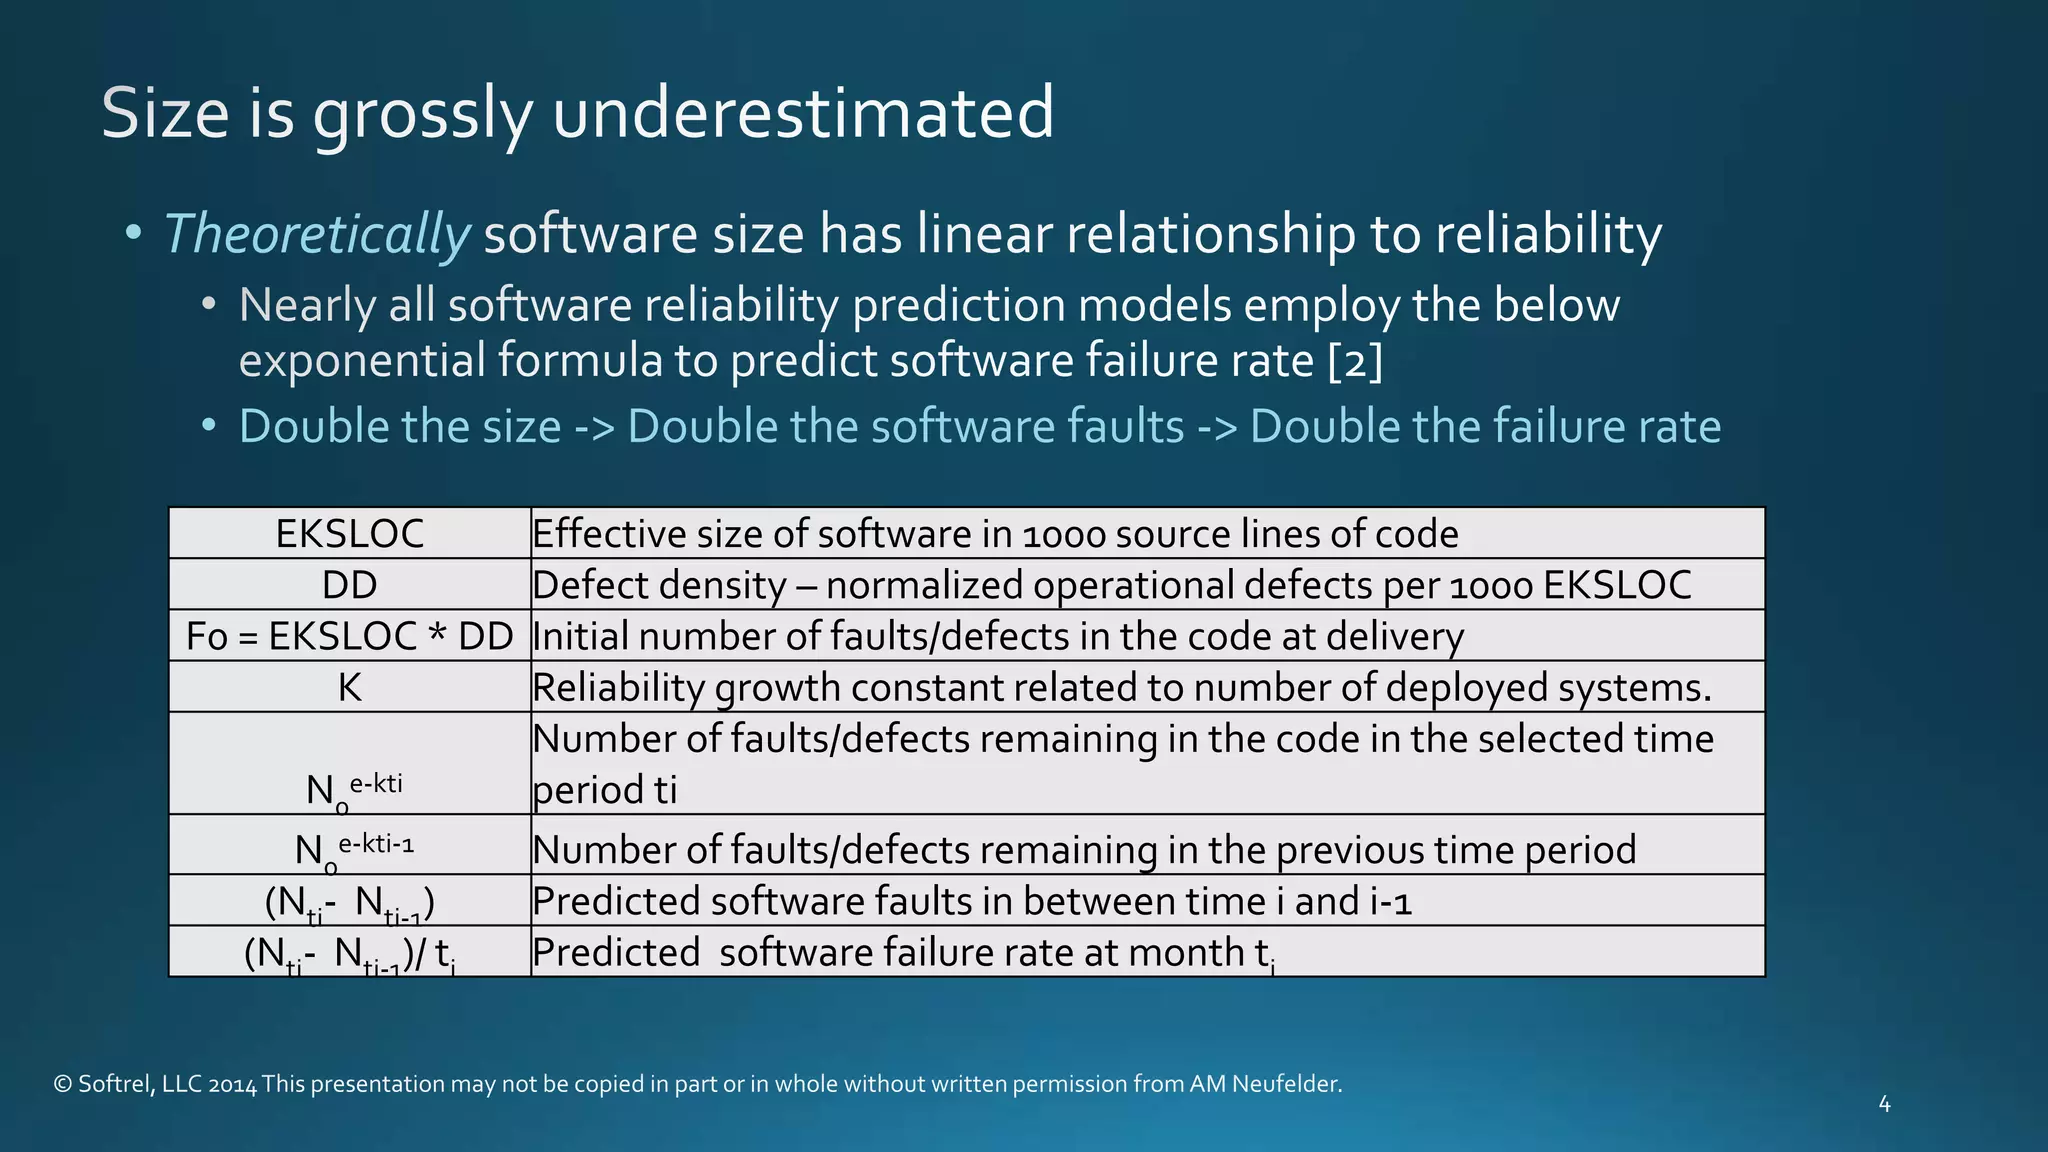
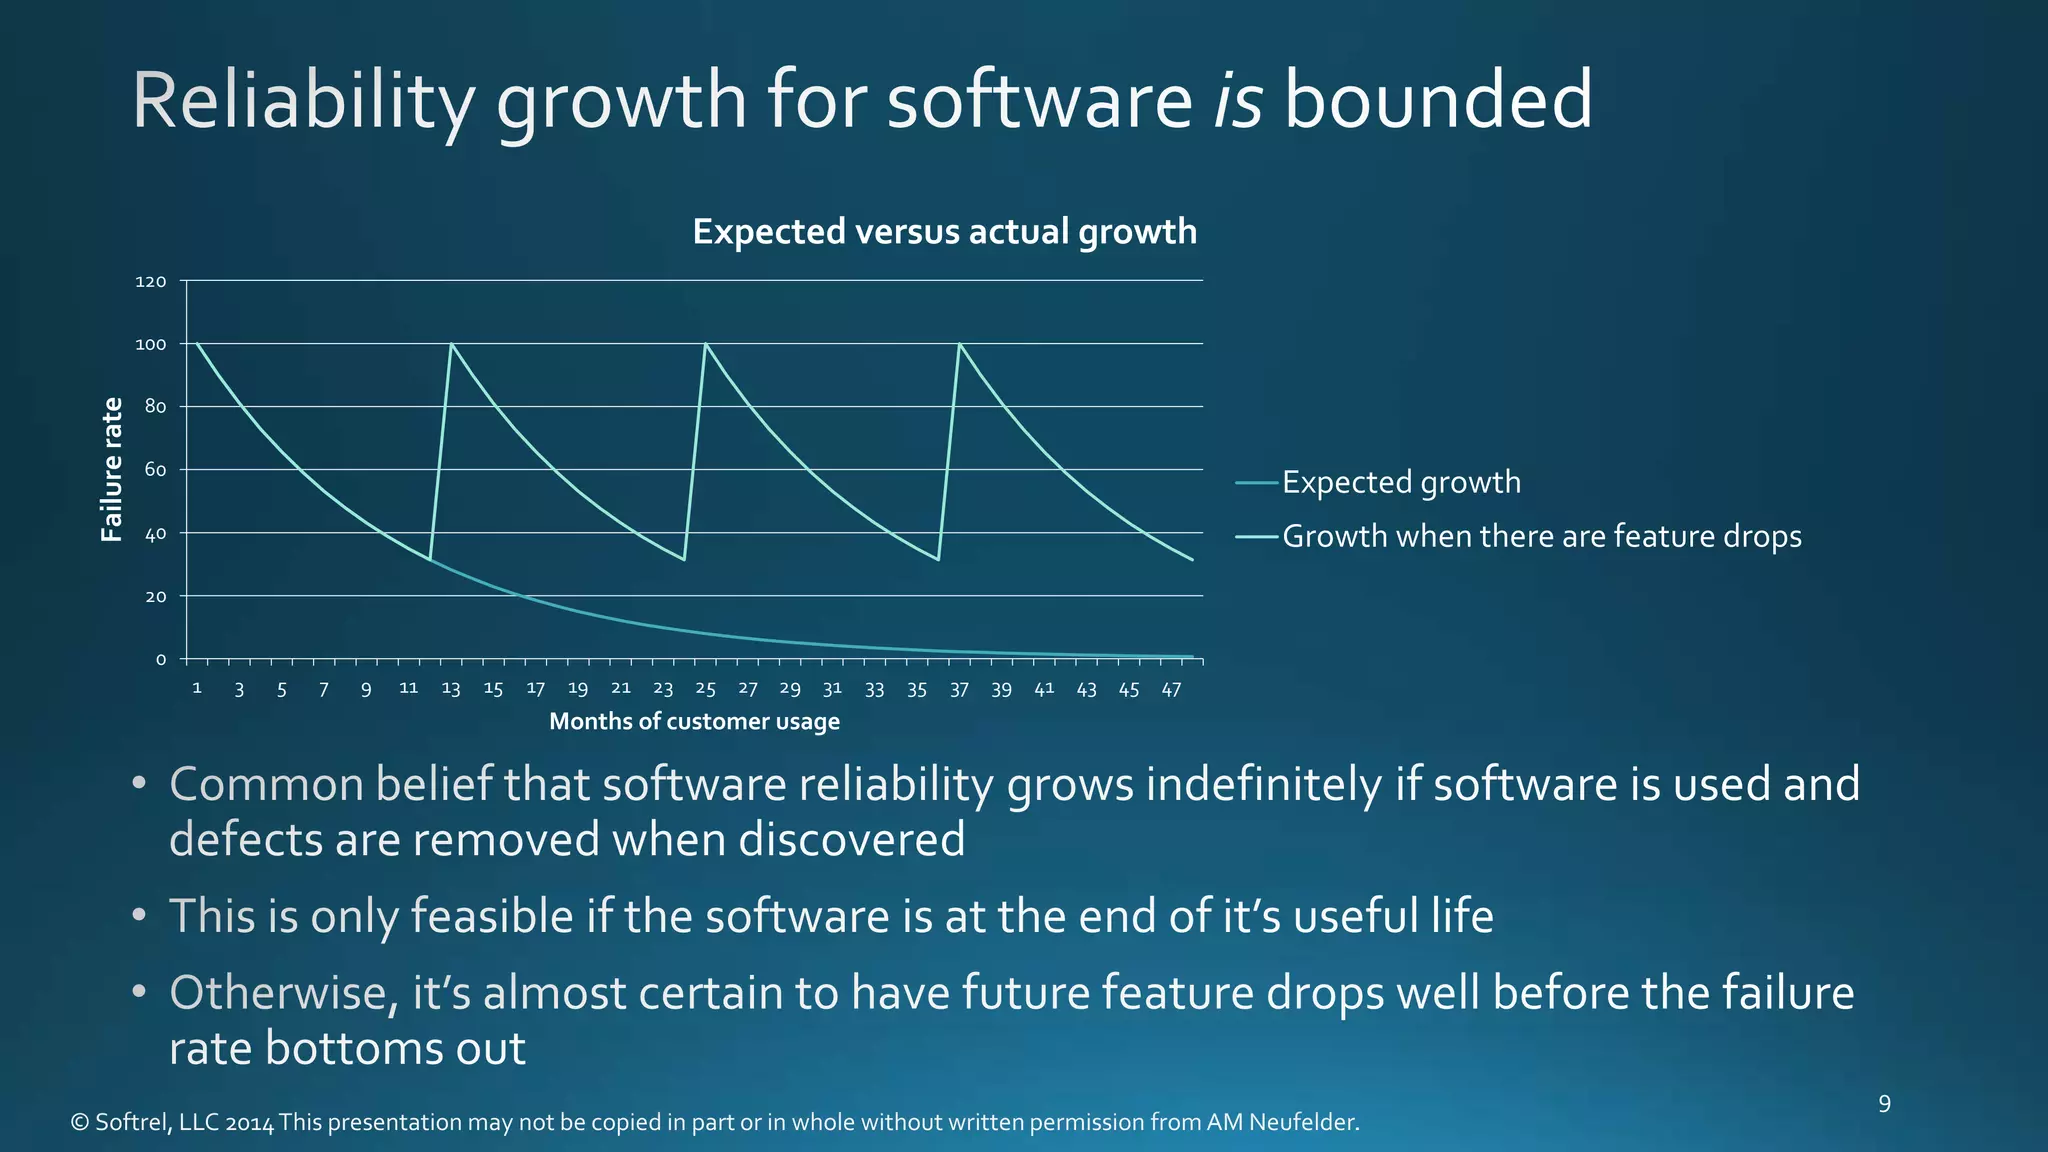
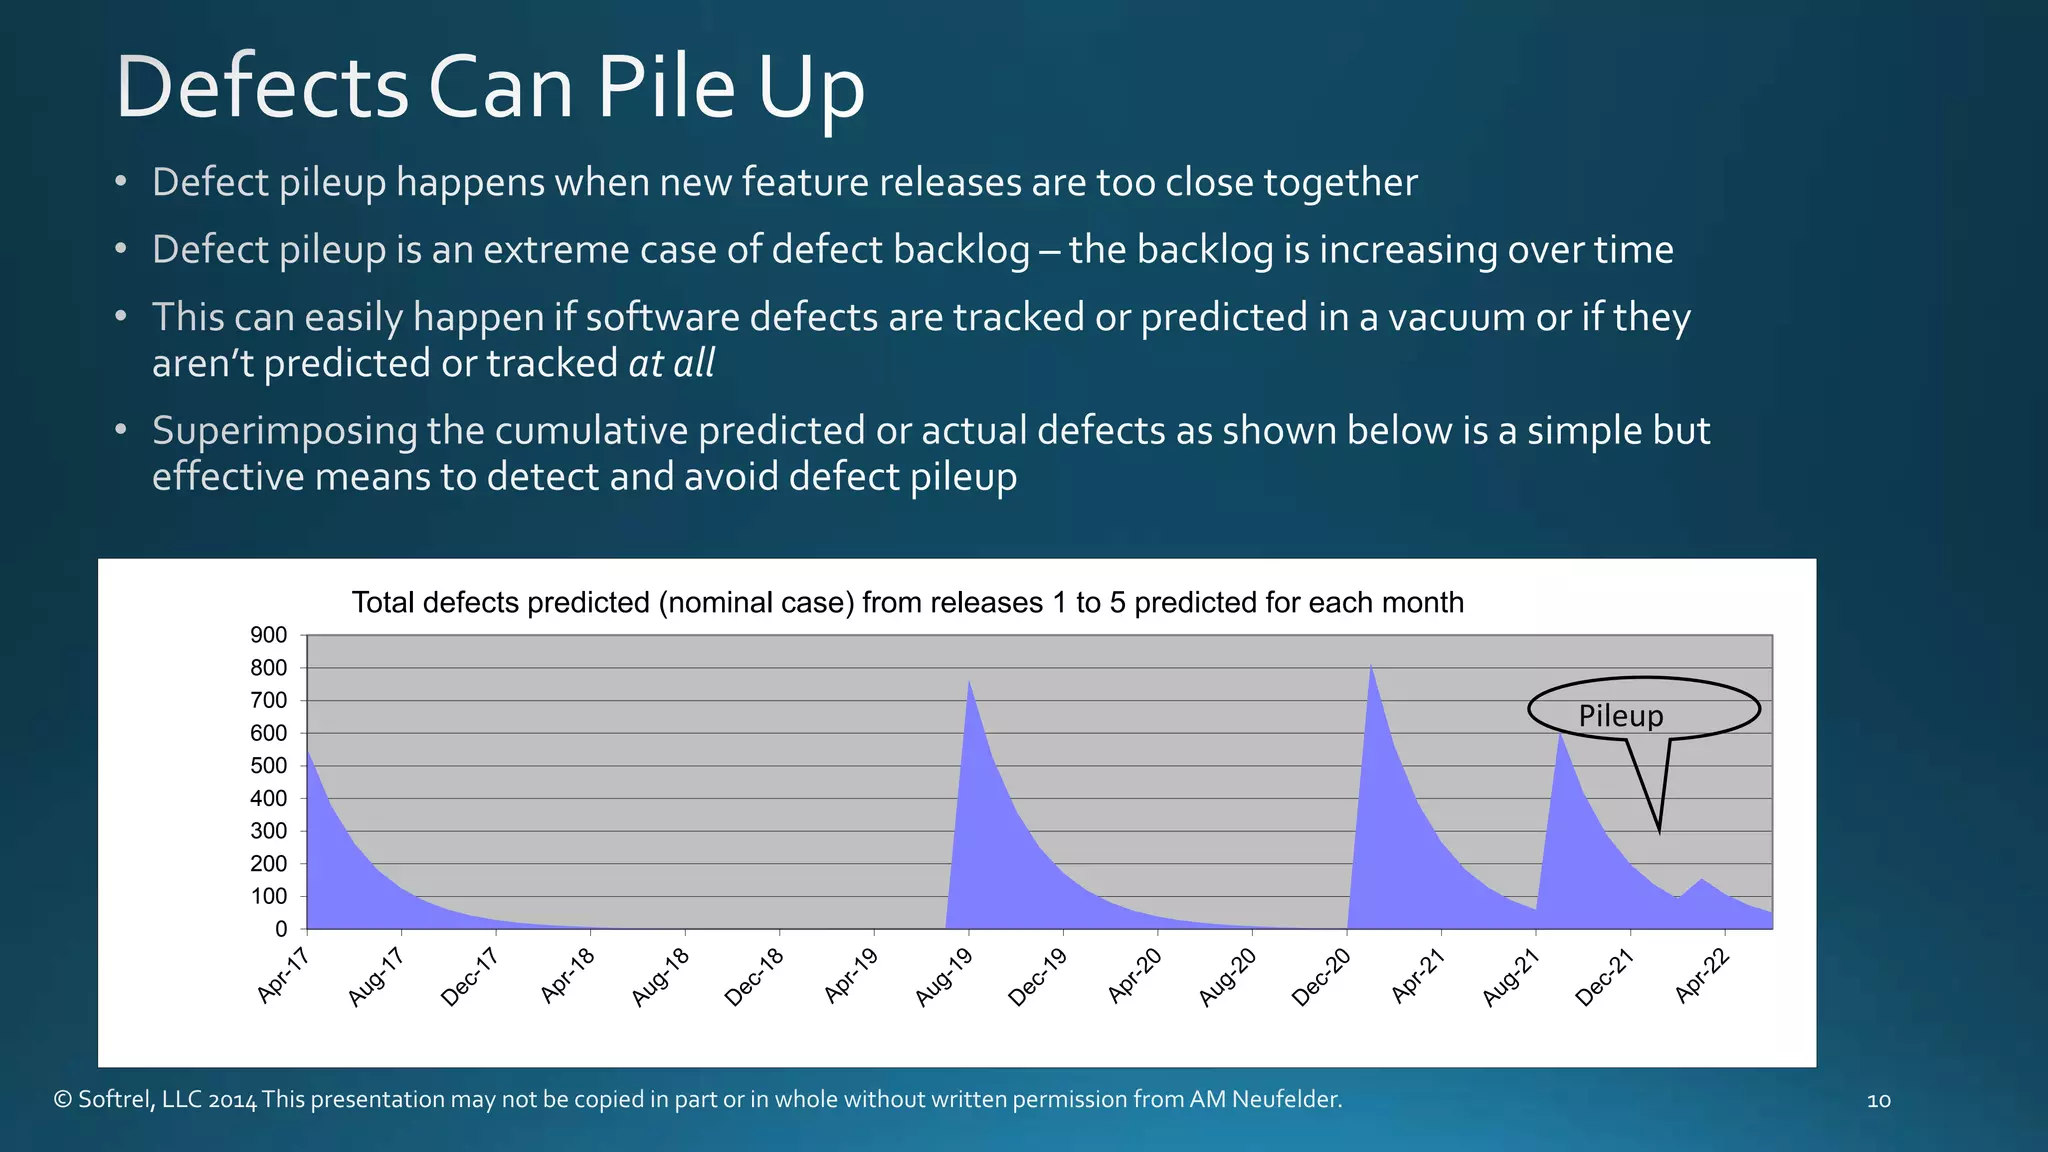
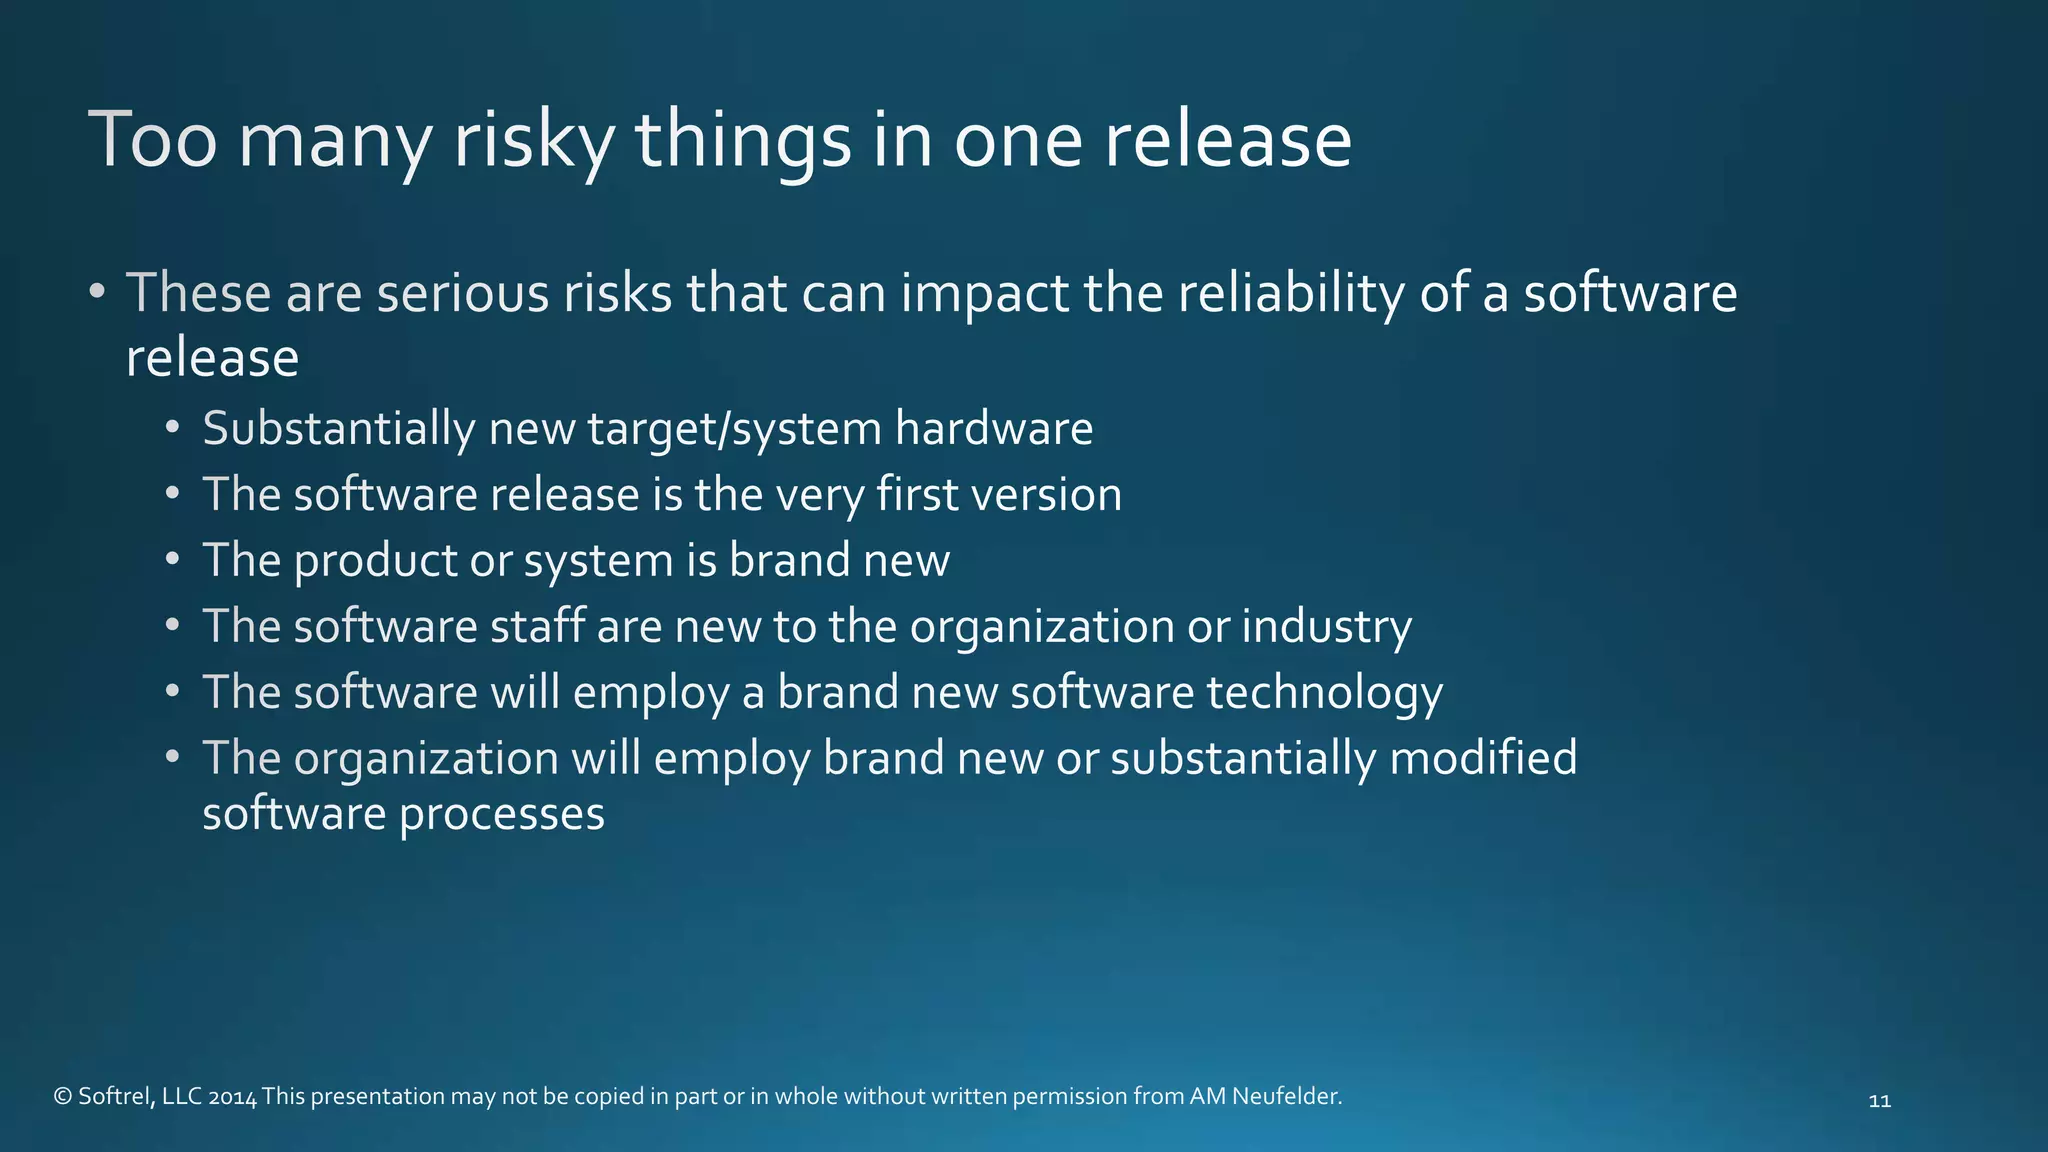
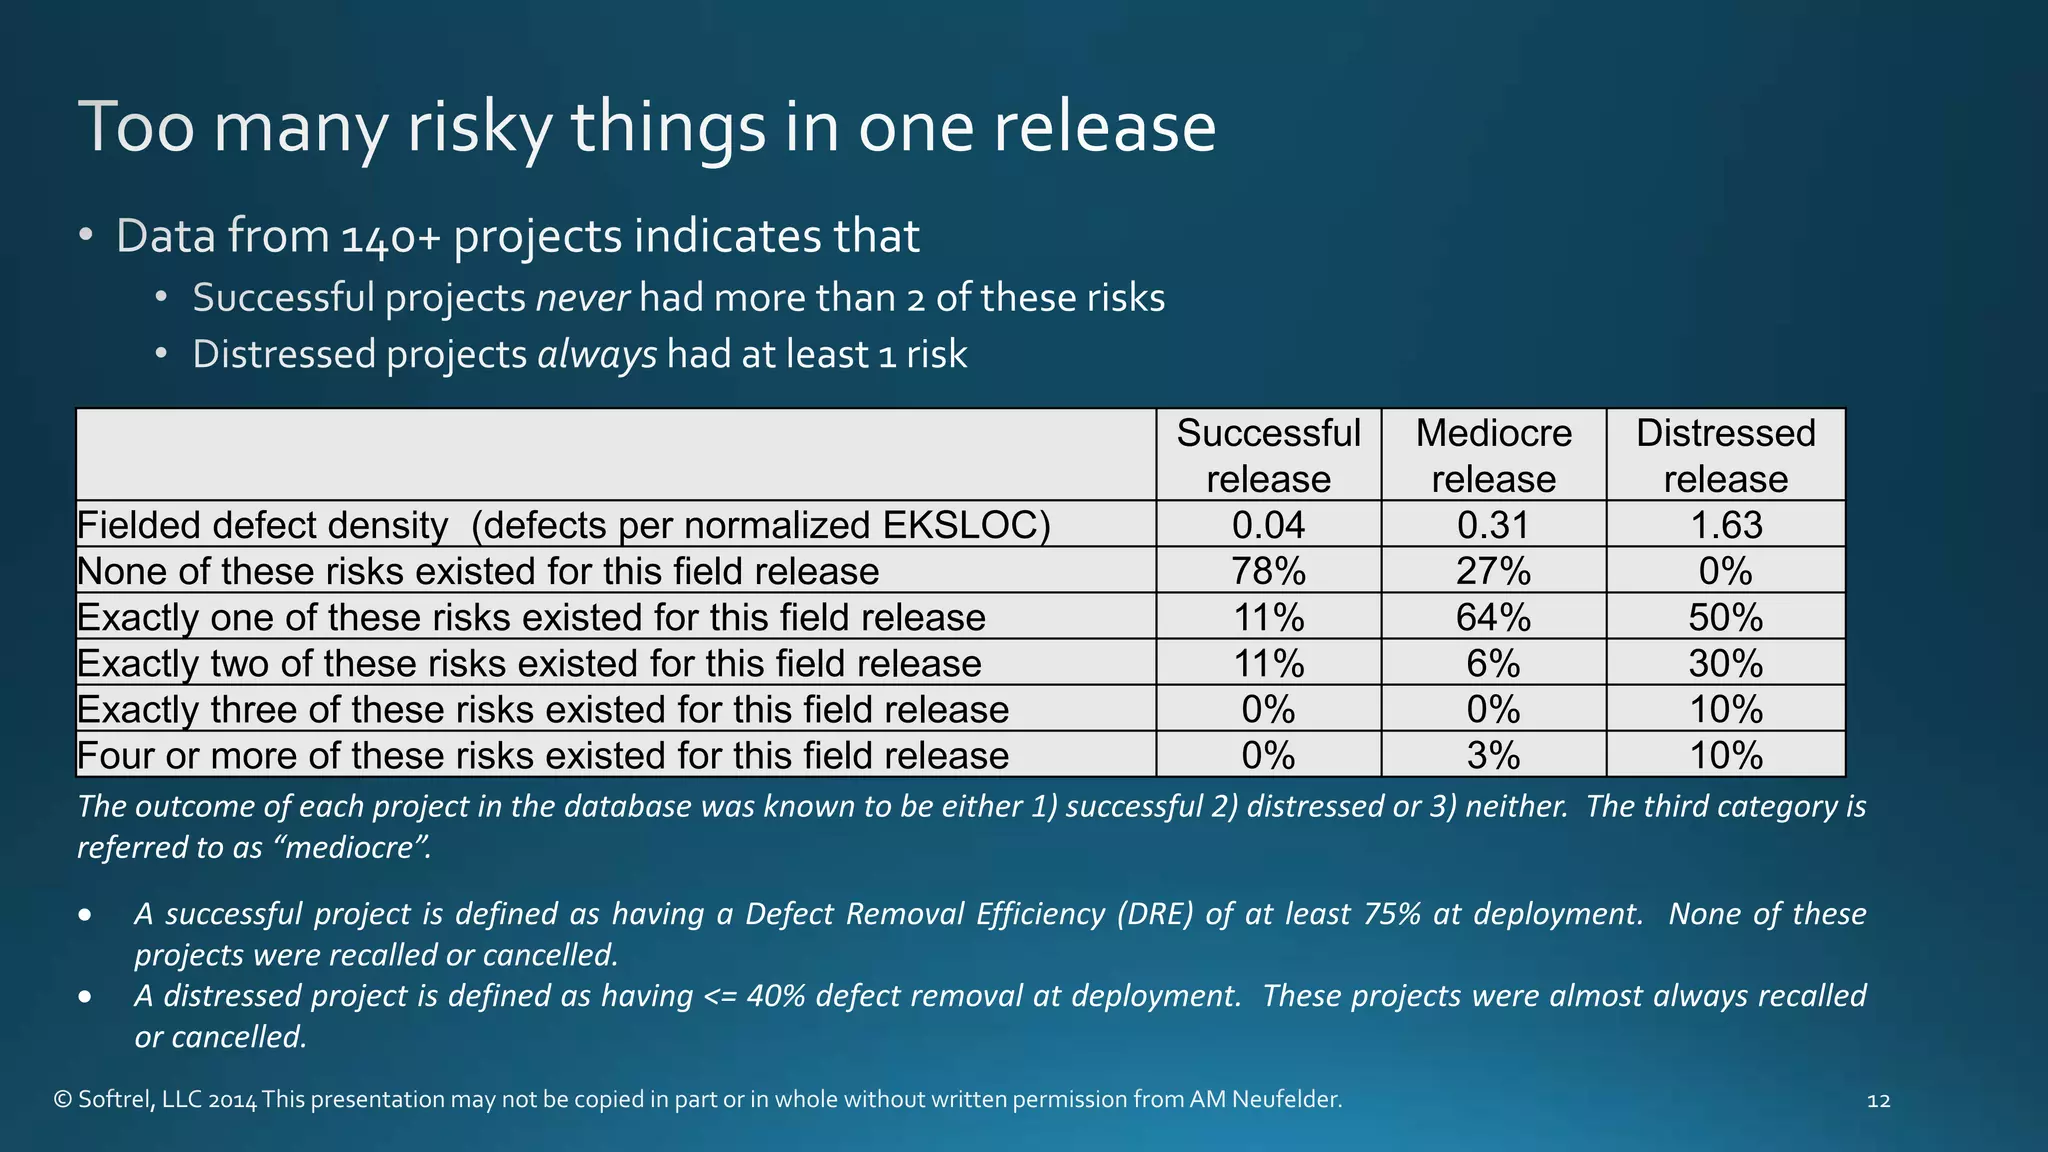
© Softrel, LLC 2014This presentation may not be copied in part or in whole without written permission from AM Neufelder.
more
Factor associated with
more reliable software
Examples
People Domain experience,Team sizes and organization, geographical location, contract
help versus employees, etc.
Processes Degree to which software activities are defined and repeated
Techniques Degree to which software engineers can develop software requirements, design,
code, test plans that are most likely to meet requirements with fewest defects
Tools Degree to which software organization can avoid tedious and repetitive tasks
less
Factor associated with less
reliable software
Description
Size is grossly underestimated Software size determines the schedule and the reliability prediction
Reliability growth is grossly
overestimated
Reliability growth is how long the software version is tested in a real
environment without added any new features
Defect Pileup What happens when software releases are spaced too close together
Too many risky things
happening in one software
release
Risky things: New target hardware, version 1 software, brand new
software staff, brand new software technology, brand new software
processes or environments
• Theoretically
• Double the size -> Double the software faults -> Double the failure rate
EKSLOC Effective size of software in 1000 source lines of code
DD Defect density – normalized operational defects per 1000 EKSLOC
F0 = EKSLOC * DD Initial number of faults/defects in the code at delivery
K Reliability growth constant related to number of deployed systems.
N0
e-kti
Number of faults/defects remaining in the code in the selected time
period ti
N0
e-kti-1 Number of faults/defects remaining in the previous time period
(Nti- Nti-1) Predicted software faults in between time i and i-1
(Nti- Nti-1)/ ti Predicted software failure rate at month ti
grossly
easily
• If any of these things is true, the reused code estimate is probably optimistic
non-linear
• Unless the software is at the end of its useful life it is virtually
guaranteed that reliability growth is limited
18281
204
0.000
10000.000
20000.000
30000.000
40000.000
50000.000
60000.000
70000.000
80000.000
0 10 20 30 40 50 60
Failureratepermillionhours
Months of reliability growth
λsw in failures per million hours
0
20
40
60
80
100
120
1 3 5 7 9 11 13 15 17 19 21 23 25 27 29 31 33 35 37 39 41 43 45 47
Failurerate
Months of customer usage
Expected versus actual growth
Expected growth
Growth when there are feature drops
0
100
200
300
400
500
600
700
800
900
Total defects predicted (nominal case) from releases 1 to 5 predicted for each month
Pileup
Successful
release
Mediocre
release
Distressed
release
Fielded defect density (defects per normalized EKSLOC) 0.04 0.31 1.63
None of these risks existed for this field release 78% 27% 0%
Exactly one of these risks existed for this field release 11% 64% 50%
Exactly two of these risks existed for this field release 11% 6% 30%
Exactly three of these risks existed for this field release 0% 0% 10%
Four or more of these risks existed for this field release 0% 3% 10%
The outcome of each project in the database was known to be either 1) successful 2) distressed or 3) neither. The third category is
referred to as “mediocre”.
 A successful project is defined as having a Defect Removal Efficiency (DRE) of at least 75% at deployment. None of these
projects were recalled or cancelled.
 A distressed project is defined as having <= 40% defect removal at deployment. These projects were almost always recalled
or cancelled.
to achieve success
how to avoid a distressed project
http://www.softrel.com/truth.htm
Software Reliability Toolkit training class Software Reliability toolkit
http://www.softrel.com/truth.htm
“GAO report number GAO-10-706T entitled 'defense
acquisitions: observations on weapon program performance and acquisition reforms' which
was released on may 19, 2010. Http://www.Gao.Gov/products/GAO-10-706T
"System and Software Reliability Assurance Notebook"

Four things that are almost guaranteed to reduce the reliability of a software intensive system

  • 1.
    © Softrel, LLC2014This presentation may not be copied in part or in whole without written permission from AM Neufelder.
  • 2.
    more Factor associated with morereliable software Examples People Domain experience,Team sizes and organization, geographical location, contract help versus employees, etc. Processes Degree to which software activities are defined and repeated Techniques Degree to which software engineers can develop software requirements, design, code, test plans that are most likely to meet requirements with fewest defects Tools Degree to which software organization can avoid tedious and repetitive tasks
  • 3.
    less Factor associated withless reliable software Description Size is grossly underestimated Software size determines the schedule and the reliability prediction Reliability growth is grossly overestimated Reliability growth is how long the software version is tested in a real environment without added any new features Defect Pileup What happens when software releases are spaced too close together Too many risky things happening in one software release Risky things: New target hardware, version 1 software, brand new software staff, brand new software technology, brand new software processes or environments
  • 4.
    • Theoretically • Doublethe size -> Double the software faults -> Double the failure rate EKSLOC Effective size of software in 1000 source lines of code DD Defect density – normalized operational defects per 1000 EKSLOC F0 = EKSLOC * DD Initial number of faults/defects in the code at delivery K Reliability growth constant related to number of deployed systems. N0 e-kti Number of faults/defects remaining in the code in the selected time period ti N0 e-kti-1 Number of faults/defects remaining in the previous time period (Nti- Nti-1) Predicted software faults in between time i and i-1 (Nti- Nti-1)/ ti Predicted software failure rate at month ti
  • 5.
  • 6.
    easily • If anyof these things is true, the reused code estimate is probably optimistic
  • 7.
    non-linear • Unless thesoftware is at the end of its useful life it is virtually guaranteed that reliability growth is limited
  • 8.
    18281 204 0.000 10000.000 20000.000 30000.000 40000.000 50000.000 60000.000 70000.000 80000.000 0 10 2030 40 50 60 Failureratepermillionhours Months of reliability growth λsw in failures per million hours
  • 9.
    0 20 40 60 80 100 120 1 3 57 9 11 13 15 17 19 21 23 25 27 29 31 33 35 37 39 41 43 45 47 Failurerate Months of customer usage Expected versus actual growth Expected growth Growth when there are feature drops
  • 10.
    0 100 200 300 400 500 600 700 800 900 Total defects predicted(nominal case) from releases 1 to 5 predicted for each month Pileup
  • 12.
    Successful release Mediocre release Distressed release Fielded defect density(defects per normalized EKSLOC) 0.04 0.31 1.63 None of these risks existed for this field release 78% 27% 0% Exactly one of these risks existed for this field release 11% 64% 50% Exactly two of these risks existed for this field release 11% 6% 30% Exactly three of these risks existed for this field release 0% 0% 10% Four or more of these risks existed for this field release 0% 3% 10% The outcome of each project in the database was known to be either 1) successful 2) distressed or 3) neither. The third category is referred to as “mediocre”.  A successful project is defined as having a Defect Removal Efficiency (DRE) of at least 75% at deployment. None of these projects were recalled or cancelled.  A distressed project is defined as having <= 40% defect removal at deployment. These projects were almost always recalled or cancelled.
  • 13.
    to achieve success howto avoid a distressed project http://www.softrel.com/truth.htm Software Reliability Toolkit training class Software Reliability toolkit
  • 14.
    http://www.softrel.com/truth.htm “GAO report numberGAO-10-706T entitled 'defense acquisitions: observations on weapon program performance and acquisition reforms' which was released on may 19, 2010. Http://www.Gao.Gov/products/GAO-10-706T "System and Software Reliability Assurance Notebook"