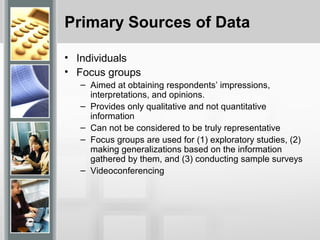
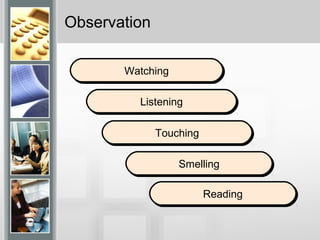
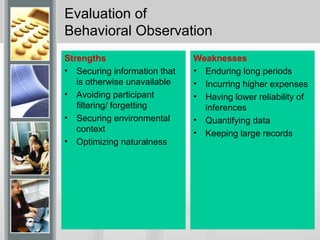
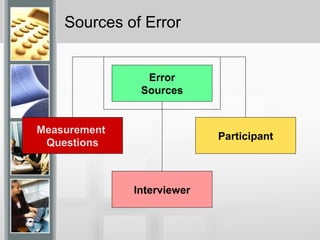
This document discusses various data collection methods and their pros and cons. It covers primary and secondary sources of data. Primary sources include individuals, focus groups, panels, and unobtrusive measures. Secondary sources include existing data that may be out of date or not fully applicable. Common data collection methods include observation, surveys using questionnaires or interviews, and unobtrusive methods. Considerations for each method include costs, reliability, and potential for bias. The document provides guidance on designing questionnaires, pretesting questions, and improving response rates.
US Department of Transportation (DOT) initiated a program to develop and test a 5.9GHz‐based Vehicle Infrastructure Integration (VII) proof of concept (POC). This report describes the overall approach undertaken to prove the VII concept through a structured testing program and describes the overall experimental design utilized, system architecture and the design of systems, subsystems, and components, as well as the public sector applications developed to prove some of the system concepts.
2. Sources of Data
• Primary sources
– Primary data refer to information obtained
firsthand by the researcher on the variables of
interest for the specific purposes of the study
• Secondary sources
– Secondary data refer to information gathered
from sources already existing
3. Primary Sources of Data
• Individuals
• Focus groups
– Aimed at obtaining respondents’ impressions,
interpretations, and opinions.
– Provides only qualitative and not quantitative
information
– Can not be considered to be truly representative
– Focus groups are used for (1) exploratory studies, (2)
making generalizations based on the information
gathered by them, and (3) conducting sample surveys
– Videoconferencing
4. Primary Sources of Data Cont’d)
• Panels
– Whereas focus groups meet for a one-time
group session, panels meet more than once.
– Static or dynamic
– Typically used when several aspects of a
product are to be studied from time to time
• Unobtrusive Measures
– Originate from a primary source that does not
involve people
5. Secondary Sources
• Advantage of seeking secondary data
sources is savings in time and costs of
acquiring information.
• Drawbacks: obsolete, not meeting the
specific needs of a particular situation or
setting
9. Evaluation of
Behavioral Observation
Strengths
• Securing information that
is otherwise unavailable
• Avoiding participant
filtering/ forgetting
• Securing environmental
context
• Optimizing naturalness
Weaknesses
• Enduring long periods
• Incurring higher expenses
• Having lower reliability of
inferences
• Quantifying data
• Keeping large records
10. Interviewing
• Unstructured interviews
– Interviewer does not enter the interview setting
with a planned sequences of questions to be
asked of the respondent
– The objective: to bring some preliminary
issues to the surface so that the researcher
can determine what variables need further in-
depth investigation
11. Interviewing (Cont’d)
• Structured interviews
– Those conducted when it is known at the
outset what information is needed.
– The interviewer has a list of predetermined
questions to be asked of the respondents
12. Advantages of the Telephone Survey
• Lower costs than
personal interview
• Expanded geographic
coverage
• Use of few
interviewers
• Reduced interviewer
bias
• Fast completion time
• Better access to some
participants
• Random dialing
possible
• CATI possible
13. Disadvantages of the Telephone
Survey
• Lower response rate
than personal
interview
• Higher costs if
interviewing
geographically
dispersed sample
• Interview length
limited
• Unlisted phone
numbers/ Call
screening
• Some unavailable by
phone
• Unit-nonresponse
• Lack of visuals
14. Personal Survey
Advantages
• Good cooperation rates
• Interviewer can probe and
explain
• Visual aids possible
• Illiterate participants can
be reached
• Interviewer can prescreen
• CAPI possible
Disadvantages
• High costs
• Need for highly trained
interviewers
• Time consuming
• Labor-intensive
• Some unwilling to invite
strangers into homes
• Interviewer bias possible
16. Interviewing (Cont’d)
• Can be minimized:
– Establishing credibility and rapport, and
motivating individuals to respond
– Questioning techniques: funneling, unbiased
questions, clarifying issues, helping the
respondents to think through issues, taking
notes
17. Face-to-face Interviews
• Advantages:
– Adapt the questions as necessary, clarify doubts, and
ensure that the responses are properly understood
– Pick up nonverbal cues from the respondent
– Any discomfort, stress, or problems that the respondent
experiences can be detected
• Disadvantages:
– Geographical limitations
– Vast resources needed
– High costs
– Respondents might feel uneasy about the anonymity of their
responses
18. Telephone Interviews
• Advantages:
– A number of differently different people can be
reached in a relatively short period of time
– It would eliminate any discomfort on
respondents
• Disadvantages:
– Respondents could unilaterally terminate the
interview without warning or explanation, by
hanging up the phone.
– Researcher will not be able to read the
nonverbal communication
19. Advantages of
Self-Administered Questionnaires
• Allows contact with
inaccessible
participants
• Incentives increase
response rates
• Lowest-cost option
• Geographic coverage
• Minimal staff required
• Perceived as
anonymous
• Allows participants
time for reflection
• Allows for complex
questions
• Rapid data collection
possible
• Visuals possible
• Multiple sampling
frames possible
20. Disadvantages of
Self-Administered Questionnaires
• Low response rates in
some modes
• No interviewer
intervention
• Cannot be too long
• Cannot be too
complex
• Requires accurate list
• Skewed responses by
extremists
• Participant anxiety
possible
• Directions necessary
• Need for low-
distraction
environment
• Computer security
21. Questionnaires (Cont’d)
• Guidelines for questionnaires design
– Principles of wording
• Content and the purpose of the questions
• Language and wording of the questionnaires
• Type and form of questions
• Sequencing of questions
– Classification data or personal information
22. Questionnaires (Cont’d)
• Pretesting of Structured Questions
– To ensure that the questions are understood
by the respondents
– There are no problems with the wording or
measurement
23. Improving Response Rates
• Advance notification
• Reminders
• Return directions and devices
• Monetary incentives
• Deadlines
• Promise of anonymity
• Appeal for participation
Editor's Notes
Besides collecting data visually, observation involves listening, reading, smelling, and touching. Exhibit 9-2 describes the conditions under which observation is appropriate and this exhibit is provided on the following slide.
This slide lists the strengths and limitations of observation as a data collection method. Observation is the only method available for gathering certain types of information. Another advantage is that it can capture the whole event as it occurs in its natural environment. Observation participants seem to accept an observational intrusion better than they respond to the intrusion of survey takers. Further, some observation studies are concealed
A key limitation of observation is that it records what, where, who, and how, but cannot record why people behave as they do. Observation is slow and expensive. Observation may be factual or inferential. It is most reliable when it is based on fact. Exhibit 9-4, shown on the next slide, shows how we can separate the factual and inferential component of a salesperson’s presentation.
While data collection using the telephone has many advantages, there are also disadvantages. This slide lists many of the disadvantages.
Approximately 94% of all US households have access to telephone service. However, households with incomes below the poverty line remain underrepresented with phone access below 75%. Also, more households are using filtering devices like caller ID, and Tele-Zapper. Random dialing is designed to reduce some of the bias caused by participant availability issues.
Random dialing also limits the problem with inaccurate numbers.
Ten minutes is generally thought of as the ideal length for telephone interviews, but interviews of 20 minutes is not uncommon.
The telephone limits the complexity of the survey and the use of complex scales or measurement techniques that is possible with personal interviewing.
Participants find it easy to terminate a phone interview. Telemarketing practices may be one reason for this.
The environment in which one answers a phone survey varies given that many people use cellular phones, wireless phones, and office phones. Data quality and refusal rates could be affected these distracting circumstances.
There are three major sources of error in communication research: measurement questions and survey instruments, interviewers, and participants.
Researchers cannot help a business decision maker answer a research question if they 1) select or craft inappropriate questions, 2) ask them in inappropriate order, or 3) use inappropriate transitions and instructions to elicit information. Chapters 12, 13, and 14, will cover ways to avoid these sources of error.
Interviewer error is error that results from interviewer influence of the participant. It can be caused by several actions such as 1) failure to secure full participant cooperation, 2) failure to record answers accurately and completely, 3) failure to consistently execute interview procedures, 4) failure to establish appropriate interview environment, 5) falsification of answers, 6) inappropriate influencing behavior, and 7) physical presence bias.
Participants cause error in two ways: whether they respond (willingness) and how they respond.
Three factors influence participant participation:
The participant must believe that the experience will be pleasant and satisfying.
The participant must believe that answering the survey is worthwhile.
The participant must dismiss any mental reservations about participation.
Exhibit 10-5 presents a comparison of communication approaches. The advantages and disadvantages for each mode are presented on the next several slides.
Drawn from Exhibit 10-5.
More than 200 articles have been published on methods for improving response rates to surveys. This slide lists several practical suggestions. Deadlines do not increase response rates overall but do encourage respondents to respond sooner. The promise of anonymity also does not increase response rates but is important to those who do respond. All the other suggestions do result in increases in response rates.