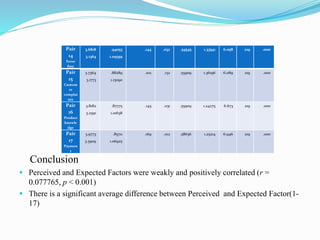
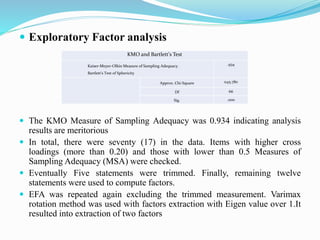
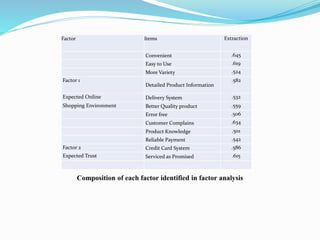
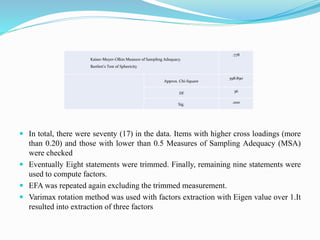
Presented By:
Jay Prajapati
MBA(MM)
CMS-Ahmedabad.
Guided By:
Dr Rachita Jayswal
CMS-Ahmedabad
Content
 Introduction of online shopping
 Introduction of Flipkart.com
 Objectives
 Research Methodology
 Data Analysis & Interpretation
 Findings & Discussion
 Recommendations
Introduction of Online Shopping
 Online shopping has become a popular shopping method ever since the internet has
declared a takeover
 Online shopping is a form of electronic commerce which allows consumers to
directly buy goods or services from a seller over the Internet using a web browser.
 There are many advantages of online shopping; this is the reason why online stores
are a booming business today.
 Consumers can buy a huge variety of items from online stores, and just about
anything can be purchased from companies that provide their products online.
 Books, clothing, household appliances, toys, hardware, software, and health
insurance are just some of the hundreds of products consumers can buy from an
online store.
 History of online shopping
 English entrepreneur Micheal Aldrich invented online shopping in 1979 .
 The first World Wide Web server and browser, created by Tim Berners-Lee
in 1990, opened for commercial use in 1991.
 The first secure retail transaction over the Web was either by NetMarket
or Internet Shopping Network in 1994.
 Amazon.com launched its online shopping site in 1995 and eBay was also
introduced in 1995. Alibaba’s sites Taobao and Tmall were launched in 2003
and 2008, respectively.
 History of online shopping in India
 India had an internet user base of about 354 million as of June 2015 and is
expected to cross 500 million in 2016. Despite being the second-largest user
base in world, only behind china.
 In India, cash on delivery is the most preferred payment method,
accumulating 75% of the e-retail activities.
 Demand for international consumer products is growing much faster than
in-country supply from authorized distributors and e-commerce offerings
 1991: Introduction of E-Commerce.
 2002: IRCTC teaches India to Book ticket online.
 2003: Introduction of Low Cost Airline with AirDeccan.
 2007: The Deep Discounted model of Flipkart.com
Players in India
 Flipkart
 Amazon
 Snapdeal
Others:
 PayTM
 Jabong
 Ebay
 Shopclues
 MakeMyTrip
 AskmeBazaar
 Goibibo
Flipkart
 Flipkart is an e-commerce company founded in 2007 by Sachin
Bansal and Binny Bansal.
 The company is registered in Singapore, but has its headquarters
in Bangalore, Karnataka, India.
 Flipkart has launched its own product range under the name "DigiFlip" with
products including tablets, USBs, and laptop bags.
 Flipkart's last fundraising round in May 2015 had pegged its valuation at
$15 billion. In May 2016, Morgan Stanley lowers Flipkart's valuation at
$9.39 billion
 Flipkart now employs more than 33,000 people.
 Flipkart allows payment methods such as cash on
delivery, credit or debit card transactions, net banking, e-gift voucher and
card swipe on delivery.
Objectives
 To analyze how Gender effects on online shopping in Flipkart.
 To analyze how Age effects on online shopping in Flipkart.
 To analyze how much difference there between Expected and
Perceived Variables.
 To find what the major factors are affects on online shopping
experience Flipkart.
 To know the impact of factors towards online shopping experience of
Flipkart.
Research Methodology
 Research Design : Conclusive
 Sampling design:
(a) Target population definition
Target population:
All customers of Flipkart.com
Sampling unit:
A customer of Flipkart.com
Sampling element:
A customer of Flipkart.com
Extent:
Ahmedabad, Gujarat
(b) Sampling method:
Non-probability sampling:
Convenience sampling
(c) Sample size determination:
220 Questionnaires
 Scale: Likert Scale
 Questionnaires design:
Question type:
Structure questionnaire
Structured question types:
Scaling, Multiple choice questions
Pre-testing of questionnaires:
It will be done with 10 respondents
 Data analysis software: SPSS
 Data analysis techniques:Frequency distribution, Chi-
square, Paired Samples T-test, Exploratory Factor
analysis, Multiple Regression Test
 Data collection tools: Questionnaire
 Data collection method: Survey, personal
Data Analysis & Interpretation
 Frequency
 Crosstabs Analysis
H1: Male Consumers spend more time in surfing the web than female consumers.
Time spend Gender Crosstabulation
Gender Total
Male Female
Time spend
0-5 hours 42 29 71
6-10 hours 45 28 73
11-15 hours 34 15 49
16-20 hours 6 6 12
More than 20 hours
13 2 15
Total 140 80 220
 Chi-square Test
• *p=0.10
Conclusion
 As the significance value is less than 0.10, we can say that alternate hyposethsis is
accepted i.e. “Male Consumers spend more time in surfing the web than female
consumers”.
 After doing crosstabs analysis with Chi Square method we concluded that 13 out of
15 are males who’s using internet more than 20 hours and only 2 female consumers
are using more than 20 hours.
 There are same numbers of Male and Female consumers that spend 16-20 hours. But
Male consumers which uses 6-15 hours are more in numbers than female consumers
so its proved that male consumers uses more internet than females.
Value Sig. (2-sided)
Pearson Chi-Square 6.374a .095*
Likelihood Ratio 8.321 .040
Linear-by-Linear
Association
.221 .638
How Often Use Flipkart Age Crosstabulation
Age Total
15-25 26-35 36-45 above 45
How Often Use
Flipkart
Daily 14 14 8 1 37
Weekly 41 33 24 12 110
Monthly 28 19 12 7 66
Yearly 5 1 0 1 7
Total 88 67 44 21 220
H2: Young age Consumers use Flipkart regularly than Old age Consumers
Chi-Square Table
*p=0.05
Conclusion
 As the significance value is more than 0.05; so we null hypothesis is accepted.
 Here we analyzed Age with How often use of flipkart with crosstabulation method
and we have concluded that Consumers with age 15-35 use Daily or Weekly online
shopping and in 36 or above age consumers use less time.
Value Sig. (2-sided)
Pearson Chi-Square 7.416 .594*
Likelihood Ratio 9.279 .412
Linear-by-Linear
Association
.108 .743
 Paired Samples T-Test
Reliability Statistics of constructs
Variable Number of Variables Cronbach’s Alpha
Expectation 17 0.876
Perception
17 0.863
Pair of Expectation
&
Perception
34 0.830
 Hypothesis-There is Significant difference between perception of Factor
and expectation of Factor at online shopping in Flipkart.
 Here total number of factors is 17.
Paired samples
Statistics
Paired samples
Correlations
Paired samples Test
Mean Std.
Deviation
Correlatio
ns
Sig. Mean Std.
Deviatio
n
t df Sig. (2-
tailed)
Pair 1
Conveni
ence
3.7409
2.8818
.91719
1.14463
-.042 .532 .85909 1.49677 8.513 219 .000
Pair 2
Easy to
use
3.9182
3.3136
.88242
1.01891
.151 .026 .60455 1.24342 7.211 219 .000
Pair 3
Discoun
t
3.8500
3.1727
.91174
1.03685
.057 .404 .67727 1.34145 7.489 219 .000
Pair 4
Save
time
3.9680
3.5205
.91565
2.97440
.067 .325 .44749 3.05316 2.169 218 .031
Pair 5
More
variety
3.8227
3.3273
.97476
1.04343
.170 .012 .49545 1.30155 5.646 219 .000
Pair 6
Detailed
informa
tion
3.8045
3.3591
.85634
1.09092
.173 .010 .44545 1.26481 5.224 219 .000
Pair 7
Deliver
y
system
3.8091
3.3864
.87581
1.11887
.024 .719 .42273 1.40398 4.466 219 .000
Pair 8
Return
policy
3.6545
3.2500
.94542
1.06254
-.068 .314 .40455 1.46962 4.083 219 .000
Pair 9
Credit-
card
Detail
3.4864
2.9182
1.04458
1.07382
.129 .056 .56818 1.39794 6.029 219 .000
Pair
10
Security
of
Paymen
t
3.7580
3.2283
.92412
1.09750
.050 .460 .52968 1.39882 5.604 218 .000
Pair
11
Better
quality
3.6636
3.2136
.87874
1.09750
.047 .489 .45000 1.36568 4.887 219 .000
Pair
12
Service
3.8818
3.4273
.84109
2.19987
.032 .633 .45455 2.32962 2.894 219 .004
Pair
13
Mercha
ndise
availabl
e
3.6727
3.1636
.91770
.93660
-.028 .683 .50909 1.32930 5.680 219 .000
Pair
14
Error
free
3.6818
3.1364
.94053
1.09359
.144 .032 .54545 1.33541 6.058 219 .000
Pair
15
Custom
er
complai
nts
3.7364
3.1773
.88289
1.13090
.102 .132 .55909 1.36196 6.089 219 .000
Pair
16
Product
knowle
dge
3.8182
3.2591
.87775
1.01638
.145 .031 .55909 1.24275 6.673 219 .000
Pair
17
Paymen
t
3.9773
3.3909
.85711
1.06925
.169 .012 .58636 1.25214 6.946 219 .000
Conclusion
 Perceived and Expected Factors were weakly and positively correlated (r =
0.077765, p < 0.001)
 There is a significant average difference between Perceived and Expected Factor(1-
17)
Pair
14
Error
free
3.6818
3.1364
.94053
1.09359
.144 .032 .54545 1.33541 6.058 219 .000
Pair
15
Custom
er
complai
nts
3.7364
3.1773
.88289
1.13090
.102 .132 .55909 1.36196 6.089 219 .000
Pair
16
Product
knowle
dge
3.8182
3.2591
.87775
1.01638
.145 .031 .55909 1.24275 6.673 219 .000
Pair
17
Paymen
t
3.9773
3.3909
.85711
1.06925
.169 .012 .58636 1.25214 6.946 219 .000
 Exploratory Factor analysis
 The KMO Measure of Sampling Adequacy was 0.934 indicating analysis
results are meritorious
 In total, there were seventy (17) in the data. Items with higher cross
loadings (more than 0.20) and those with lower than 0.5 Measures of
Sampling Adequacy (MSA) were checked.
 Eventually Five statements were trimmed. Finally, remaining twelve
statements were used to compute factors.
 EFA was repeated again excluding the trimmed measurement. Varimax
rotation method was used with factors extraction with Eigen value over 1.It
resulted into extraction of two factors
KMO and Bartlett's Test
Kaiser-Meyer-Olkin Measure of Sampling Adequacy.
Bartlett's Test of Sphericity
.934
Approx. Chi-Square 1145.780
Df 66
Sig. .000
Composition of each factor identified in factor analysis
Factor Items Extraction
Convenient .645
Easy to Use .619
More Variety .524
Factor 1
Detailed Product Information
.582
Expected Online Delivery System .532
Shopping Environment Better Quality product .559
Error free .506
Customer Complains .634
Product Knowledge .501
Reliable Payment .542
Factor 2 Credit Card System .586
Expected Trust Serviced as Promised .615
 In total, there were seventy (17) in the data. Items with higher cross loadings (more
than 0.20) and those with lower than 0.5 Measures of Sampling Adequacy (MSA)
were checked
 Eventually Eight statements were trimmed. Finally, remaining nine statements were
used to compute factors.
 EFA was repeated again excluding the trimmed measurement.
 Varimax rotation method was used with factors extraction with Eigen value over 1.It
resulted into extraction of three factors
Kaiser-Meyer-Olkin Measure of Sampling Adequacy.
Bartlett's Test of Sphericity
.778
Approx. Chi-Square
398.890
Df 36
Sig. .000
Composition of each factor identified in factor analysis
Factors Items Extraction
Return Policy
.658
Factor 1
Security of Payment
.508
Perceived Reputation
Product Knowledge
.561
Reliable Payment
.655
Factor 2
Convenient
.618
Perceived Ease of use
Easy to Use
.622
Discount
.567
Factor 3
Credit Card System
.604
Perceived Risk
Better Quality product
.573
Regression
 Hypothesis-Customer’s expected online shopping environment, expected trust,
perceived reputation, perceived ease of use, perceived risk has significant influence
over his/her overall online shopping experience on Flipkart
Factor Mean Std. Deviation
Online shopping Experience 3.8636 .85983
Exp_OnlineShop_Env 3.2445 .80734
Exp_Trust 3.1727 1.23206
Per_Reputation 3.8023 .64691
Per_Ease_of_use 3.8295 .76855
Per_Risk 3.6667 .69498
Variables
Online Shopping Experience
Ba Bb T Sig. VIF
Exp_OnlineShop_Env
-.131 -.123 -1.949 .053 1.254
Exp_Trust .010 .015 .234 .815 1.213
Per_Reputation .353 .266 4.047 .000 1.347
Per_Ease_of_use .260 .233 3.655 .000 1.268
Per_Risk .249 .201 3.086 .002 1.332
Variables Values
R .562
R Square .316
Adjusted R Square .300
Std.Error .71945
F 19.760
Sig, Level .000
Findings & Discussion
FINDINGS
 In this study we have found that male consumers are using more online shopping
than female consumers. It is may be because in India Men use more internet than
Women but mobile users are almost same in numbers.
 Old age consumers don’t shop online much according to this study compares to
Young age consumers. Internet shopping is more popular since 2007, so new
generation is likely to use internet more and do shop online but for old age people its
very difficult to shop online shopping because its new for them.
 There is minor significance difference between consumers perceived and expected
service which is positive. Four factors: Expected Trust, Perceived Reputation,
Perceived Ease of Use , Perceived risk has positive impact on overall online
shopping experience while Expected Online shopping Environment has negative
impact on it.
 Expected online shopping environment, expected trust, perceived reputation,
perceived ease of use and perceived risk factors have 31%. It is less than half of the
total influence on overall online shopping experience. These factors are likely to
find overall experience
Findings & Discussion
DISCUSSION
 This study tried to examine the impact of Expected and Perceived
Factors on overall shopping in Flipkart. In addition, It also attempted
to find Expected and Perceived Factors attitude towards customer’s
overall experience in shopping in Flipkart.
 Here after result we have found that four out of five factors have
positive influence on overall online shopping in Flipkart.
 Highest Number of positive influence is by Perceived Reputation on
online shopping in Flipkart which is 0.266.
 Lowest Number of positive influence is by Expected Trust on online
shopping in Flipkart which is 0.15.
 Only one Factors influence negatively towards online shopping in
Flipkart which is Expected online shopping Environment valued -
0.19.
 Perceived Ease of use and Perceived Risk are factors which
influence positively towards online shopping in Flipkart valued
2.666 and 2.333 accordingly
Recommendation
 Flipkart should provide more awareness to female consumers like work on
advertisement; arrange some public awareness programs, etc.
 Make design of site very easy and simple so that they can use them without
difficulty.
 Flipkart can do some work on conveniences, ease of use, reliable payment
method and discount that consumer expecting high level of services and
perceived low level of services.
 There are other factors that not included in this study can be studied by
some other methods which effects very much on online shopping in Flipkart
Flipkart Presentation - Jay Prajapati

Flipkart Presentation - Jay Prajapati

  • 1.
  • 2.
    Content  Introduction ofonline shopping  Introduction of Flipkart.com  Objectives  Research Methodology  Data Analysis & Interpretation  Findings & Discussion  Recommendations
  • 3.
    Introduction of OnlineShopping  Online shopping has become a popular shopping method ever since the internet has declared a takeover  Online shopping is a form of electronic commerce which allows consumers to directly buy goods or services from a seller over the Internet using a web browser.  There are many advantages of online shopping; this is the reason why online stores are a booming business today.  Consumers can buy a huge variety of items from online stores, and just about anything can be purchased from companies that provide their products online.  Books, clothing, household appliances, toys, hardware, software, and health insurance are just some of the hundreds of products consumers can buy from an online store.
  • 4.
     History ofonline shopping  English entrepreneur Micheal Aldrich invented online shopping in 1979 .  The first World Wide Web server and browser, created by Tim Berners-Lee in 1990, opened for commercial use in 1991.  The first secure retail transaction over the Web was either by NetMarket or Internet Shopping Network in 1994.  Amazon.com launched its online shopping site in 1995 and eBay was also introduced in 1995. Alibaba’s sites Taobao and Tmall were launched in 2003 and 2008, respectively.
  • 5.
     History ofonline shopping in India  India had an internet user base of about 354 million as of June 2015 and is expected to cross 500 million in 2016. Despite being the second-largest user base in world, only behind china.  In India, cash on delivery is the most preferred payment method, accumulating 75% of the e-retail activities.  Demand for international consumer products is growing much faster than in-country supply from authorized distributors and e-commerce offerings
  • 6.
     1991: Introductionof E-Commerce.  2002: IRCTC teaches India to Book ticket online.  2003: Introduction of Low Cost Airline with AirDeccan.  2007: The Deep Discounted model of Flipkart.com
  • 7.
    Players in India Flipkart  Amazon  Snapdeal Others:  PayTM  Jabong  Ebay  Shopclues  MakeMyTrip  AskmeBazaar  Goibibo
  • 8.
    Flipkart  Flipkart isan e-commerce company founded in 2007 by Sachin Bansal and Binny Bansal.  The company is registered in Singapore, but has its headquarters in Bangalore, Karnataka, India.  Flipkart has launched its own product range under the name "DigiFlip" with products including tablets, USBs, and laptop bags.  Flipkart's last fundraising round in May 2015 had pegged its valuation at $15 billion. In May 2016, Morgan Stanley lowers Flipkart's valuation at $9.39 billion
  • 9.
     Flipkart nowemploys more than 33,000 people.  Flipkart allows payment methods such as cash on delivery, credit or debit card transactions, net banking, e-gift voucher and card swipe on delivery.
  • 10.
    Objectives  To analyzehow Gender effects on online shopping in Flipkart.  To analyze how Age effects on online shopping in Flipkart.  To analyze how much difference there between Expected and Perceived Variables.  To find what the major factors are affects on online shopping experience Flipkart.  To know the impact of factors towards online shopping experience of Flipkart.
  • 11.
    Research Methodology  ResearchDesign : Conclusive  Sampling design: (a) Target population definition Target population: All customers of Flipkart.com Sampling unit: A customer of Flipkart.com Sampling element: A customer of Flipkart.com Extent: Ahmedabad, Gujarat
  • 12.
    (b) Sampling method: Non-probabilitysampling: Convenience sampling (c) Sample size determination: 220 Questionnaires  Scale: Likert Scale  Questionnaires design: Question type: Structure questionnaire
  • 13.
    Structured question types: Scaling,Multiple choice questions Pre-testing of questionnaires: It will be done with 10 respondents  Data analysis software: SPSS  Data analysis techniques:Frequency distribution, Chi- square, Paired Samples T-test, Exploratory Factor analysis, Multiple Regression Test  Data collection tools: Questionnaire  Data collection method: Survey, personal
  • 14.
    Data Analysis &Interpretation  Frequency
  • 15.
     Crosstabs Analysis H1:Male Consumers spend more time in surfing the web than female consumers. Time spend Gender Crosstabulation Gender Total Male Female Time spend 0-5 hours 42 29 71 6-10 hours 45 28 73 11-15 hours 34 15 49 16-20 hours 6 6 12 More than 20 hours 13 2 15 Total 140 80 220
  • 16.
     Chi-square Test •*p=0.10 Conclusion  As the significance value is less than 0.10, we can say that alternate hyposethsis is accepted i.e. “Male Consumers spend more time in surfing the web than female consumers”.  After doing crosstabs analysis with Chi Square method we concluded that 13 out of 15 are males who’s using internet more than 20 hours and only 2 female consumers are using more than 20 hours.  There are same numbers of Male and Female consumers that spend 16-20 hours. But Male consumers which uses 6-15 hours are more in numbers than female consumers so its proved that male consumers uses more internet than females. Value Sig. (2-sided) Pearson Chi-Square 6.374a .095* Likelihood Ratio 8.321 .040 Linear-by-Linear Association .221 .638
  • 17.
    How Often UseFlipkart Age Crosstabulation Age Total 15-25 26-35 36-45 above 45 How Often Use Flipkart Daily 14 14 8 1 37 Weekly 41 33 24 12 110 Monthly 28 19 12 7 66 Yearly 5 1 0 1 7 Total 88 67 44 21 220 H2: Young age Consumers use Flipkart regularly than Old age Consumers
  • 18.
    Chi-Square Table *p=0.05 Conclusion  Asthe significance value is more than 0.05; so we null hypothesis is accepted.  Here we analyzed Age with How often use of flipkart with crosstabulation method and we have concluded that Consumers with age 15-35 use Daily or Weekly online shopping and in 36 or above age consumers use less time. Value Sig. (2-sided) Pearson Chi-Square 7.416 .594* Likelihood Ratio 9.279 .412 Linear-by-Linear Association .108 .743
  • 19.
     Paired SamplesT-Test Reliability Statistics of constructs Variable Number of Variables Cronbach’s Alpha Expectation 17 0.876 Perception 17 0.863 Pair of Expectation & Perception 34 0.830
  • 20.
     Hypothesis-There isSignificant difference between perception of Factor and expectation of Factor at online shopping in Flipkart.  Here total number of factors is 17. Paired samples Statistics Paired samples Correlations Paired samples Test Mean Std. Deviation Correlatio ns Sig. Mean Std. Deviatio n t df Sig. (2- tailed) Pair 1 Conveni ence 3.7409 2.8818 .91719 1.14463 -.042 .532 .85909 1.49677 8.513 219 .000 Pair 2 Easy to use 3.9182 3.3136 .88242 1.01891 .151 .026 .60455 1.24342 7.211 219 .000 Pair 3 Discoun t 3.8500 3.1727 .91174 1.03685 .057 .404 .67727 1.34145 7.489 219 .000 Pair 4 Save time 3.9680 3.5205 .91565 2.97440 .067 .325 .44749 3.05316 2.169 218 .031 Pair 5 More variety 3.8227 3.3273 .97476 1.04343 .170 .012 .49545 1.30155 5.646 219 .000 Pair 6 Detailed informa tion 3.8045 3.3591 .85634 1.09092 .173 .010 .44545 1.26481 5.224 219 .000
  • 21.
    Pair 7 Deliver y system 3.8091 3.3864 .87581 1.11887 .024 .719.42273 1.40398 4.466 219 .000 Pair 8 Return policy 3.6545 3.2500 .94542 1.06254 -.068 .314 .40455 1.46962 4.083 219 .000 Pair 9 Credit- card Detail 3.4864 2.9182 1.04458 1.07382 .129 .056 .56818 1.39794 6.029 219 .000 Pair 10 Security of Paymen t 3.7580 3.2283 .92412 1.09750 .050 .460 .52968 1.39882 5.604 218 .000 Pair 11 Better quality 3.6636 3.2136 .87874 1.09750 .047 .489 .45000 1.36568 4.887 219 .000 Pair 12 Service 3.8818 3.4273 .84109 2.19987 .032 .633 .45455 2.32962 2.894 219 .004 Pair 13 Mercha ndise availabl e 3.6727 3.1636 .91770 .93660 -.028 .683 .50909 1.32930 5.680 219 .000
  • 22.
    Pair 14 Error free 3.6818 3.1364 .94053 1.09359 .144 .032 .545451.33541 6.058 219 .000 Pair 15 Custom er complai nts 3.7364 3.1773 .88289 1.13090 .102 .132 .55909 1.36196 6.089 219 .000 Pair 16 Product knowle dge 3.8182 3.2591 .87775 1.01638 .145 .031 .55909 1.24275 6.673 219 .000 Pair 17 Paymen t 3.9773 3.3909 .85711 1.06925 .169 .012 .58636 1.25214 6.946 219 .000
  • 23.
    Conclusion  Perceived andExpected Factors were weakly and positively correlated (r = 0.077765, p < 0.001)  There is a significant average difference between Perceived and Expected Factor(1- 17) Pair 14 Error free 3.6818 3.1364 .94053 1.09359 .144 .032 .54545 1.33541 6.058 219 .000 Pair 15 Custom er complai nts 3.7364 3.1773 .88289 1.13090 .102 .132 .55909 1.36196 6.089 219 .000 Pair 16 Product knowle dge 3.8182 3.2591 .87775 1.01638 .145 .031 .55909 1.24275 6.673 219 .000 Pair 17 Paymen t 3.9773 3.3909 .85711 1.06925 .169 .012 .58636 1.25214 6.946 219 .000
  • 24.
     Exploratory Factoranalysis  The KMO Measure of Sampling Adequacy was 0.934 indicating analysis results are meritorious  In total, there were seventy (17) in the data. Items with higher cross loadings (more than 0.20) and those with lower than 0.5 Measures of Sampling Adequacy (MSA) were checked.  Eventually Five statements were trimmed. Finally, remaining twelve statements were used to compute factors.  EFA was repeated again excluding the trimmed measurement. Varimax rotation method was used with factors extraction with Eigen value over 1.It resulted into extraction of two factors KMO and Bartlett's Test Kaiser-Meyer-Olkin Measure of Sampling Adequacy. Bartlett's Test of Sphericity .934 Approx. Chi-Square 1145.780 Df 66 Sig. .000
  • 25.
    Composition of eachfactor identified in factor analysis Factor Items Extraction Convenient .645 Easy to Use .619 More Variety .524 Factor 1 Detailed Product Information .582 Expected Online Delivery System .532 Shopping Environment Better Quality product .559 Error free .506 Customer Complains .634 Product Knowledge .501 Reliable Payment .542 Factor 2 Credit Card System .586 Expected Trust Serviced as Promised .615
  • 26.
     In total,there were seventy (17) in the data. Items with higher cross loadings (more than 0.20) and those with lower than 0.5 Measures of Sampling Adequacy (MSA) were checked  Eventually Eight statements were trimmed. Finally, remaining nine statements were used to compute factors.  EFA was repeated again excluding the trimmed measurement.  Varimax rotation method was used with factors extraction with Eigen value over 1.It resulted into extraction of three factors Kaiser-Meyer-Olkin Measure of Sampling Adequacy. Bartlett's Test of Sphericity .778 Approx. Chi-Square 398.890 Df 36 Sig. .000
  • 27.
    Composition of eachfactor identified in factor analysis Factors Items Extraction Return Policy .658 Factor 1 Security of Payment .508 Perceived Reputation Product Knowledge .561 Reliable Payment .655 Factor 2 Convenient .618 Perceived Ease of use Easy to Use .622 Discount .567 Factor 3 Credit Card System .604 Perceived Risk Better Quality product .573
  • 28.
    Regression  Hypothesis-Customer’s expectedonline shopping environment, expected trust, perceived reputation, perceived ease of use, perceived risk has significant influence over his/her overall online shopping experience on Flipkart Factor Mean Std. Deviation Online shopping Experience 3.8636 .85983 Exp_OnlineShop_Env 3.2445 .80734 Exp_Trust 3.1727 1.23206 Per_Reputation 3.8023 .64691 Per_Ease_of_use 3.8295 .76855 Per_Risk 3.6667 .69498
  • 29.
    Variables Online Shopping Experience BaBb T Sig. VIF Exp_OnlineShop_Env -.131 -.123 -1.949 .053 1.254 Exp_Trust .010 .015 .234 .815 1.213 Per_Reputation .353 .266 4.047 .000 1.347 Per_Ease_of_use .260 .233 3.655 .000 1.268 Per_Risk .249 .201 3.086 .002 1.332 Variables Values R .562 R Square .316 Adjusted R Square .300 Std.Error .71945 F 19.760 Sig, Level .000
  • 30.
    Findings & Discussion FINDINGS In this study we have found that male consumers are using more online shopping than female consumers. It is may be because in India Men use more internet than Women but mobile users are almost same in numbers.  Old age consumers don’t shop online much according to this study compares to Young age consumers. Internet shopping is more popular since 2007, so new generation is likely to use internet more and do shop online but for old age people its very difficult to shop online shopping because its new for them.  There is minor significance difference between consumers perceived and expected service which is positive. Four factors: Expected Trust, Perceived Reputation, Perceived Ease of Use , Perceived risk has positive impact on overall online shopping experience while Expected Online shopping Environment has negative impact on it.  Expected online shopping environment, expected trust, perceived reputation, perceived ease of use and perceived risk factors have 31%. It is less than half of the total influence on overall online shopping experience. These factors are likely to find overall experience
  • 31.
    Findings & Discussion DISCUSSION This study tried to examine the impact of Expected and Perceived Factors on overall shopping in Flipkart. In addition, It also attempted to find Expected and Perceived Factors attitude towards customer’s overall experience in shopping in Flipkart.  Here after result we have found that four out of five factors have positive influence on overall online shopping in Flipkart.  Highest Number of positive influence is by Perceived Reputation on online shopping in Flipkart which is 0.266.
  • 32.
     Lowest Numberof positive influence is by Expected Trust on online shopping in Flipkart which is 0.15.  Only one Factors influence negatively towards online shopping in Flipkart which is Expected online shopping Environment valued - 0.19.  Perceived Ease of use and Perceived Risk are factors which influence positively towards online shopping in Flipkart valued 2.666 and 2.333 accordingly
  • 33.
    Recommendation  Flipkart shouldprovide more awareness to female consumers like work on advertisement; arrange some public awareness programs, etc.  Make design of site very easy and simple so that they can use them without difficulty.  Flipkart can do some work on conveniences, ease of use, reliable payment method and discount that consumer expecting high level of services and perceived low level of services.  There are other factors that not included in this study can be studied by some other methods which effects very much on online shopping in Flipkart