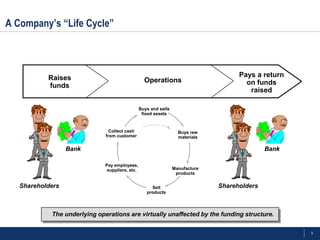
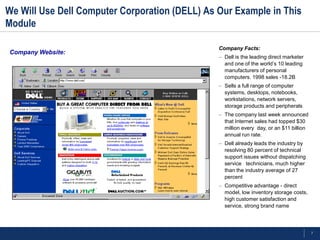
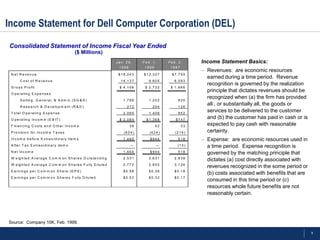
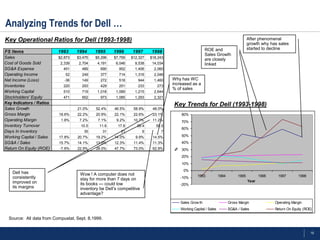
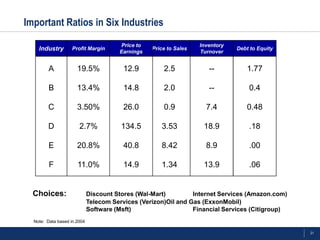
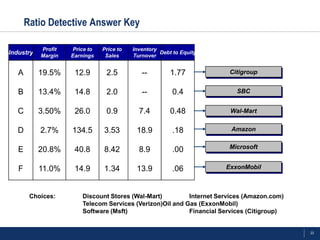
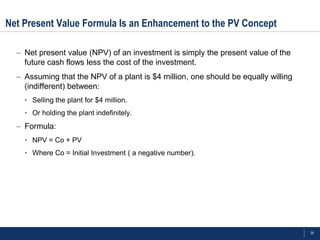
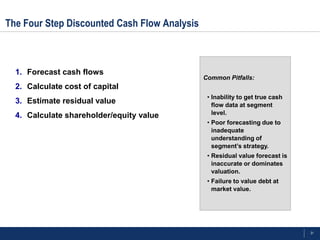
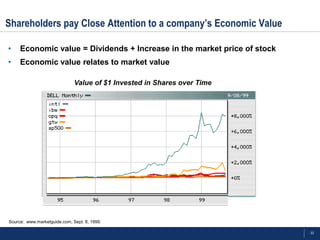
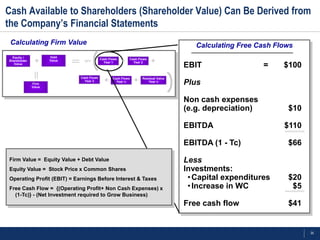
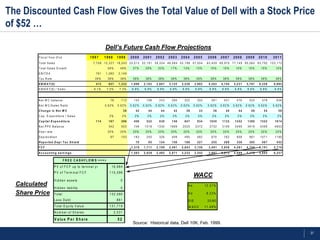
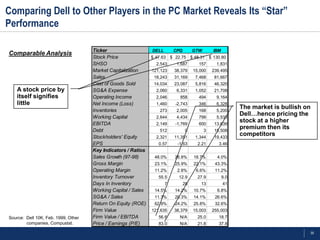
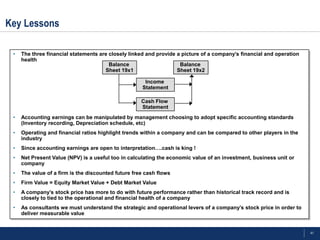
Finance & Valuation Basics
The Purpose of This Module Is to Explain How We Do Financial Analysis

Objectives:
  To explain why Financial Analysis is important in
    strategy consulting projects, what it is, and                        x
    where/how it is used.                                 MV/BV
                                                                       xx x x x
                                                                                  R 2 =?
                                                                  x     x x

  To introduce you to basic ratio analysis and start to               ROE-Ke
    indicate what the different ratios mean.
  Introduce valuation techniques.
  To provide direction for what to do next:
    • People you can contact.
    • Documents you can read.


                                                                                           3
A Company’s “Life Cycle”


           Raises                                                                     Pays a return
                                                   Operations                           on funds
           funds
                                                                                         raised

                                                 Buys and sells
                                                  fixed assets


                                Collect cash                        Buys raw
                              from customer                         materials

                  Bank                                                                         Bank

                              Pay employees,
                               suppliers, etc.                    Manufacture
                                                                   products

   Shareholders                                       Sell                      Shareholders
                                                    products


            The underlying operations are virtually unaffected by the funding structure.

                                                                                                      5
We Will Use Dell Computer Corporation (DELL) As Our Example in This
Module

                                                Company Facts:
Company Website:
                                                – Dell is the leading direct marketer
                                                  and one of the world’s 10 leading
                                                  manufacturers of personal
                                                  computers. 1998 sales -18.2B
                                                – Sells a full range of computer
                                                  systems, desktops, notebooks,
                                                  workstations, network servers,
                                                  storage products and peripherals
                                                – The company last week announced
                                                  that Internet sales had topped $30
                                                  million every day, or an $11 billion
                                                  annual run rate.
                                                – Dell already leads the industry by
                                                  resolving 80 percent of technical
                                                  support issues without dispatching
                                                  service technicians, much higher
                                                  than the industry average of 27
                                                  percent
                                                – Competitive advantage - direct
                                                  model, low inventory storage costs,
                                                  high customer satisfaction and
                                                  service, strong brand name


                                                                                         7
Income Statement for Dell Computer Corporation (DEL)
Consolidated Statement of Income Fiscal Year Ended
                                                   ($ Millions)
                                                                          Jan. 29,        Feb. 1,        Feb. 2,        Income Statement Basics:
                                                                           1999            1998           1997
                                                                                                                        – Revenues: are economic resources
 N et R evenue:                                                            $ 1 8 ,2 4 3   $ 1 2 ,3 2 7    $ 7 ,7 5 9
                                                                                                                          earned during a time period. Revenue
        C ost of R evenue                                                   1 4 ,1 3 7       9 ,6 0 5       6 ,0 9 3
                                                                                                                          recognition is governed by the realization
 G r o s s P r o f it                                                      $ 4 ,1 0 6      $ 2 ,7 2 2     $ 1 ,6 6 6
                                                                                                                          principle that dictates revenues should be
 O p e r a tin g E x p e n s e s
        S e llin g , G e n e r a l, & A d m in .( S G & A )                   1 ,7 8 8       1 ,2 0 2          826
                                                                                                                          recognized when (a) the firm has provided
        R e s e a r c h & D e v e lo p m e n t ( R & D )                         272            204            126
                                                                                                                          all , or substantially all, the goods or
 T o ta l O p e r a tin g E x p e n s e                                       2 ,0 6 0       1 ,4 0 6          952
                                                                                                                          services to be delivered to the customer
 O p e r a tin g In c o m e ( E B IT )                                     $ 2 ,0 8 4      $ 1 ,3 6 8        $747
                                                                                                                          and (b) the customer has paid in cash or is
 F in a n c in g C o s ts a n d O th e r In c o m e                                38             52             33       expected to pay cash with reasonable
 P r o v is io n f o r In c o m e T a x e s                                    (6 2 4 )       (4 2 4 )       (2 1 6 )     certainty.
 In c o m e b e f o r e E x tr a o r d in a r y Ite m s                       1 ,4 6 0        $944             518      – Expense: are economic resources used in
 A f te r T a x E x tr a o r d in a r y ite m s                                     —              —          (1 3 )      a time period. Expense recognition is
 N e t In c o m e                                                             1 ,4 6 0        $944             518        governed by the matching principle that
 W e ig h te d A v e r a g e C o m m o n S h a r e s O u ts ta n d in g       2 ,5 3 1       2 ,6 3 1       2 ,8 3 8
                                                                                                                          dictates (a) cost directly associated with
 W e ig h te d A v e r a g e C o m m o n S h a r e s F u lly D ilu te d       2 ,7 7 2       2 ,9 5 2       3 ,1 2 6
                                                                                                                          revenues recognized in the some period or
 E a r n in g s p e r C o m m o n S h a r e ( E P S )                         $ 0 .5 8       $ 0 .3 6       $ 0 .1 8
                                                                                                                          (b) costs associated with benefits that are
 E a r n in g s p e r C o m m o n S h a r e s F u lly D ilu te d              $ 0 .5 3       $ 0 .3 2       $ 0 .1 7
                                                                                                                          consumed in this time period or (c)
                                                                                                                          resources whole future benefits are not
                                                                                                                          reasonably certain.


Source: Company 10K, Feb. 1999.

                                                                                                                                                                        9
There Are Three Basic Steps in Any Financial Analysis


                                                                 Trend analysis:
                                                                   • How a given parameter has
                                                                     changed over time.

                                                Interpret it &
                                               hopefully gain
                                                   insight
                                                                 Benchmarking:
                                                                   • Comparing a parameter at a point
                              Look it up or
                                                                     in time with competitors or
                             calculate ratio                         industry.


             Choose the
           parameters that
             interest you


                                                                                                    11
Strategists Use Ratio Analysis Selectively
            Ratio            Useful for Strategists              Less Useful for Strategists
 Leverage Ratios:            • Debt ratio                  • Times interest earned
                                                           • Debt-equity ratio

 Liquidity Ratios:                                         •   Cash ratio
                                                           •   Current ratio
                                                           •   Quick ratio
                                                           •   Net working capital to total assets

 Profitability/ Efficiency   • Gross Profit margin         •   Days receivable
 Ratios:                     • Operating Profit margin     •   Return on net assets (RONA)
                             • Return on equity (ROE)      •   Earnings per share (EPS)
                             • Inventory turnover          •   Asset turnover
                             • Days inventory
                             • Return on assets (ROA)
                             • Return on sales (ROS)

 Market Value Ratios         • Price-earning ratio (P/E)   • Dividend yield
                             • Market-to-book ratio        • Book value per share


                                                                                                     13
Financial Ratios Summary
             Ratio                              Formula                                   Significance

 • Accounts payable turnover      • Purchases on account ÷ average         • Measure of how many times the accounts
                                    accounts payable balance                 payable balance is paid


 • Accounts receivable turnover   • Sales on account ÷ average accounts    • Tests how quickly sales are converted into
                                    receivable balance                       cash


 • Acid test ratio                • (Cash + marketable securities +        • Test of short-term debt paying ability
              (Quick ratio)         current receivables) ÷ current
                                    liabilities

 • Average collection period      • 365 ÷ accounts receivable turnover     • Test of quality of accounts receivable in terms
   (days receivables)                                                        of average age in days


 • Average payable periods        • 365 ÷ accounts payable turnover        • Days that it takes to pay an accounts payable
   (days payable)                                                            balance


 • Book value per share           • (Stockholders equity – preferred       • Measure the amount which would be
                                    stock) ÷ number of common shares         distributed to each share of common stock if
                                    outstanding                              assets were liquidated at their balance sheet
                                                                             amounts (based entirely on historical costs)

 • Current ratio                  • Current assets ÷ current liabilities   • Test of short-term debt paying ability


 • Days in inventory (average     • 365 ÷ inventory turnover               • Measure of the number of days required to
   sale period)                                                              convert inventory into revenues


                                                                                                                               15
Financial Ratios Summary (cont.)
          Ratio                              Formula                                            Significance

 • Fixed asset utilization      • Sales ÷ net fixed assets                Measure the usage of a firm’s PP&E


 • Fully diluted earnings per   • Net Income ÷ (number of common          Shows the potential effect on earnings per share of converting
                                                                            convertible securities into common stock
   share                          shares + common stock equivalent
                                  of convertible securities)
                                                                          Measure of profitability before S,G & A

 • Gross profit margin          • (Sales – cost of goods sold ) ÷ sales
                                                                          Measure of how many times a company’s inventory has been
                                                                           sold during the year
 • Inventory turnover           • Cost of goods sold ÷ average
                                  inventory balance                       Measure market premium/discount of a stock


 • Market/Book rate             • Market price per share ÷ book value
                                  per share                               Measure of operating profitability


 • Operating profit margin      • Profit before tax ÷ sales               An index of whether a stock is relatively cheap or relatively
                                                                            expensive

 • Price earnings ratio         • Current market price per share ÷        When compared to the return on total assets, measures the
                                  earnings per share                       extent to which leverage is being employed for or against the
                                                                           common stockholders
 • Return on common             • (Net income – preferred dividends) ÷
   stockholders’ equity           average common stockholders’
                                  equity


                                                                                                                                           17
Analyzing Trends for Dell …
Key Operational Ratios for Dell (1993-1998)                                                                                            After phenomenal
                                                                                                                                       growth why has sales
                                                                                                          ROE and                      started to decline
FS Items                  1993     1994     1995        1996     1997      1998
                                                                                                          Sales Growth
Sales                     $2,873   $3,475   $5,296      $7,759   $12,327   $18,243
                                                                                                          are closely
Cost of Goods Sold         2,339    2,704    4,191       6,046     9,538    14,034                        linked
SG&A Expense                451      489       690        952      1,406     2,060
Operating Income             52      249       377        714      1,316     2,046
Net Income (Loss)            -36     149       272        518       944      1,460   Why has WC
Inventories                 220      293       429        251       233       273
                                                                                     increased as a
                                                                                     % of sales
Working Capital             510      719     1,018       1,089     1,215     2,644
Stockholders' Equity        471      652       973       1,085     1,293     2,321
Key Indicators / Ratios                                                              Key Trends for Dell (1993-1998)
Sales Growth                       21.0%     52.4%      46.5%     58.9%     48.0%
Gross Margin              18.6%    22.2%     20.9%      22.1%     22.6%     23.1%         80%
Operating Margin           1.8%     7.2%      7.1%       9.2%     10.7%     11.2%         70%
Inventory Turnover                   10.5     11.6        17.8      39.4      55.5
                                                                                          60%
Days In Inventory                      35          31      21          9        7
Working Capital / Sales   17.8%    20.7%     19.2%      14.0%      9.9%     14.5%         50%
SG&A / Sales              15.7%    14.1%     13.0%      12.3%     11.4%     11.3%         40%
Return On Equity (ROE)     -7.6%   22.9%     28.0%      47.7%     73.0%     62.9%


                                                                                      %
                                                                                          30%
                                                                                          20%
                                                                                          10%
                                                                                           0%
    Dell has                         Wow ! A computer does not
    consistently                                                                          -10%      1993            1994        1995          1996    1997         1998
                                     stay for more than 7 days on                                                                      Year
    improved on                      its books — could low                                -20%
    its margins                      inventory be Dell’s competitive
                                     advantage?

                                                                                          Sales Grow th                    Gross Margin              Operating Margin
                                                                                          Working Capital / Sales          SG&A / Sales              Return On Equity (ROE)

  Source: All data from Compustat, Sept. 8,1999.


                                                                                                                                                                          19
Important Ratios in Six Industries
                                       Price to                    Inventory
    Industry       Profit Margin
                                       Earnings
                                                  Price to Sales
                                                                   Turnover
                                                                               Debt to Equity


        A             19.5%              12.9         2.5             --           1.77

        B             13.4%              14.8         2.0             --           0.4

        C             3.50%              26.0         0.9            7.4           0.48

        D              2.7%             134.5        3.53           18.9           .18

        E             20.8%              40.8        8.42            8.9           .00

         F            11.0%              14.9        1.34           13.9           .06


  Choices:                   Discount Stores (Wal-Mart)         Internet Services (Amazon.com)
                             Telecom Services (Verizon)Oil and Gas (ExxonMobil)
                             Software (Msft)                    Financial Services (Citigroup)
  Note: Data based in 2004

                                                                                                 21
Ratio Detective Answer Key

           Profit   Price to   Price to   Inventory
Industry   Margin   Earnings    Sales     Turnover
                                                    Debt to Equity


   A       19.5%     12.9       2.5          --         1.77           Citigroup


   B       13.4%     14.8       2.0          --          0.4             SBC


   C       3.50%     26.0       0.9         7.4         0.48           Wal-Mart


   D       2.7%     134.5      3.53        18.9          .18            Amazon


   E       20.8%     40.8      8.42         8.9          .00           Microsoft


   F       11.0%     14.9      1.34        13.9          .06          ExxonMobil


        Choices:        Discount Stores (Wal-Mart)         Internet Services (Amazon.com)
                        Telecom Services (Verizon)Oil and Gas (ExxonMobil)
                        Software (Msft)                    Financial Services (Citigroup)


                                                                                            23
Companies Raise Funds by Approaching Capital Markets and Issuing Debt
and/or Equity Instruments


                                                Buys and sells
                                                 fixed assets
     Bank /                                                                         Bank /
   Bondholders                                                                    Bondholders
                               Collect cash                        Buys raw
                             from customer                         materials

                                              Company

                             Pay employees,
                              suppliers, etc.                    Manufacture
                                                                  products


                                                     Sell
                                                   products


   Shareholders                                                                Shareholders


            Bondholders and stockholders demand a return on their investments that
            are specific to a company.

                                                                                                25
The Discount Rate along with Present Value Is the Most Widely Used
Tool for Making Investment Decisions

Future cash flows are discounted based on the following rationale:
  • A dollar today is worth more that a dollar tomorrow (can be invested).
  • A safe dollar is worth more than a risky one.

Present value has two components:
  • Cash flow (as opposed to accounting earnings).
  • Discount rate:
    – The reward that investors demand for delayed payment.
    – Also know as hurdle rate or opportunity cost of capital.


                                                                             27
Net Present Value Formula Is an Enhancement to the PV Concept

  – Net present value (NPV) of an investment is simply the present value of the
    future cash flows less the cost of the investment.
  – Assuming that the NPV of a plant is $4 million, one should be equally willing
    (indifferent) between:
    • Selling the plant for $4 million.
    • Or holding the plant indefinitely.
  – Formula:
    • NPV = Co + PV
    • Where Co = Initial Investment ( a negative number).


                                                                                    29
The Four Step Discounted Cash Flow Analysis


  1. Forecast cash flows
                                              Common Pitfalls:
  2. Calculate cost of capital
                                               • Inability to get true cash
  3. Estimate residual value                     flow data at segment
  4. Calculate shareholder/equity value          level.
                                               • Poor forecasting due to
                                                 inadequate
                                                 understanding of
                                                 segment’s strategy.
                                               • Residual value forecast is
                                                 inaccurate or dominates
                                                 valuation.
                                               • Failure to value debt at
                                                 market value.


                                                                              31
Shareholders pay Close Attention to a company’s Economic Value

•    Economic value = Dividends + Increase in the market price of stock
•    Economic value relates to market value

                              Value of $1 Invested in Shares over Time


Source: www.marketguide.com, Sept. 8, 1999.

                                                                          33
Cash Available to Shareholders (Shareholder Value) Can Be Derived from
the Company’s Financial Statements
 Calculating Firm Value                                                                    Calculating Free Cash Flows

                              —
  Equity /            Debt
                              —
                                               Cash Flows       Cash Flows
Shareholder    +      Value         NPV          Year 1     +     Year 2     +
   Value
                                                                                        EBIT                  =    $100
              —
              —


                                  Cash Flows          Cash Flows       Residual Value
              Firm
                                    Year 3       +      Year n     +       Year n
                                                                                        Plus
              Value


                                                                                        Non cash expenses
                                                                                        (e.g. depreciation)         $10

                                                                                        EBITDA                     $110

                                                                                        EBITDA (1 - Tc)             $66

Firm Value = Equity Value + Debt Value                                                  Less
Equity Value = Stock Price x Common Shares                                              Investments:
Operating Profit (EBIT) = Earnings Before Interest & Taxes                               • Capital expenditures     $20
Free Cash Flow = {(Operating Profit+ Non Cash Expenses) x                                • Increase in WC            $5
  (1-Tc)} - (Net Investment required to Grow Business)
                                                                                        Free cash flow              $41


                                                                                                                          35
The Discounted Cash Flow Gives the Total Value of Dell with a Stock Price
of $52 …

                                                                     Dell’s Future Cash Flow Projections
         F is c a l Y e a r E n d                       1997         1998        1999          2000       2001       2002       2003       2004       2005            2006       2007       2008        2009       2010         2011
         T o ta l S a le s                                 7 ,7 5 9 1 2 ,3 2 7 1 8 ,2 4 3 2 5 ,0 1 3 3 2 ,1 9 1 3 9 ,3 3 4 4 6 ,0 8 4 5 2 ,1 9 8 5 7 ,5 5 4          6 3 ,4 5 9 6 9 ,9 7 0 7 7 ,1 4 9 8 5 ,0 6 5 9 3 ,7 9 2 1 0 3 ,1 7 2
         T o ta l S a le s G r o w th                                  59%           48%         37%        29%        22%        17%        13%         10%            10%        10%        10%         10%        10%          10%
         E B IT D A                                          761      1 ,3 8 3     2 ,1 4 9
         T a x R a te                                       38%        38%           38%         38%        38%        38%        38%        38%         38%            38%        38%        38%         38%        38%          38%
         E B ID A T ( $ )                                    472        857        1 ,3 3 2    1 ,6 9 6   2 ,1 8 3   2 ,6 6 7   3 ,1 2 5   3 ,5 3 9     3 ,9 0 2      4 ,3 0 3   4 ,7 4 4    5 ,2 3 1   5 ,7 6 7   6 ,3 5 9     6 ,9 9 5
         E B ID A T ( $ ) / S a le s                        6 .1 %    7 .0 %        7 .3 %      6 .8 %     6 .8 %     6 .8 %     6 .8 %     6 .8 %      6 .8 %         6 .8 %     6 .8 %      6 .8 %     6 .8 %     6 .8 %       6 .8 %


         N e t W C b a la n c e                                           76          112         154        198        243        284        322         355            391        431        476         524        578          636
         N e t W C /S a le s R a tio                                 0 .6 2 %     0 .6 2 %     0 .6 2 %   0 .6 2 %   0 .6 2 %   0 .6 2 %   0 .6 2 %   0 .6 2 %       0 .6 2 %    0 .6 2 %   0 .6 2 %    0 .6 2 %   0 .6 2 %     0 .6 2 %
         C h a n g e in N e t W C                                                         36        42         44         44         42         38          33            36          40         44          49         54           58
         C a p . E x p e n d itu r e / S a le s                          2%            2%          2%         2%         2%         2%         2%          2%            2%          2%         2%          2%         2%           2%
         C a p it a l E x p e n d it u r e                   114        187           296         406        522        638        748        847         934          1030       1135        1252       1380       1522         1674
         N e t P P E B a la n c e                                       342           523         746      1018       1330       1669       2020        2372           2732       3106        3499       3919       4369         4853
         D e p r r a te                                                20%           20%         20%        20%        20%        20%        20%         20%            20%        20%        20%         20%        20%          20%
         D e p r e c ia tio n                                             67          103         183        250        326        409        495         582            670        762        858         961      1071         1190
         R e p o r t e d D e p r T a x S h ie ld                                                    70         95       124        156        188         221            255        289        326         365        407          452
         FCF                                                                                   1 ,3 1 8   1 ,7 1 1   2 ,1 0 9   2 ,4 9 1   2 ,8 4 3     3 ,1 5 6      3 ,4 9 1   3 ,8 5 8    4 ,2 6 1   4 ,7 0 4   5 ,1 9 1     5 ,7 1 6
         A c c o u n t in g e a r n in g s                                                     1 ,5 8 3   2 ,0 2 8   2 ,4 6 5   2 ,8 7 1   3 ,2 3 2     3 ,5 4 2      3 ,8 8 7   4 ,2 7 2    4 ,6 9 9   5 ,1 7 2   5 ,6 9 5     6 ,2 5 7

                                     FREE CASHFLO W S ===>
                          P V o f F C F u p to te rn in a l y r            1 6 ,9 8 4
                          P V o f T e rm in a l F C F                    1 1 5 ,5 9 6
                                                                                                                                                      WACC
                          H id d e n a s s e ts                                      0
  Calculated                                                                                                                                     Ke                1 2 .3 1 %
                          H id d e n lia b ility                                     0
  Share Price             T o ta l                                       1 3 2 ,5 8 0                                                            Kd                 8 .2 3 %
                          Less D ebt                                             861                                                             D /E                2 0 /8 0
                          T o ta l E q u ity V a lu e                    1 3 1 ,7 1 9                                                            W ACC             1 1 .4 9 %
                          N u m b e r o f S h a re s                           2 ,5 3 1

                          V a lu e P e r S h a r e                                52
                                                                                                 Source: Historical data, Dell 10K, Feb. 1999.

                                                                                                                                                                                                                                           37
Comparing Dell to Other Players in the PC Market Reveals Its “Star”
Performance

                                     Ticker                    DELL       CPQ        GTW       IBM
Comparable Analysis
                                     Stock Price               $ 47.63 $ 22.75 $ 48.31 $ 130.80
                                     SHSO                        2,543     1,687       157       1,831
                                     Market Capitalization     121,123    38,379     15,000    239,495
                                     Sales                      18,243    31,169      7,468     81,667
                                     Cost of Goods Sold         14,034    23,087      5,816     46,320
   A stock price by                  SG&A Expense                2,060     6,331      1,052     21,708
   itself signifies                  Operating Income            2,046      858        494       9,164
   little                            Net Income (Loss)           1,460    -2,743       346       6,328
                                     Inventories                  273      2,005       168       5,200
                                                                                                           The market is bullish on
                                     Working Capital             2,644     4,434       799       5,533
                                                                                                           Dell…hence pricing the
                                     EBITDA                      2,149    -1,769       600      13,639
                                                                                                           stock at a higher
                                     Debt                         512           0          3    15,508
                                                                                                           premium then its
                                     Stockholders' Equity        2,321    11,351      1,344     19,433
                                                                                                           competitors
                                     EPS                          0.57     -1.63       2.21       3.46
                                     Key Indicators / Ratios
                                     Sales Growth (97-98)       48.0%     26.8%      18.7%       4.0%
                                     Gross Margin               23.1%     25.9%      22.1%      43.3%
                                     Operating Margin           11.2%      2.8%       6.6%      11.2%
                                     Inventory Turnover           55.5      12.9       27.9          9.0
                                     Days In Inventory                7         28      13           41
                                     Working Capital / Sales    14.5%     14.2%      10.7%       6.8%
                                     SG&A / Sales               11.3%     20.3%      14.1%      26.6%
                                     Return On Equity (ROE)     62.9%     -24.2%     25.8%      32.6%
                                     Firm Value                121,635    38,379     15,003    255,003
Source: Dell 10K, Feb. 1999; Other   Firm Value / EBITDA          56.6      N/A        25.0       18.7
        companies, Compustat.        Price / Earnings (P/E)       83.0      N/A        21.8       37.8

                                                                                                                                  39
Key Lessons

 •   The three financial statements are closely linked and provide a picture of a company’s financial and operation
     health
                                        Balance                     Balance
                                      Sheet 19x1                   Sheet 19x2

                                                      Income
                                                     Statement

                                                     Cash Flow
                                                     Statement
 •   Accounting earnings can be manipulated by management choosing to adopt specific accounting standards
     (Inventory recording, Depreciation schedule, etc)
 •   Operating and financial ratios highlight trends within a company and can be compared to other players in the
     industry
 •   Since accounting earnings are open to interpretation….cash is king !
 •   Net Present Value (NPV) is a useful too in calculating the economic value of an investment, business unit or
     company
 •   The value of a firm is the discounted future free cash flows
 •   Firm Value = Equity Market Value + Debt Market Value
 •   A company’s stock price has more to do with future performance rather than historical track record and is
     closely to tied to the operational and financial health of a company
 •   As consultants we must understand the strategic and operational levers of a company’s stock price in order to
     deliver measurable value


                                                                                                                      41

Flevy.com - Finance and Valuation Basics

  • 1.
  • 2.
    The Purpose ofThis Module Is to Explain How We Do Financial Analysis Objectives: To explain why Financial Analysis is important in strategy consulting projects, what it is, and x where/how it is used. MV/BV xx x x x R 2 =? x x x To introduce you to basic ratio analysis and start to ROE-Ke indicate what the different ratios mean. Introduce valuation techniques. To provide direction for what to do next: • People you can contact. • Documents you can read. 3
  • 3.
    A Company’s “LifeCycle” Raises Pays a return Operations on funds funds raised Buys and sells fixed assets Collect cash Buys raw from customer materials Bank Bank Pay employees, suppliers, etc. Manufacture products Shareholders Sell Shareholders products The underlying operations are virtually unaffected by the funding structure. 5
  • 4.
    We Will UseDell Computer Corporation (DELL) As Our Example in This Module Company Facts: Company Website: – Dell is the leading direct marketer and one of the world’s 10 leading manufacturers of personal computers. 1998 sales -18.2B – Sells a full range of computer systems, desktops, notebooks, workstations, network servers, storage products and peripherals – The company last week announced that Internet sales had topped $30 million every day, or an $11 billion annual run rate. – Dell already leads the industry by resolving 80 percent of technical support issues without dispatching service technicians, much higher than the industry average of 27 percent – Competitive advantage - direct model, low inventory storage costs, high customer satisfaction and service, strong brand name 7
  • 5.
    Income Statement forDell Computer Corporation (DEL) Consolidated Statement of Income Fiscal Year Ended ($ Millions) Jan. 29, Feb. 1, Feb. 2, Income Statement Basics: 1999 1998 1997 – Revenues: are economic resources N et R evenue: $ 1 8 ,2 4 3 $ 1 2 ,3 2 7 $ 7 ,7 5 9 earned during a time period. Revenue C ost of R evenue 1 4 ,1 3 7 9 ,6 0 5 6 ,0 9 3 recognition is governed by the realization G r o s s P r o f it $ 4 ,1 0 6 $ 2 ,7 2 2 $ 1 ,6 6 6 principle that dictates revenues should be O p e r a tin g E x p e n s e s S e llin g , G e n e r a l, & A d m in .( S G & A ) 1 ,7 8 8 1 ,2 0 2 826 recognized when (a) the firm has provided R e s e a r c h & D e v e lo p m e n t ( R & D ) 272 204 126 all , or substantially all, the goods or T o ta l O p e r a tin g E x p e n s e 2 ,0 6 0 1 ,4 0 6 952 services to be delivered to the customer O p e r a tin g In c o m e ( E B IT ) $ 2 ,0 8 4 $ 1 ,3 6 8 $747 and (b) the customer has paid in cash or is F in a n c in g C o s ts a n d O th e r In c o m e 38 52 33 expected to pay cash with reasonable P r o v is io n f o r In c o m e T a x e s (6 2 4 ) (4 2 4 ) (2 1 6 ) certainty. In c o m e b e f o r e E x tr a o r d in a r y Ite m s 1 ,4 6 0 $944 518 – Expense: are economic resources used in A f te r T a x E x tr a o r d in a r y ite m s — — (1 3 ) a time period. Expense recognition is N e t In c o m e 1 ,4 6 0 $944 518 governed by the matching principle that W e ig h te d A v e r a g e C o m m o n S h a r e s O u ts ta n d in g 2 ,5 3 1 2 ,6 3 1 2 ,8 3 8 dictates (a) cost directly associated with W e ig h te d A v e r a g e C o m m o n S h a r e s F u lly D ilu te d 2 ,7 7 2 2 ,9 5 2 3 ,1 2 6 revenues recognized in the some period or E a r n in g s p e r C o m m o n S h a r e ( E P S ) $ 0 .5 8 $ 0 .3 6 $ 0 .1 8 (b) costs associated with benefits that are E a r n in g s p e r C o m m o n S h a r e s F u lly D ilu te d $ 0 .5 3 $ 0 .3 2 $ 0 .1 7 consumed in this time period or (c) resources whole future benefits are not reasonably certain. Source: Company 10K, Feb. 1999. 9
  • 6.
    There Are ThreeBasic Steps in Any Financial Analysis Trend analysis: • How a given parameter has changed over time. Interpret it & hopefully gain insight Benchmarking: • Comparing a parameter at a point Look it up or in time with competitors or calculate ratio industry. Choose the parameters that interest you 11
  • 7.
    Strategists Use RatioAnalysis Selectively Ratio Useful for Strategists Less Useful for Strategists Leverage Ratios: • Debt ratio • Times interest earned • Debt-equity ratio Liquidity Ratios: • Cash ratio • Current ratio • Quick ratio • Net working capital to total assets Profitability/ Efficiency • Gross Profit margin • Days receivable Ratios: • Operating Profit margin • Return on net assets (RONA) • Return on equity (ROE) • Earnings per share (EPS) • Inventory turnover • Asset turnover • Days inventory • Return on assets (ROA) • Return on sales (ROS) Market Value Ratios • Price-earning ratio (P/E) • Dividend yield • Market-to-book ratio • Book value per share 13
  • 8.
    Financial Ratios Summary Ratio Formula Significance • Accounts payable turnover • Purchases on account ÷ average • Measure of how many times the accounts accounts payable balance payable balance is paid • Accounts receivable turnover • Sales on account ÷ average accounts • Tests how quickly sales are converted into receivable balance cash • Acid test ratio • (Cash + marketable securities + • Test of short-term debt paying ability (Quick ratio) current receivables) ÷ current liabilities • Average collection period • 365 ÷ accounts receivable turnover • Test of quality of accounts receivable in terms (days receivables) of average age in days • Average payable periods • 365 ÷ accounts payable turnover • Days that it takes to pay an accounts payable (days payable) balance • Book value per share • (Stockholders equity – preferred • Measure the amount which would be stock) ÷ number of common shares distributed to each share of common stock if outstanding assets were liquidated at their balance sheet amounts (based entirely on historical costs) • Current ratio • Current assets ÷ current liabilities • Test of short-term debt paying ability • Days in inventory (average • 365 ÷ inventory turnover • Measure of the number of days required to sale period) convert inventory into revenues 15
  • 9.
    Financial Ratios Summary(cont.) Ratio Formula Significance • Fixed asset utilization • Sales ÷ net fixed assets Measure the usage of a firm’s PP&E • Fully diluted earnings per • Net Income ÷ (number of common Shows the potential effect on earnings per share of converting convertible securities into common stock share shares + common stock equivalent of convertible securities) Measure of profitability before S,G & A • Gross profit margin • (Sales – cost of goods sold ) ÷ sales Measure of how many times a company’s inventory has been sold during the year • Inventory turnover • Cost of goods sold ÷ average inventory balance Measure market premium/discount of a stock • Market/Book rate • Market price per share ÷ book value per share Measure of operating profitability • Operating profit margin • Profit before tax ÷ sales An index of whether a stock is relatively cheap or relatively expensive • Price earnings ratio • Current market price per share ÷ When compared to the return on total assets, measures the earnings per share extent to which leverage is being employed for or against the common stockholders • Return on common • (Net income – preferred dividends) ÷ stockholders’ equity average common stockholders’ equity 17
  • 10.
    Analyzing Trends forDell … Key Operational Ratios for Dell (1993-1998) After phenomenal growth why has sales ROE and started to decline FS Items 1993 1994 1995 1996 1997 1998 Sales Growth Sales $2,873 $3,475 $5,296 $7,759 $12,327 $18,243 are closely Cost of Goods Sold 2,339 2,704 4,191 6,046 9,538 14,034 linked SG&A Expense 451 489 690 952 1,406 2,060 Operating Income 52 249 377 714 1,316 2,046 Net Income (Loss) -36 149 272 518 944 1,460 Why has WC Inventories 220 293 429 251 233 273 increased as a % of sales Working Capital 510 719 1,018 1,089 1,215 2,644 Stockholders' Equity 471 652 973 1,085 1,293 2,321 Key Indicators / Ratios Key Trends for Dell (1993-1998) Sales Growth 21.0% 52.4% 46.5% 58.9% 48.0% Gross Margin 18.6% 22.2% 20.9% 22.1% 22.6% 23.1% 80% Operating Margin 1.8% 7.2% 7.1% 9.2% 10.7% 11.2% 70% Inventory Turnover 10.5 11.6 17.8 39.4 55.5 60% Days In Inventory 35 31 21 9 7 Working Capital / Sales 17.8% 20.7% 19.2% 14.0% 9.9% 14.5% 50% SG&A / Sales 15.7% 14.1% 13.0% 12.3% 11.4% 11.3% 40% Return On Equity (ROE) -7.6% 22.9% 28.0% 47.7% 73.0% 62.9% % 30% 20% 10% 0% Dell has Wow ! A computer does not consistently -10% 1993 1994 1995 1996 1997 1998 stay for more than 7 days on Year improved on its books — could low -20% its margins inventory be Dell’s competitive advantage? Sales Grow th Gross Margin Operating Margin Working Capital / Sales SG&A / Sales Return On Equity (ROE) Source: All data from Compustat, Sept. 8,1999. 19
  • 11.
    Important Ratios inSix Industries Price to Inventory Industry Profit Margin Earnings Price to Sales Turnover Debt to Equity A 19.5% 12.9 2.5 -- 1.77 B 13.4% 14.8 2.0 -- 0.4 C 3.50% 26.0 0.9 7.4 0.48 D 2.7% 134.5 3.53 18.9 .18 E 20.8% 40.8 8.42 8.9 .00 F 11.0% 14.9 1.34 13.9 .06 Choices: Discount Stores (Wal-Mart) Internet Services (Amazon.com) Telecom Services (Verizon)Oil and Gas (ExxonMobil) Software (Msft) Financial Services (Citigroup) Note: Data based in 2004 21
  • 12.
    Ratio Detective AnswerKey Profit Price to Price to Inventory Industry Margin Earnings Sales Turnover Debt to Equity A 19.5% 12.9 2.5 -- 1.77 Citigroup B 13.4% 14.8 2.0 -- 0.4 SBC C 3.50% 26.0 0.9 7.4 0.48 Wal-Mart D 2.7% 134.5 3.53 18.9 .18 Amazon E 20.8% 40.8 8.42 8.9 .00 Microsoft F 11.0% 14.9 1.34 13.9 .06 ExxonMobil Choices: Discount Stores (Wal-Mart) Internet Services (Amazon.com) Telecom Services (Verizon)Oil and Gas (ExxonMobil) Software (Msft) Financial Services (Citigroup) 23
  • 13.
    Companies Raise Fundsby Approaching Capital Markets and Issuing Debt and/or Equity Instruments Buys and sells fixed assets Bank / Bank / Bondholders Bondholders Collect cash Buys raw from customer materials Company Pay employees, suppliers, etc. Manufacture products Sell products Shareholders Shareholders Bondholders and stockholders demand a return on their investments that are specific to a company. 25
  • 14.
    The Discount Ratealong with Present Value Is the Most Widely Used Tool for Making Investment Decisions Future cash flows are discounted based on the following rationale: • A dollar today is worth more that a dollar tomorrow (can be invested). • A safe dollar is worth more than a risky one. Present value has two components: • Cash flow (as opposed to accounting earnings). • Discount rate: – The reward that investors demand for delayed payment. – Also know as hurdle rate or opportunity cost of capital. 27
  • 15.
    Net Present ValueFormula Is an Enhancement to the PV Concept – Net present value (NPV) of an investment is simply the present value of the future cash flows less the cost of the investment. – Assuming that the NPV of a plant is $4 million, one should be equally willing (indifferent) between: • Selling the plant for $4 million. • Or holding the plant indefinitely. – Formula: • NPV = Co + PV • Where Co = Initial Investment ( a negative number). 29
  • 16.
    The Four StepDiscounted Cash Flow Analysis 1. Forecast cash flows Common Pitfalls: 2. Calculate cost of capital • Inability to get true cash 3. Estimate residual value flow data at segment 4. Calculate shareholder/equity value level. • Poor forecasting due to inadequate understanding of segment’s strategy. • Residual value forecast is inaccurate or dominates valuation. • Failure to value debt at market value. 31
  • 17.
    Shareholders pay CloseAttention to a company’s Economic Value • Economic value = Dividends + Increase in the market price of stock • Economic value relates to market value Value of $1 Invested in Shares over Time Source: www.marketguide.com, Sept. 8, 1999. 33
  • 18.
    Cash Available toShareholders (Shareholder Value) Can Be Derived from the Company’s Financial Statements Calculating Firm Value Calculating Free Cash Flows — Equity / Debt — Cash Flows Cash Flows Shareholder + Value NPV Year 1 + Year 2 + Value EBIT = $100 — — Cash Flows Cash Flows Residual Value Firm Year 3 + Year n + Year n Plus Value Non cash expenses (e.g. depreciation) $10 EBITDA $110 EBITDA (1 - Tc) $66 Firm Value = Equity Value + Debt Value Less Equity Value = Stock Price x Common Shares Investments: Operating Profit (EBIT) = Earnings Before Interest & Taxes • Capital expenditures $20 Free Cash Flow = {(Operating Profit+ Non Cash Expenses) x • Increase in WC $5 (1-Tc)} - (Net Investment required to Grow Business) Free cash flow $41 35
  • 19.
    The Discounted CashFlow Gives the Total Value of Dell with a Stock Price of $52 … Dell’s Future Cash Flow Projections F is c a l Y e a r E n d 1997 1998 1999 2000 2001 2002 2003 2004 2005 2006 2007 2008 2009 2010 2011 T o ta l S a le s 7 ,7 5 9 1 2 ,3 2 7 1 8 ,2 4 3 2 5 ,0 1 3 3 2 ,1 9 1 3 9 ,3 3 4 4 6 ,0 8 4 5 2 ,1 9 8 5 7 ,5 5 4 6 3 ,4 5 9 6 9 ,9 7 0 7 7 ,1 4 9 8 5 ,0 6 5 9 3 ,7 9 2 1 0 3 ,1 7 2 T o ta l S a le s G r o w th 59% 48% 37% 29% 22% 17% 13% 10% 10% 10% 10% 10% 10% 10% E B IT D A 761 1 ,3 8 3 2 ,1 4 9 T a x R a te 38% 38% 38% 38% 38% 38% 38% 38% 38% 38% 38% 38% 38% 38% 38% E B ID A T ( $ ) 472 857 1 ,3 3 2 1 ,6 9 6 2 ,1 8 3 2 ,6 6 7 3 ,1 2 5 3 ,5 3 9 3 ,9 0 2 4 ,3 0 3 4 ,7 4 4 5 ,2 3 1 5 ,7 6 7 6 ,3 5 9 6 ,9 9 5 E B ID A T ( $ ) / S a le s 6 .1 % 7 .0 % 7 .3 % 6 .8 % 6 .8 % 6 .8 % 6 .8 % 6 .8 % 6 .8 % 6 .8 % 6 .8 % 6 .8 % 6 .8 % 6 .8 % 6 .8 % N e t W C b a la n c e 76 112 154 198 243 284 322 355 391 431 476 524 578 636 N e t W C /S a le s R a tio 0 .6 2 % 0 .6 2 % 0 .6 2 % 0 .6 2 % 0 .6 2 % 0 .6 2 % 0 .6 2 % 0 .6 2 % 0 .6 2 % 0 .6 2 % 0 .6 2 % 0 .6 2 % 0 .6 2 % 0 .6 2 % C h a n g e in N e t W C 36 42 44 44 42 38 33 36 40 44 49 54 58 C a p . E x p e n d itu r e / S a le s 2% 2% 2% 2% 2% 2% 2% 2% 2% 2% 2% 2% 2% 2% C a p it a l E x p e n d it u r e 114 187 296 406 522 638 748 847 934 1030 1135 1252 1380 1522 1674 N e t P P E B a la n c e 342 523 746 1018 1330 1669 2020 2372 2732 3106 3499 3919 4369 4853 D e p r r a te 20% 20% 20% 20% 20% 20% 20% 20% 20% 20% 20% 20% 20% 20% D e p r e c ia tio n 67 103 183 250 326 409 495 582 670 762 858 961 1071 1190 R e p o r t e d D e p r T a x S h ie ld 70 95 124 156 188 221 255 289 326 365 407 452 FCF 1 ,3 1 8 1 ,7 1 1 2 ,1 0 9 2 ,4 9 1 2 ,8 4 3 3 ,1 5 6 3 ,4 9 1 3 ,8 5 8 4 ,2 6 1 4 ,7 0 4 5 ,1 9 1 5 ,7 1 6 A c c o u n t in g e a r n in g s 1 ,5 8 3 2 ,0 2 8 2 ,4 6 5 2 ,8 7 1 3 ,2 3 2 3 ,5 4 2 3 ,8 8 7 4 ,2 7 2 4 ,6 9 9 5 ,1 7 2 5 ,6 9 5 6 ,2 5 7 FREE CASHFLO W S ===> P V o f F C F u p to te rn in a l y r 1 6 ,9 8 4 P V o f T e rm in a l F C F 1 1 5 ,5 9 6 WACC H id d e n a s s e ts 0 Calculated Ke 1 2 .3 1 % H id d e n lia b ility 0 Share Price T o ta l 1 3 2 ,5 8 0 Kd 8 .2 3 % Less D ebt 861 D /E 2 0 /8 0 T o ta l E q u ity V a lu e 1 3 1 ,7 1 9 W ACC 1 1 .4 9 % N u m b e r o f S h a re s 2 ,5 3 1 V a lu e P e r S h a r e 52 Source: Historical data, Dell 10K, Feb. 1999. 37
  • 20.
    Comparing Dell toOther Players in the PC Market Reveals Its “Star” Performance Ticker DELL CPQ GTW IBM Comparable Analysis Stock Price $ 47.63 $ 22.75 $ 48.31 $ 130.80 SHSO 2,543 1,687 157 1,831 Market Capitalization 121,123 38,379 15,000 239,495 Sales 18,243 31,169 7,468 81,667 Cost of Goods Sold 14,034 23,087 5,816 46,320 A stock price by SG&A Expense 2,060 6,331 1,052 21,708 itself signifies Operating Income 2,046 858 494 9,164 little Net Income (Loss) 1,460 -2,743 346 6,328 Inventories 273 2,005 168 5,200 The market is bullish on Working Capital 2,644 4,434 799 5,533 Dell…hence pricing the EBITDA 2,149 -1,769 600 13,639 stock at a higher Debt 512 0 3 15,508 premium then its Stockholders' Equity 2,321 11,351 1,344 19,433 competitors EPS 0.57 -1.63 2.21 3.46 Key Indicators / Ratios Sales Growth (97-98) 48.0% 26.8% 18.7% 4.0% Gross Margin 23.1% 25.9% 22.1% 43.3% Operating Margin 11.2% 2.8% 6.6% 11.2% Inventory Turnover 55.5 12.9 27.9 9.0 Days In Inventory 7 28 13 41 Working Capital / Sales 14.5% 14.2% 10.7% 6.8% SG&A / Sales 11.3% 20.3% 14.1% 26.6% Return On Equity (ROE) 62.9% -24.2% 25.8% 32.6% Firm Value 121,635 38,379 15,003 255,003 Source: Dell 10K, Feb. 1999; Other Firm Value / EBITDA 56.6 N/A 25.0 18.7 companies, Compustat. Price / Earnings (P/E) 83.0 N/A 21.8 37.8 39
  • 21.
    Key Lessons • The three financial statements are closely linked and provide a picture of a company’s financial and operation health Balance Balance Sheet 19x1 Sheet 19x2 Income Statement Cash Flow Statement • Accounting earnings can be manipulated by management choosing to adopt specific accounting standards (Inventory recording, Depreciation schedule, etc) • Operating and financial ratios highlight trends within a company and can be compared to other players in the industry • Since accounting earnings are open to interpretation….cash is king ! • Net Present Value (NPV) is a useful too in calculating the economic value of an investment, business unit or company • The value of a firm is the discounted future free cash flows • Firm Value = Equity Market Value + Debt Market Value • A company’s stock price has more to do with future performance rather than historical track record and is closely to tied to the operational and financial health of a company • As consultants we must understand the strategic and operational levers of a company’s stock price in order to deliver measurable value 41