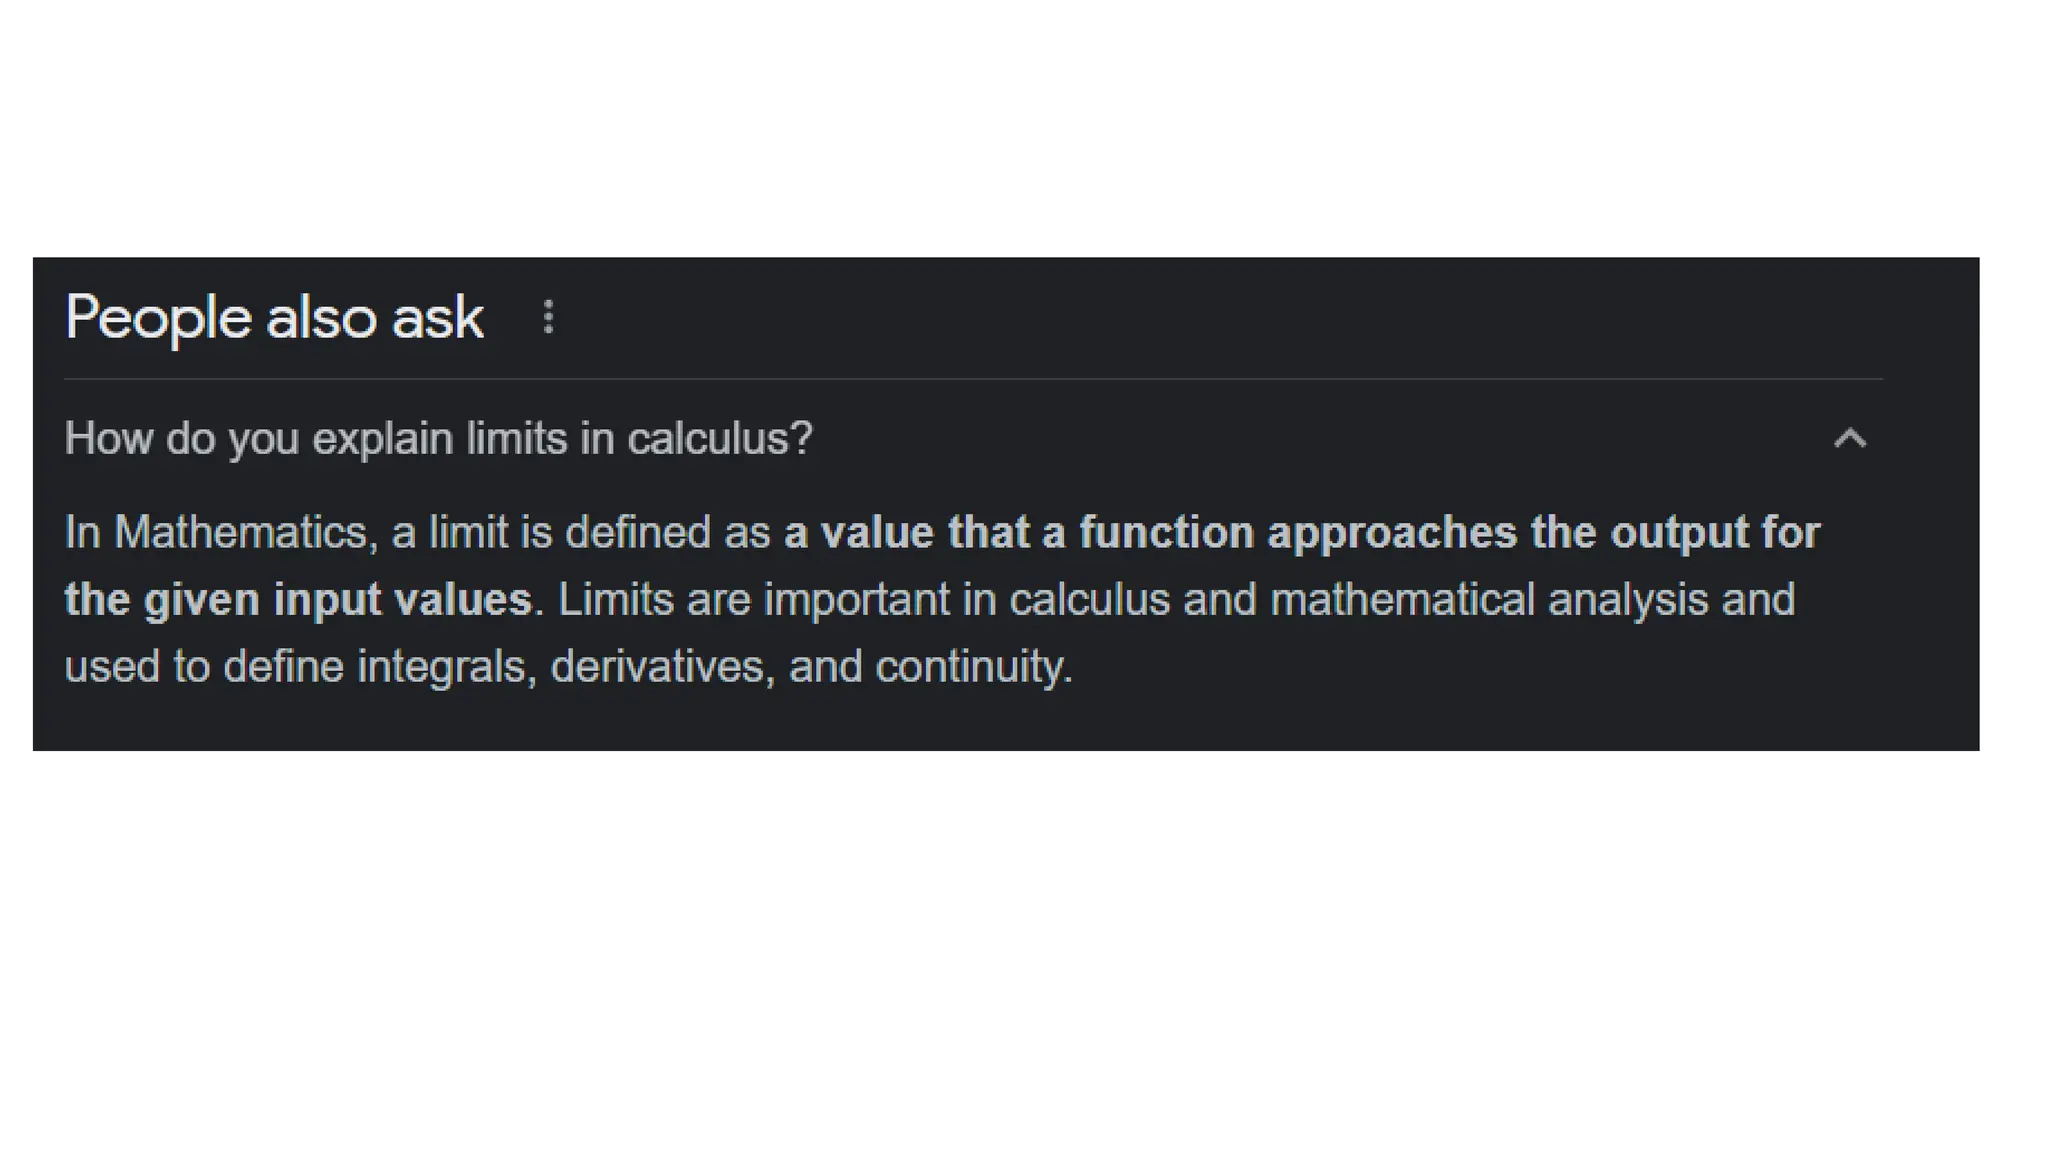
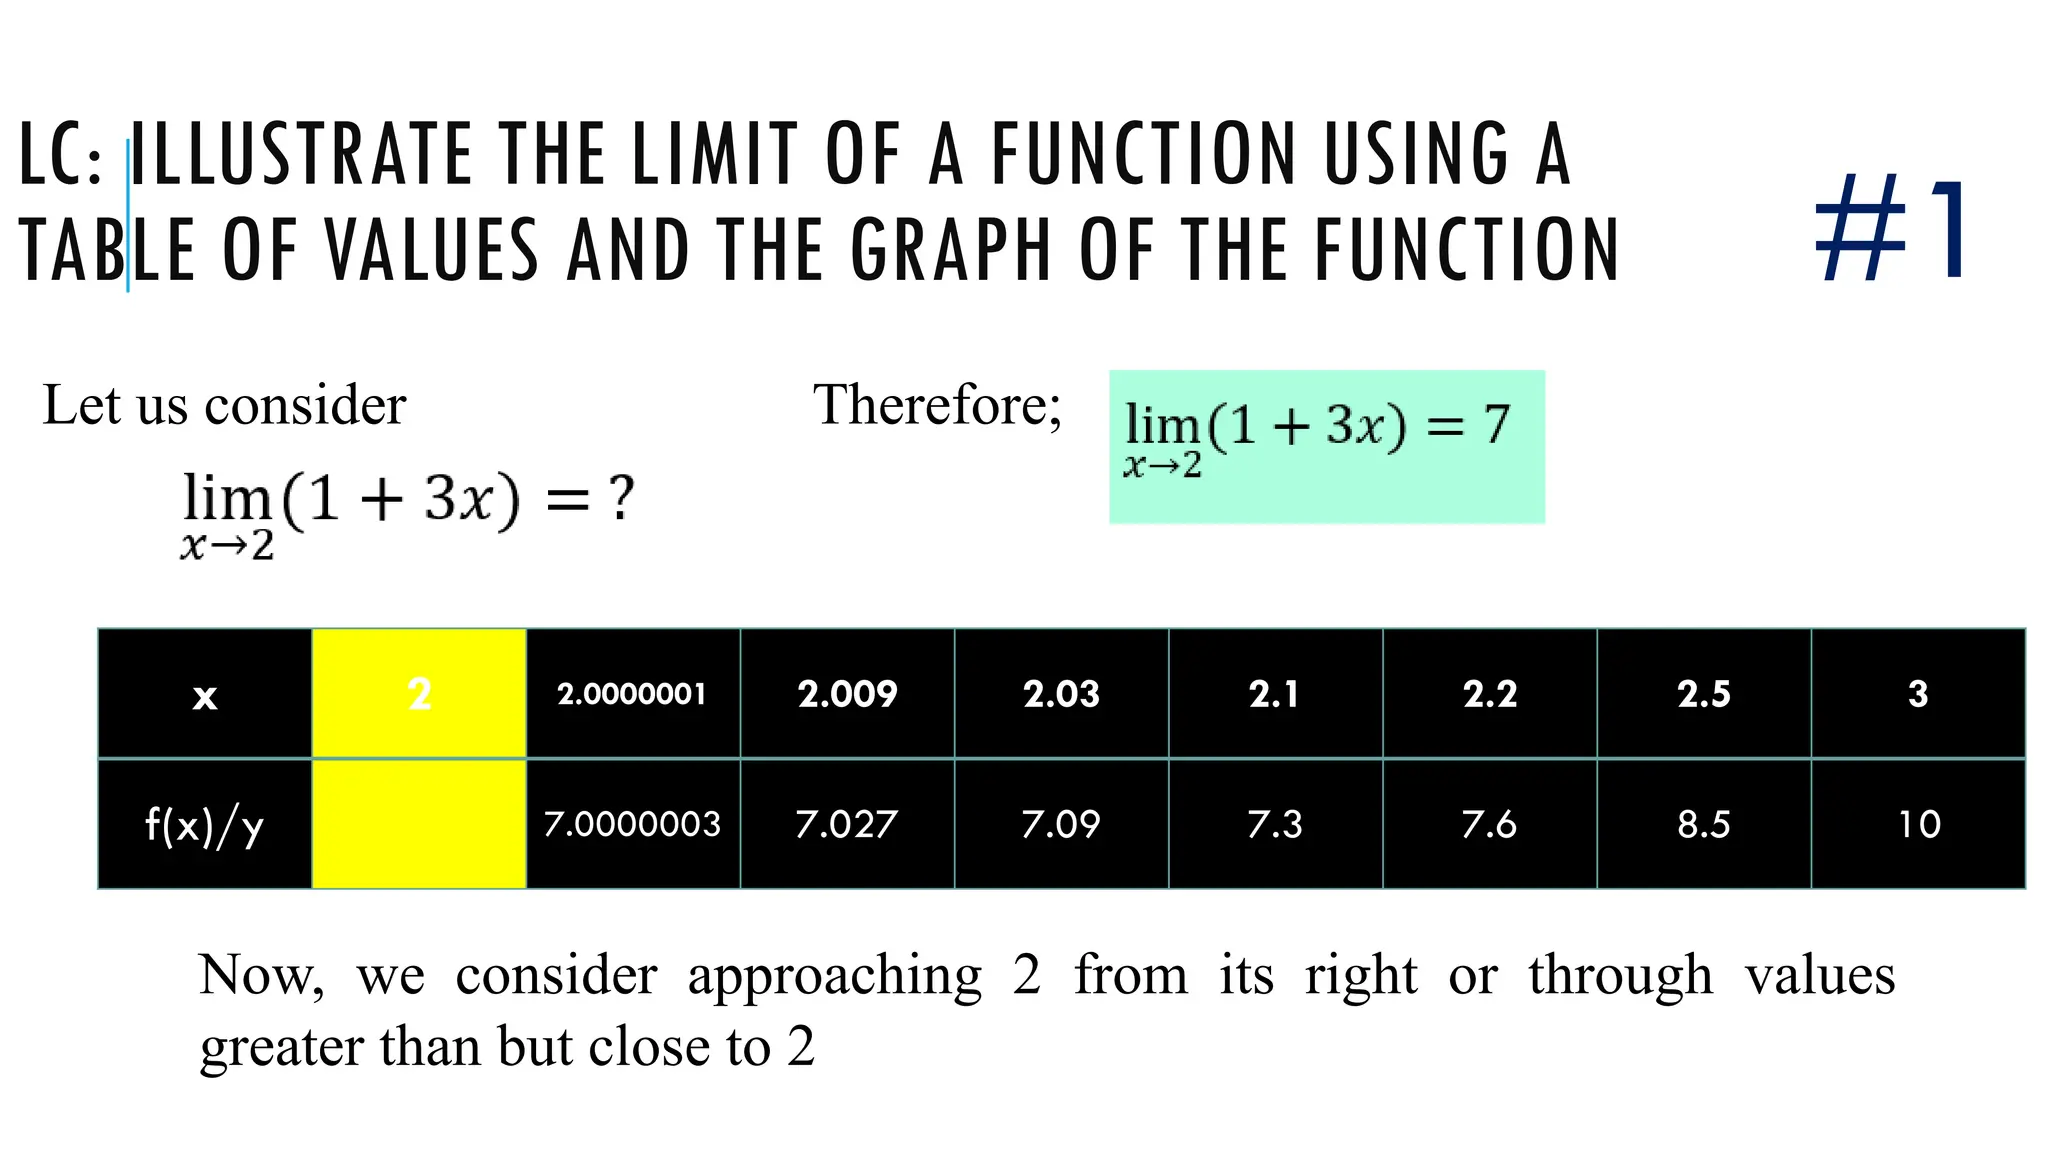
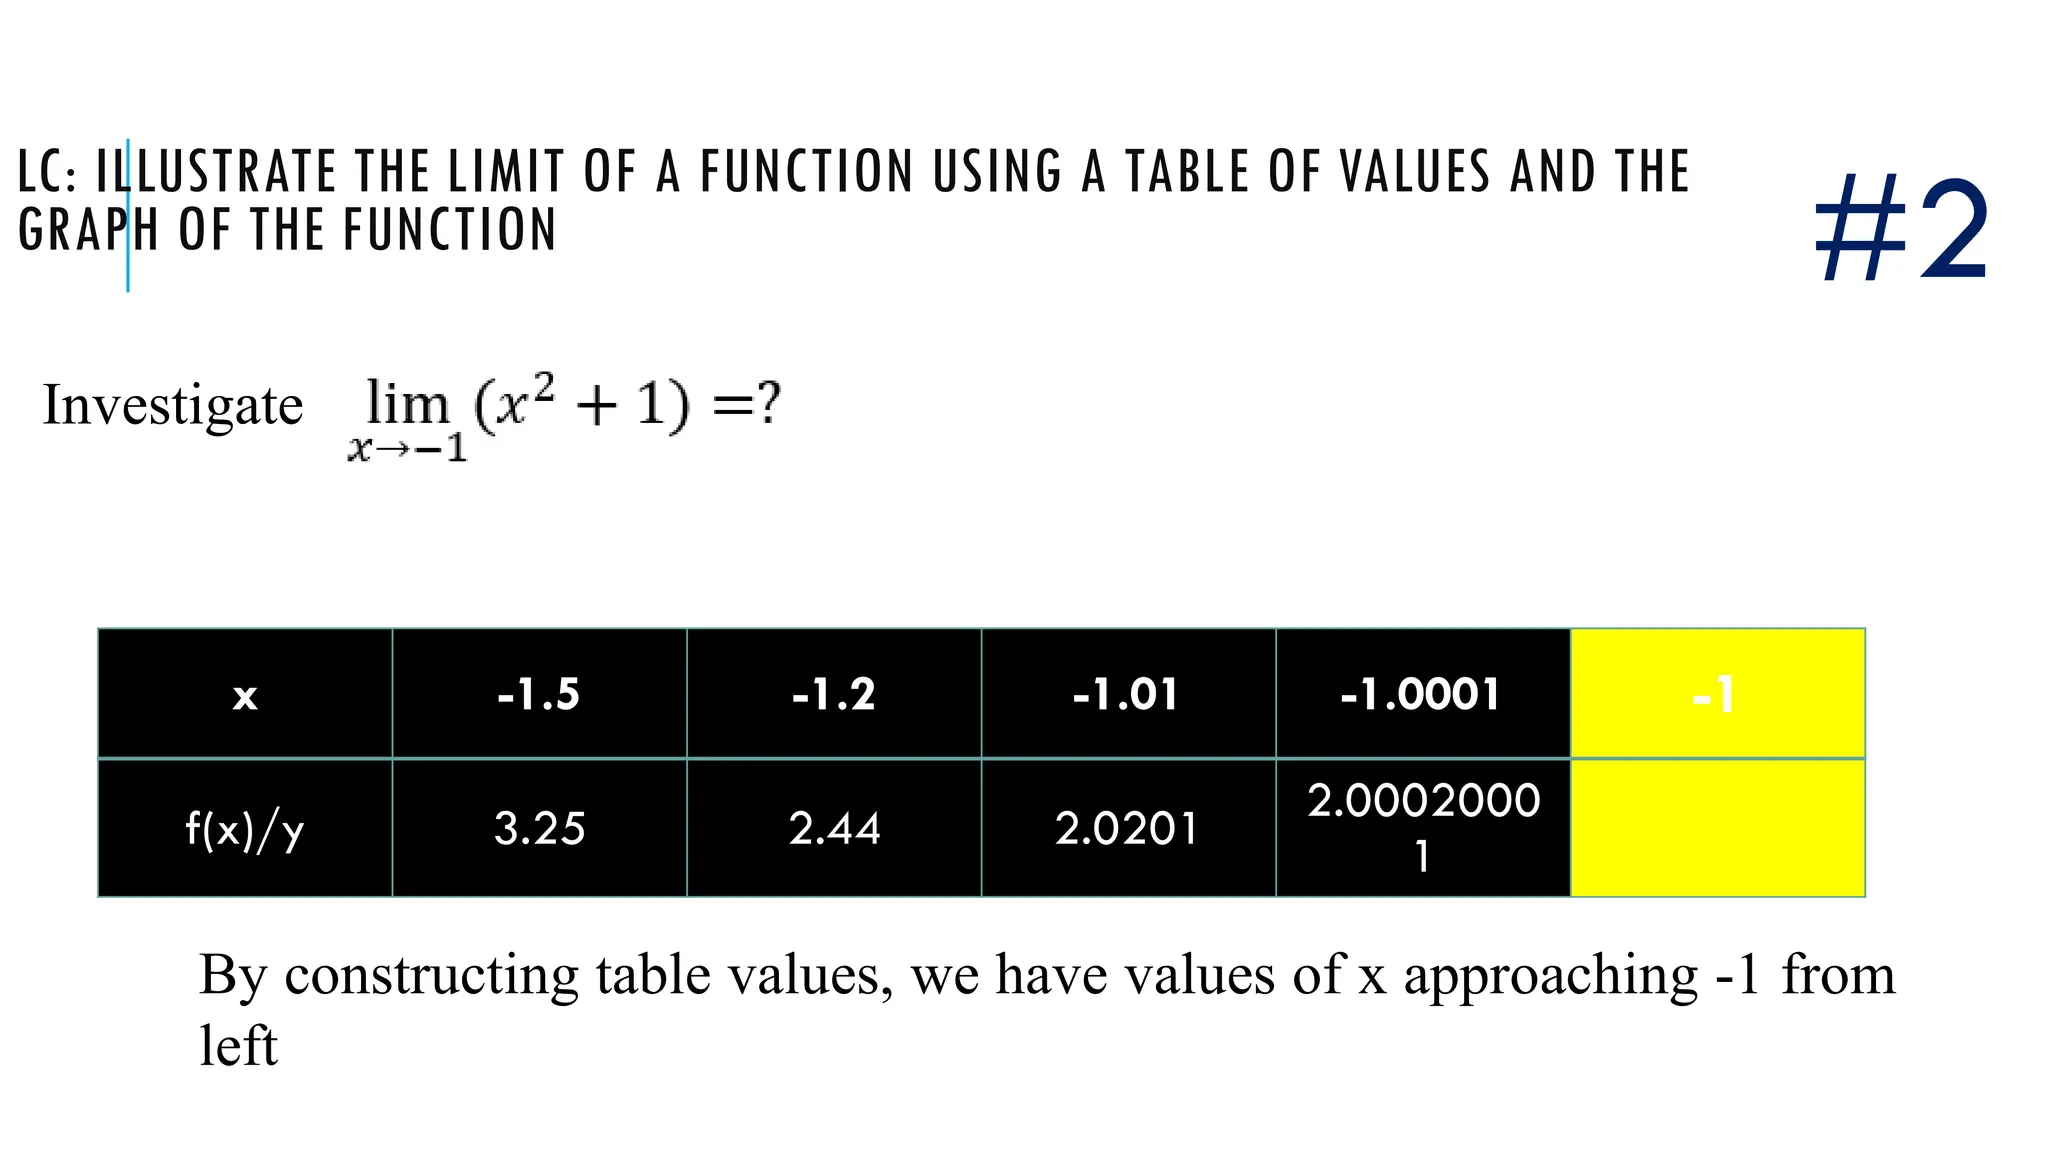
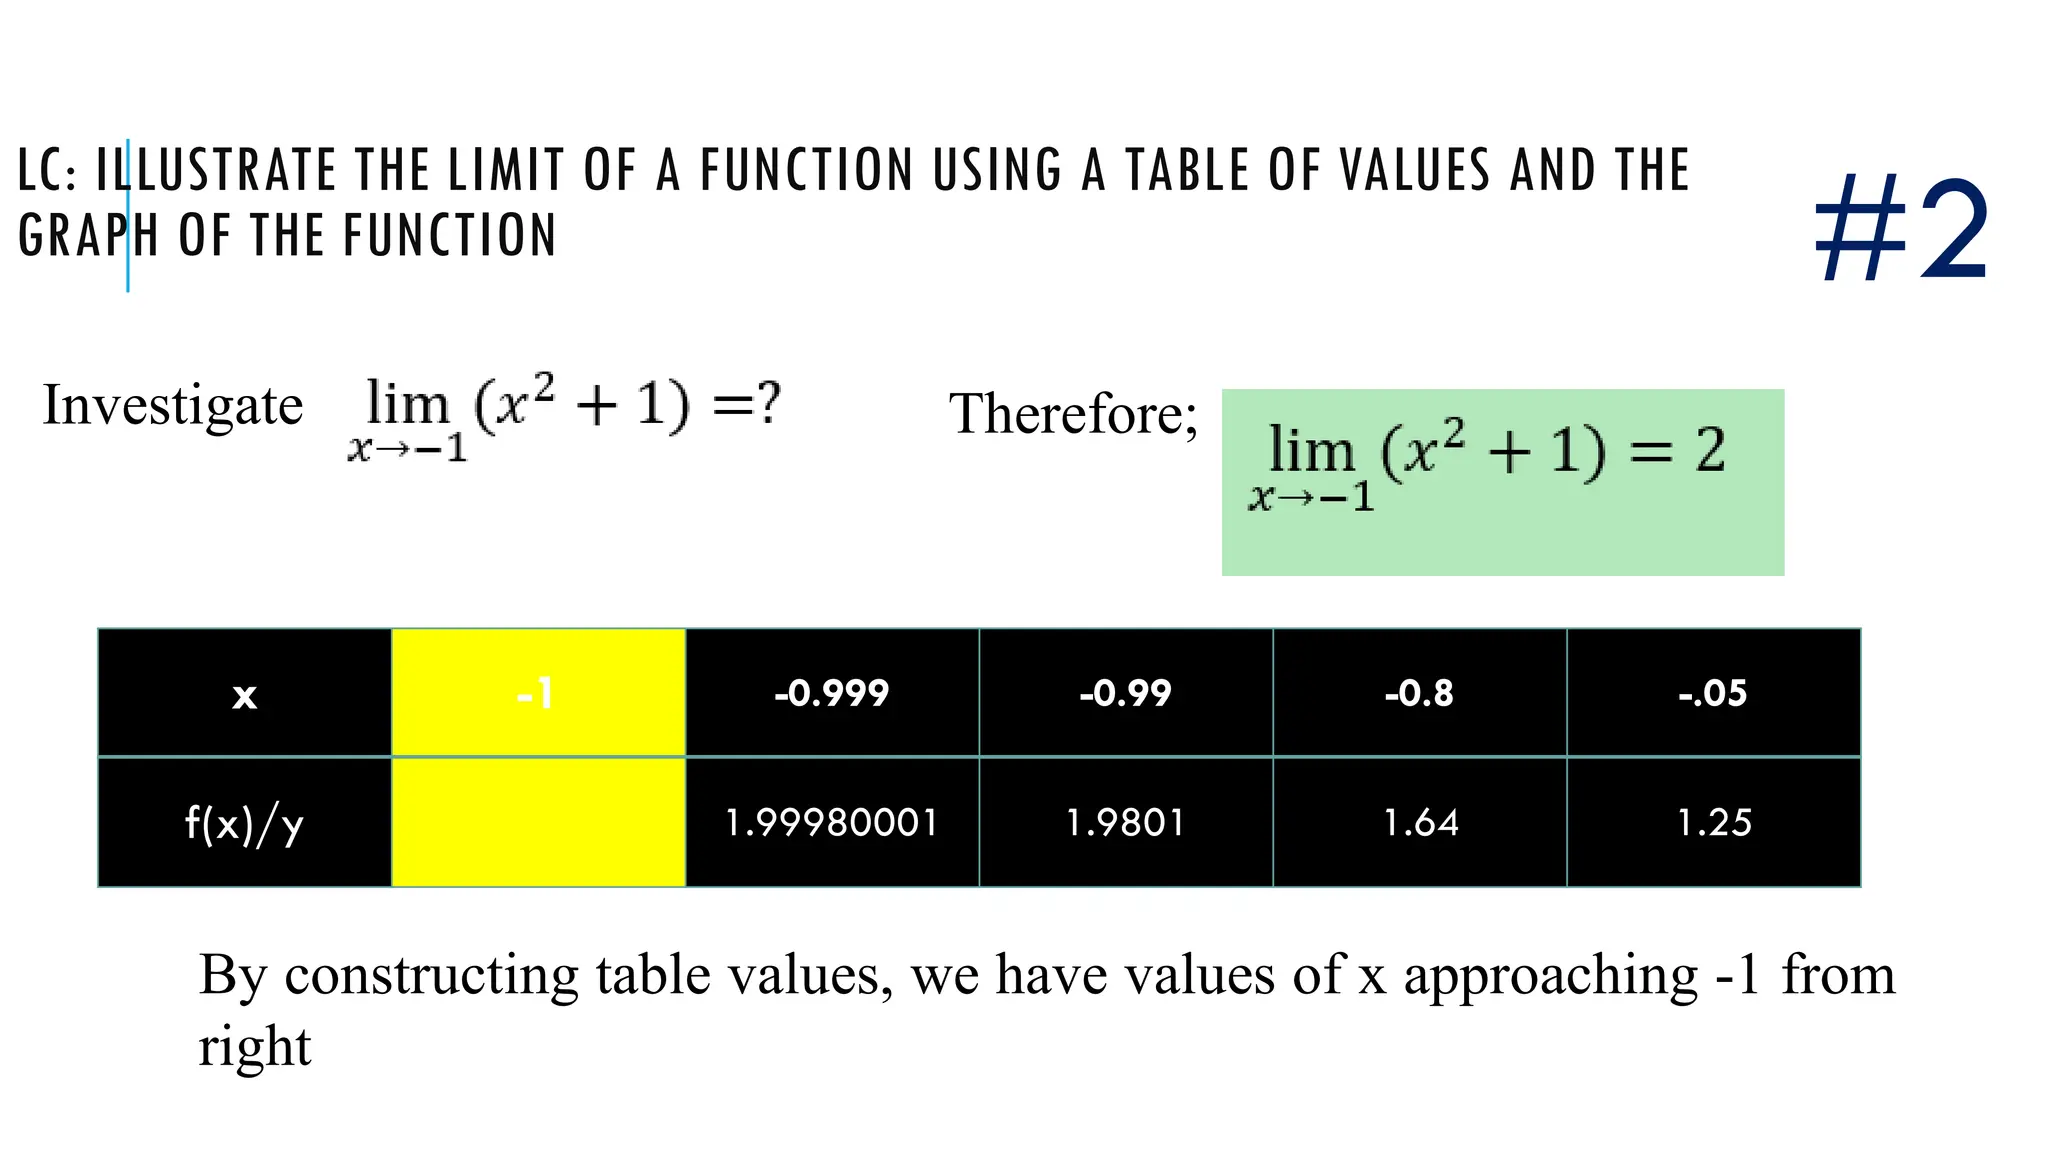
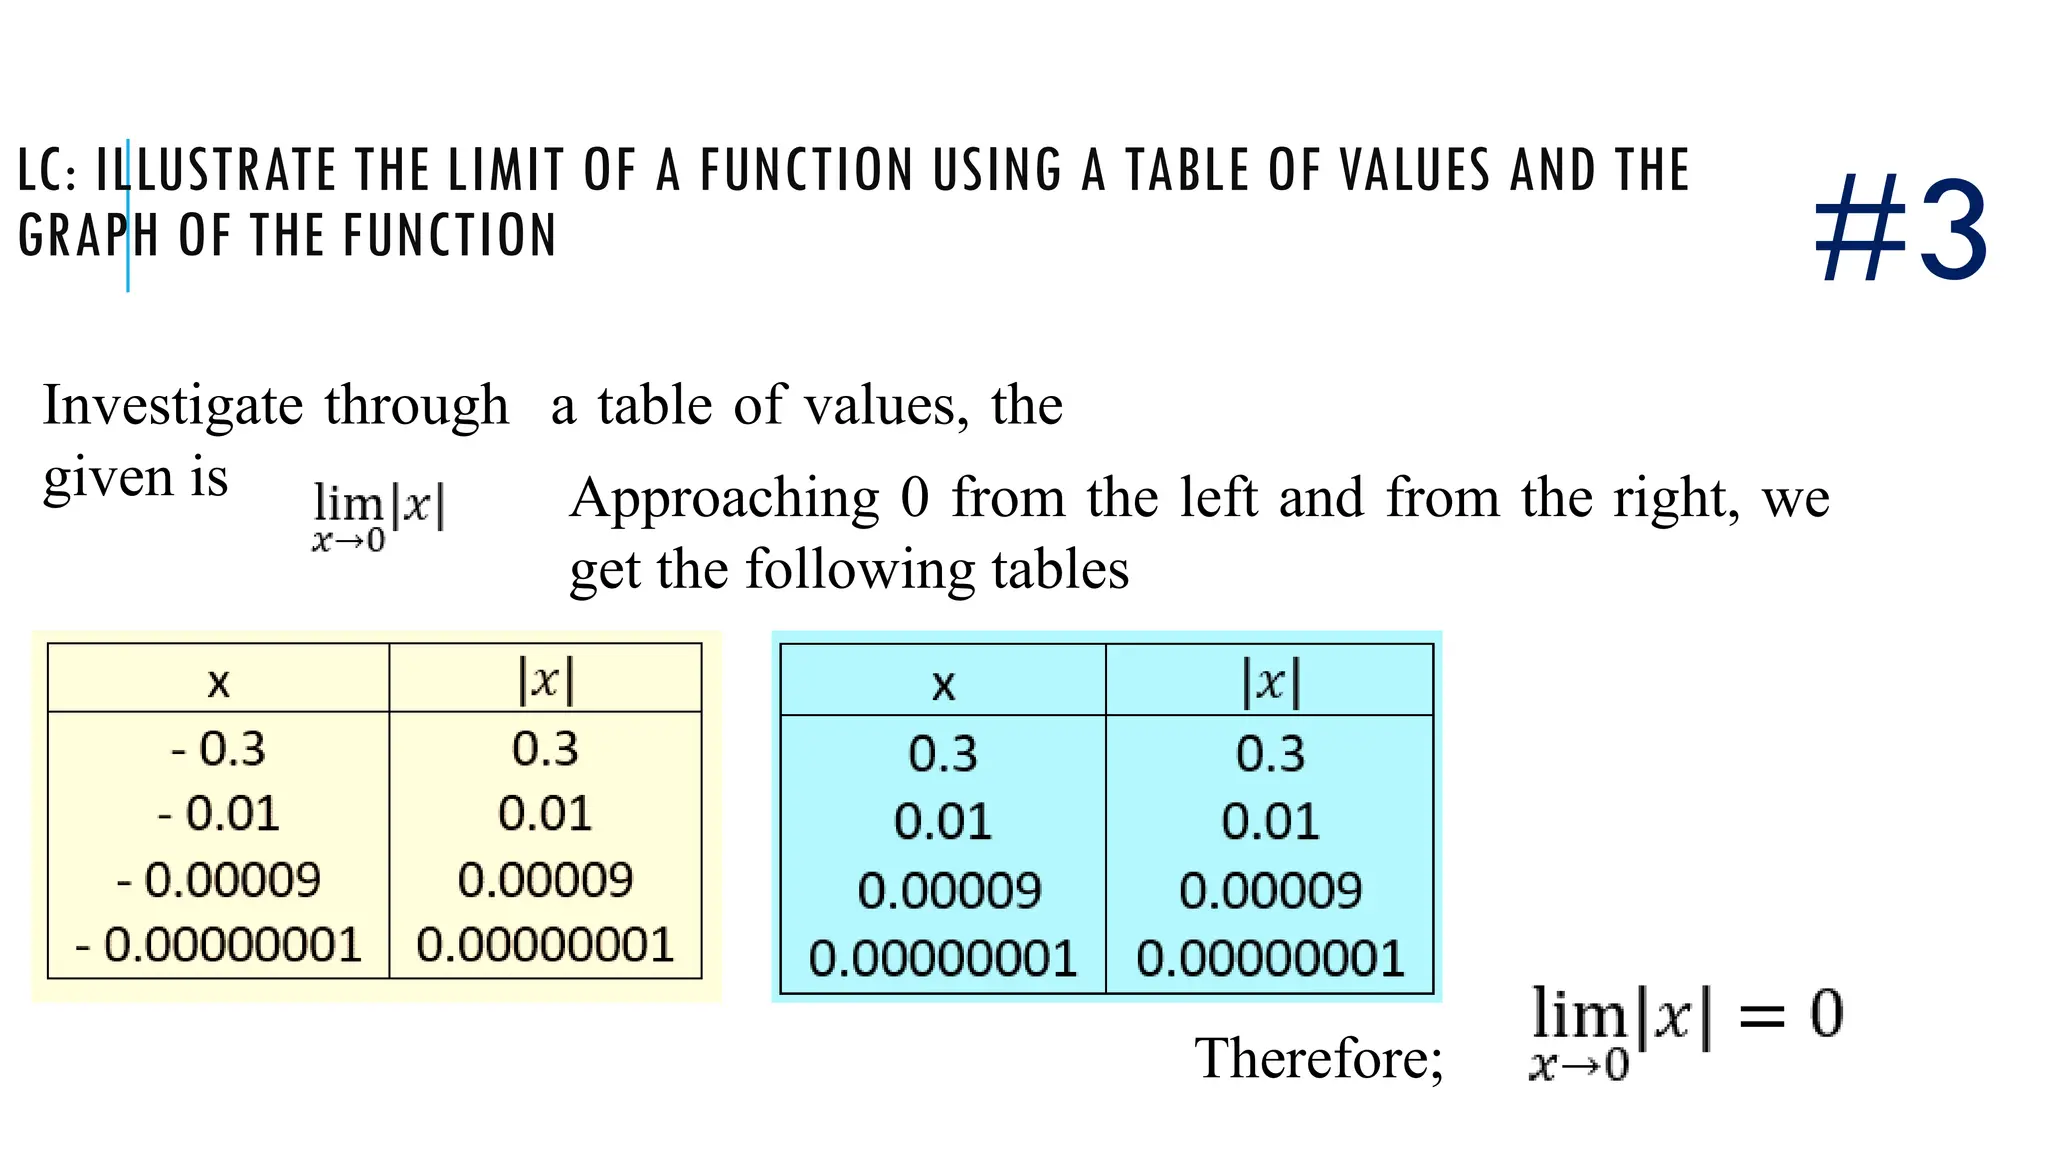
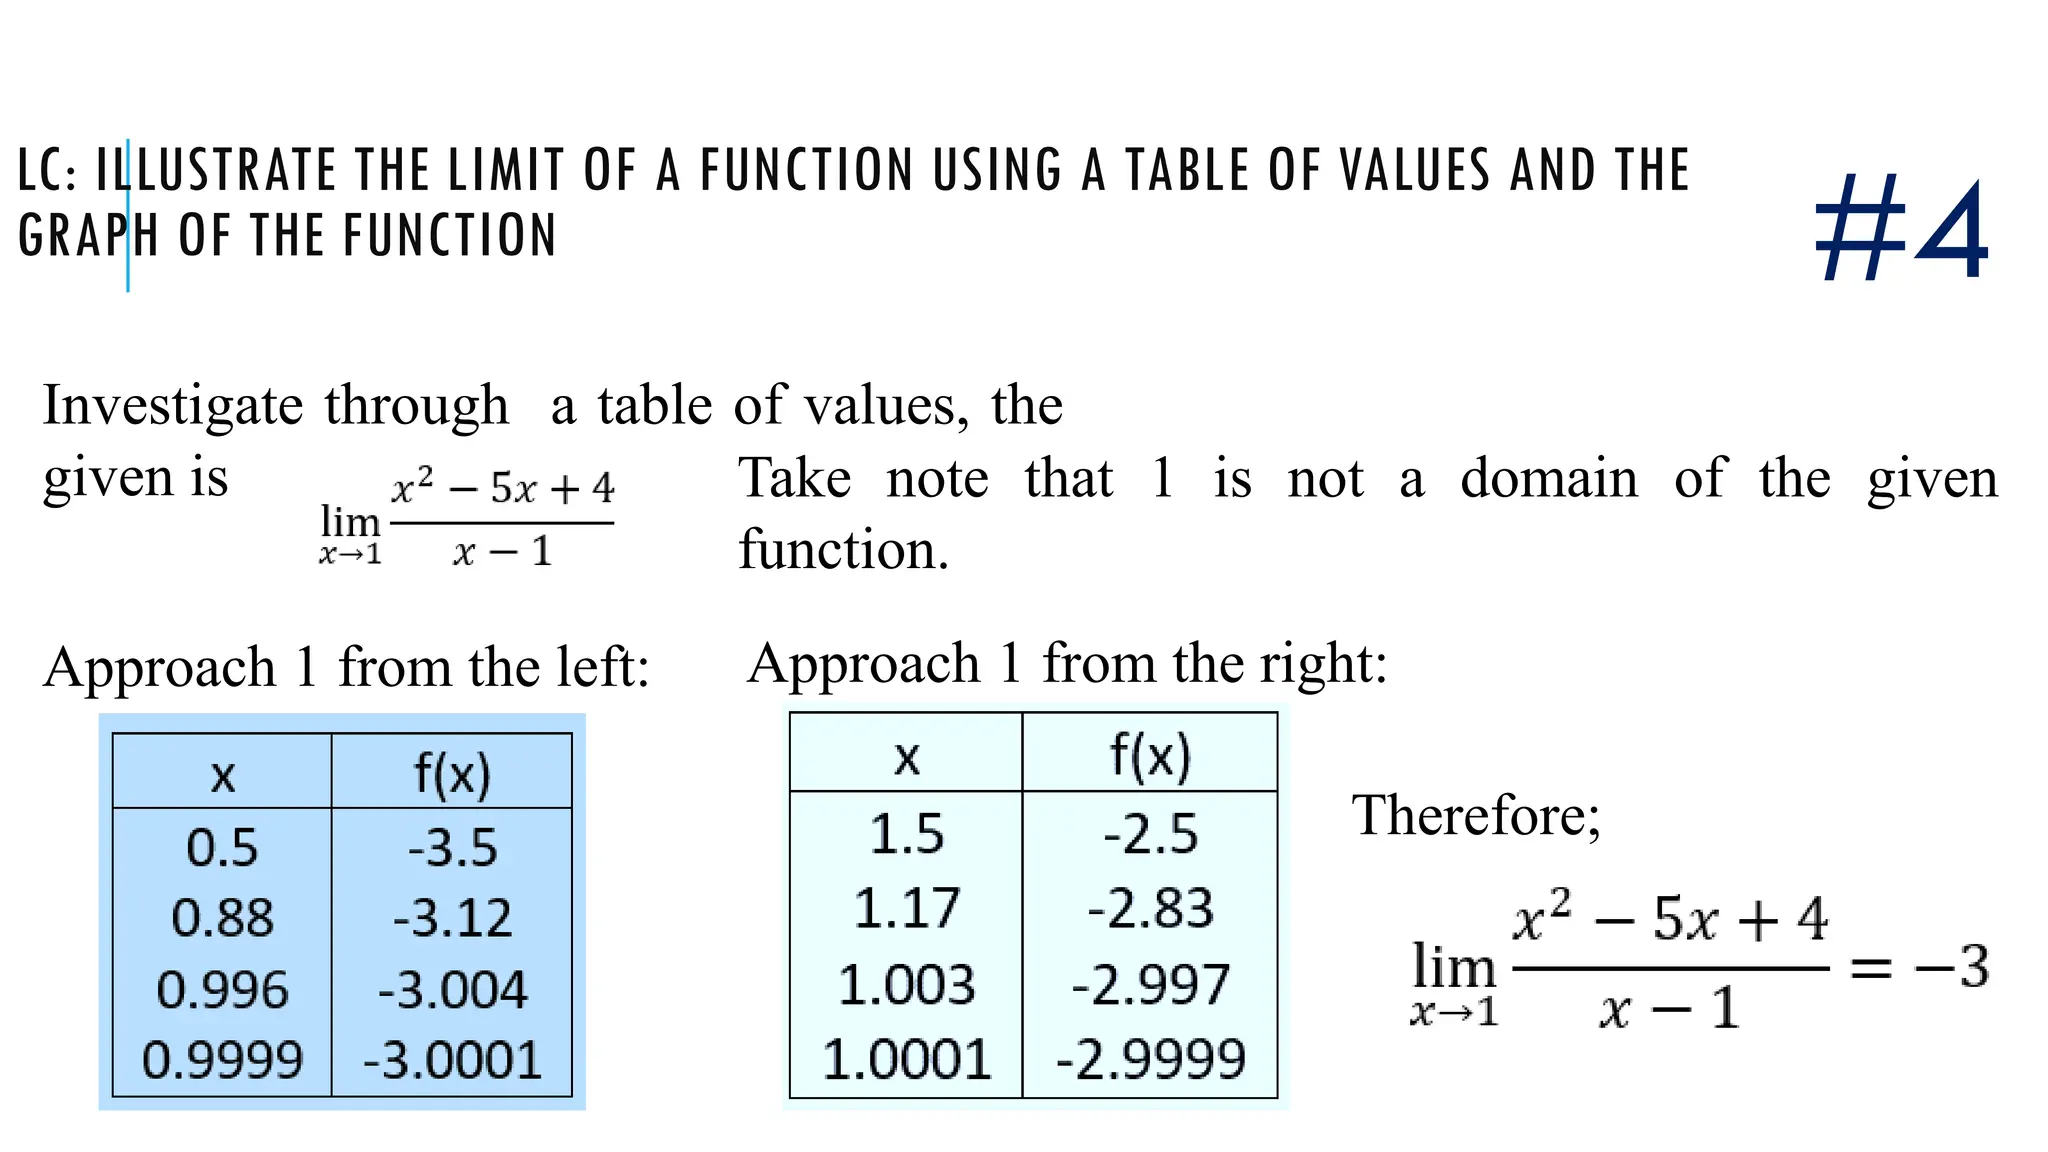
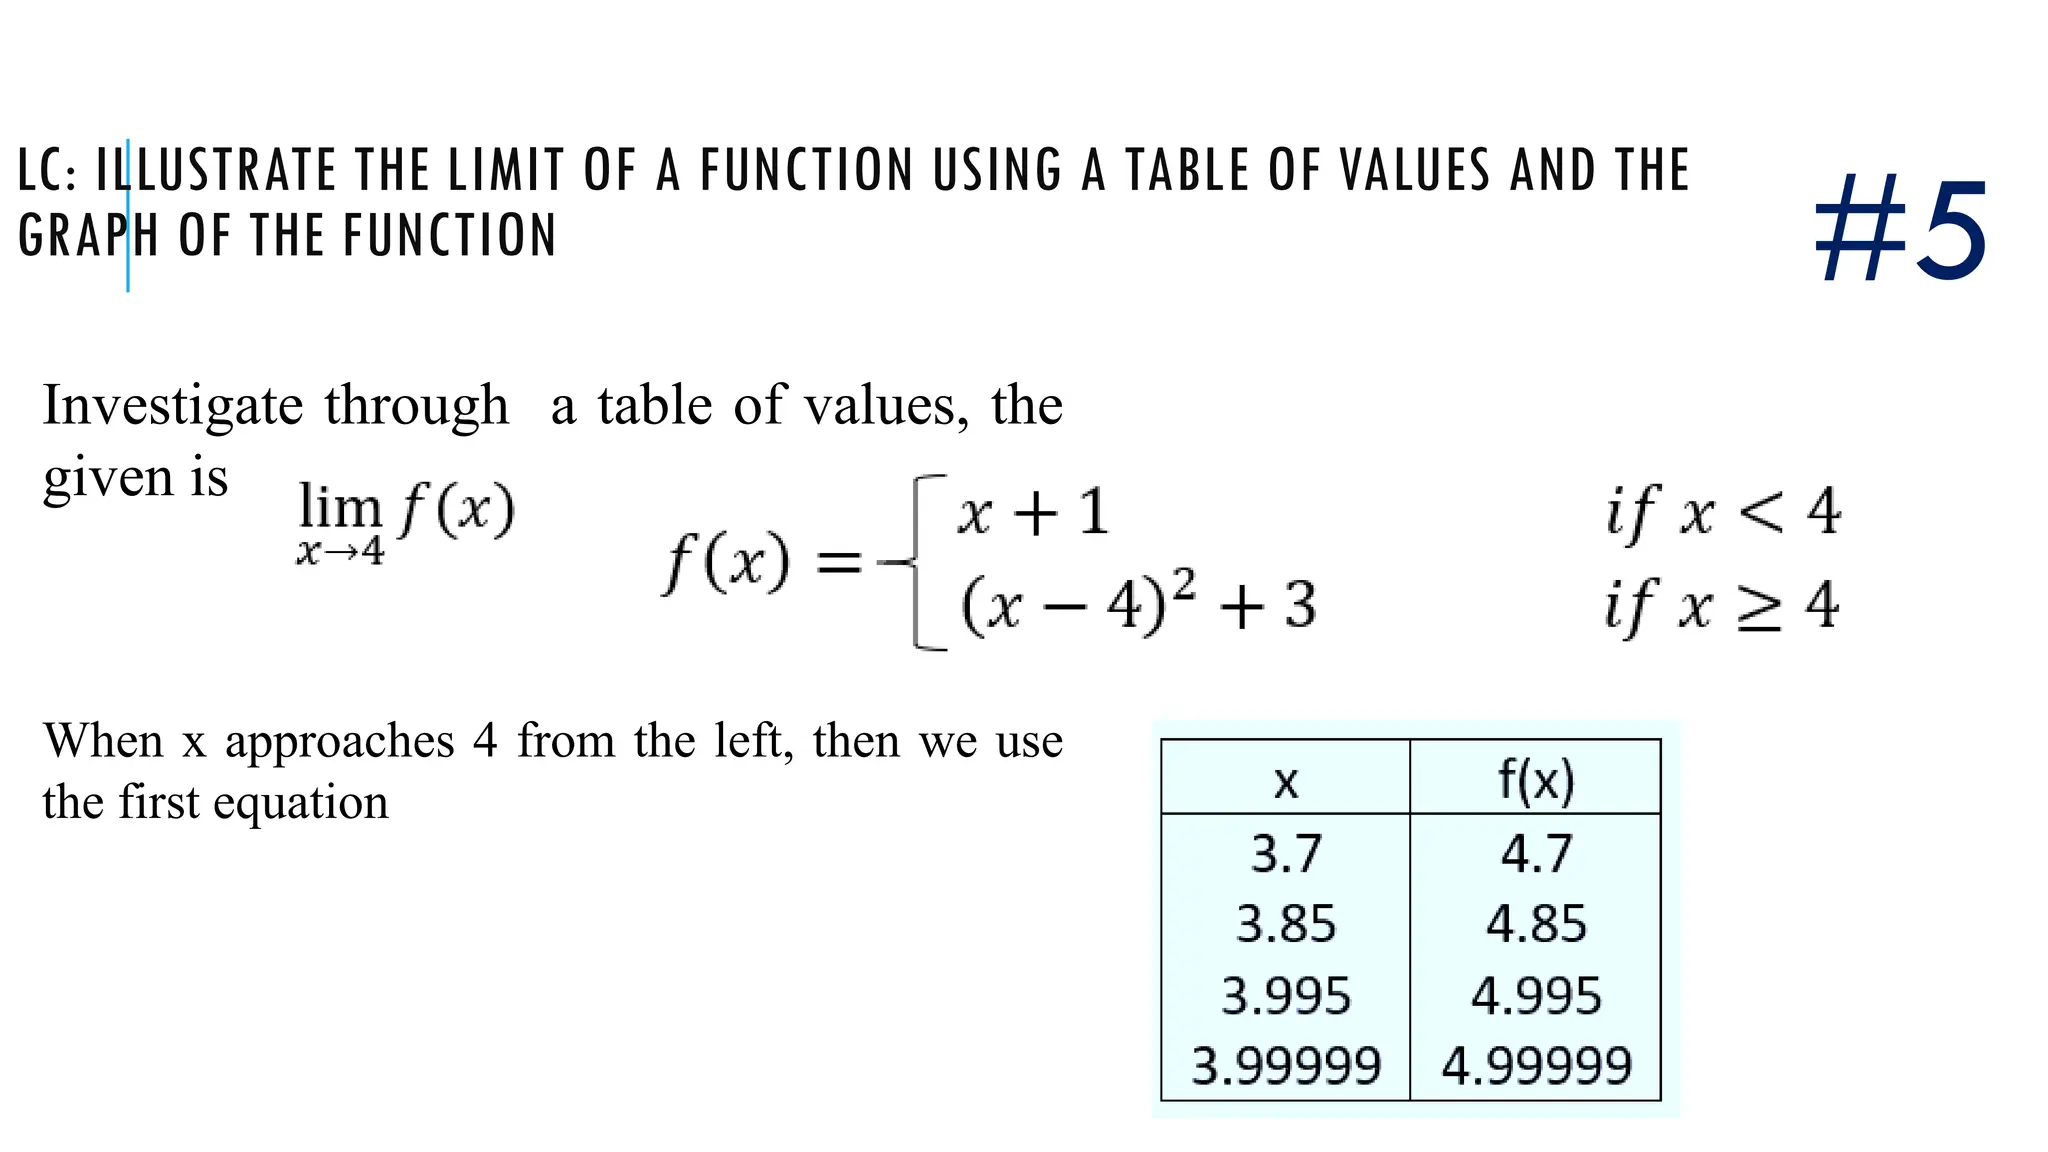
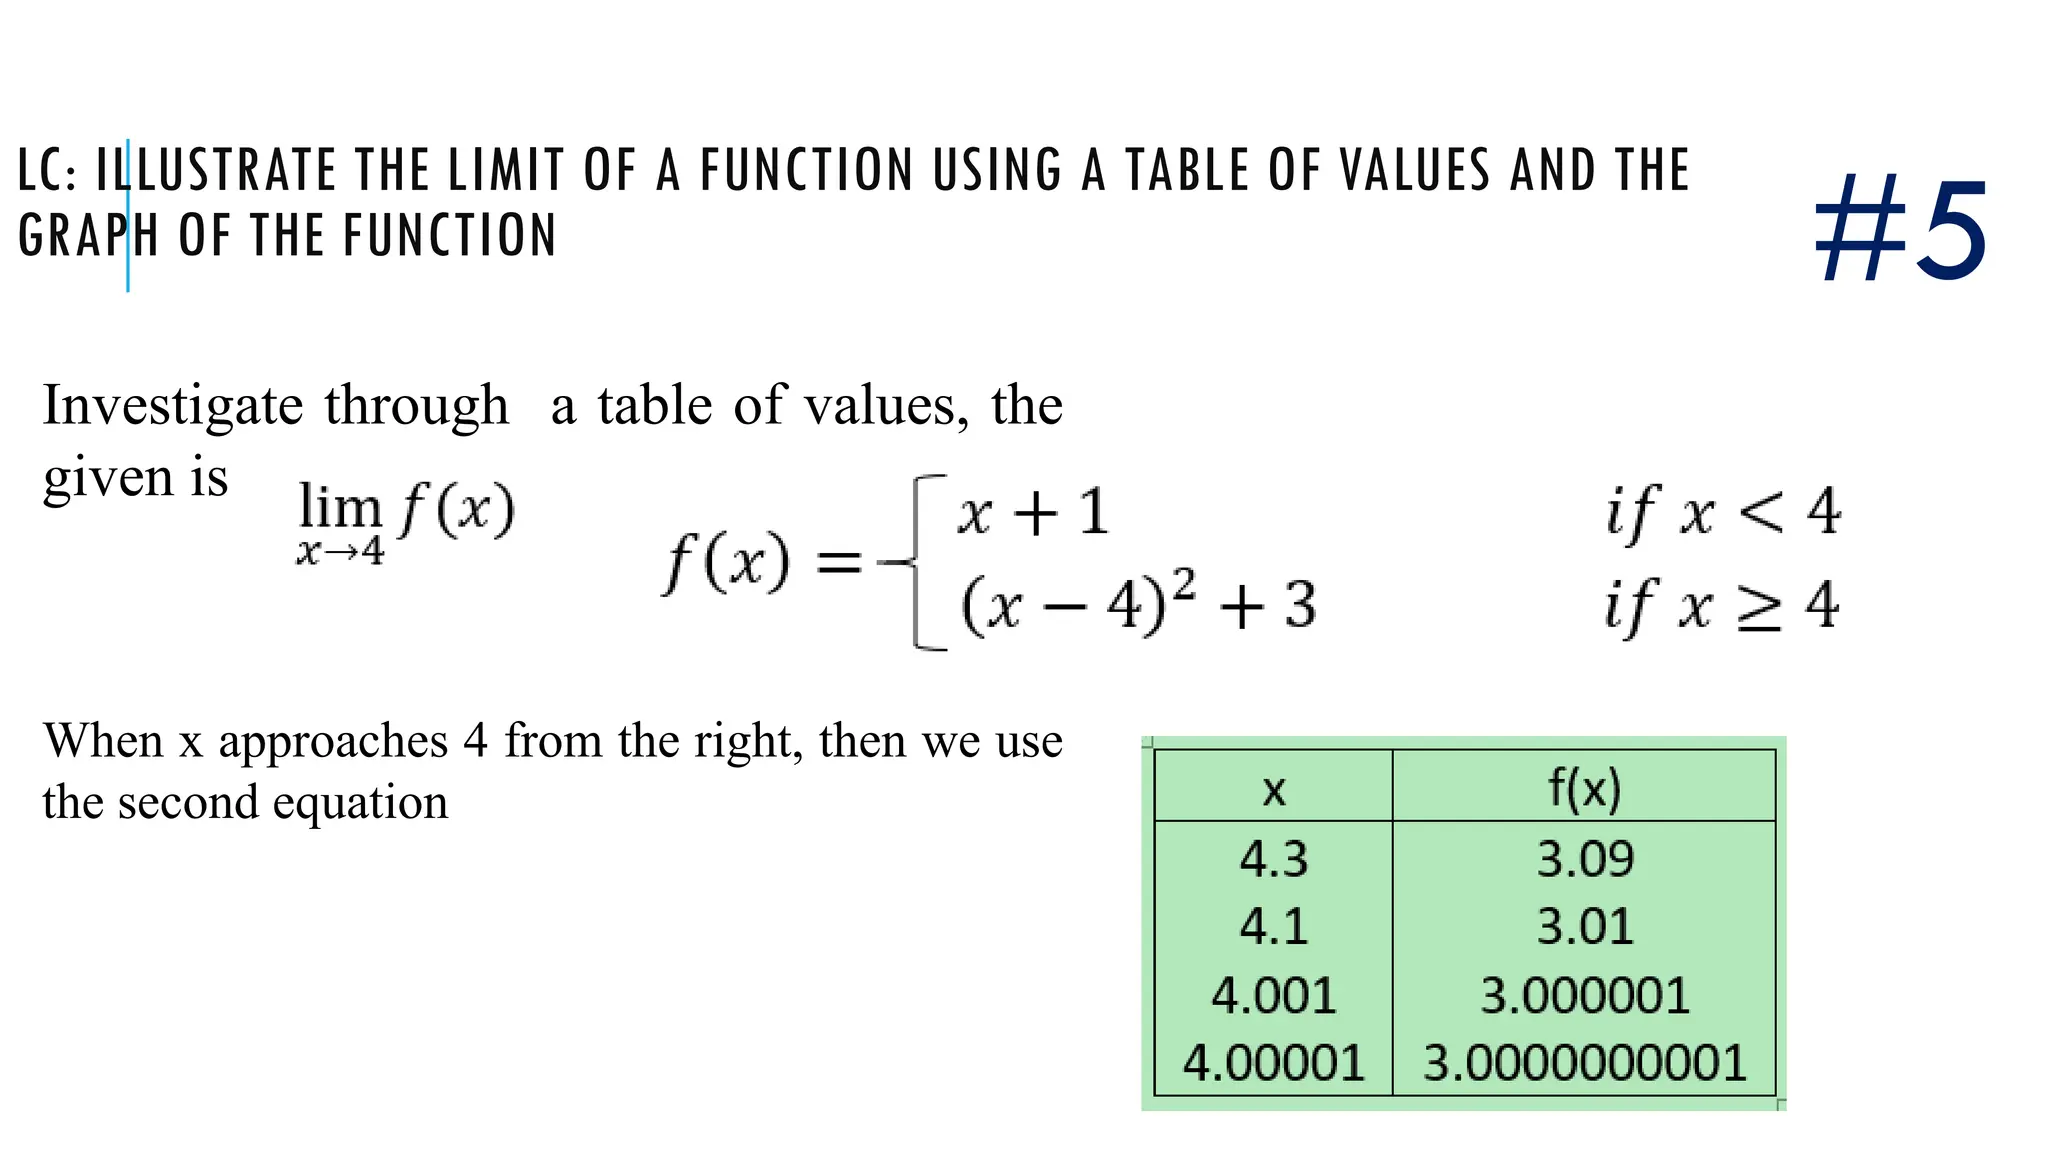
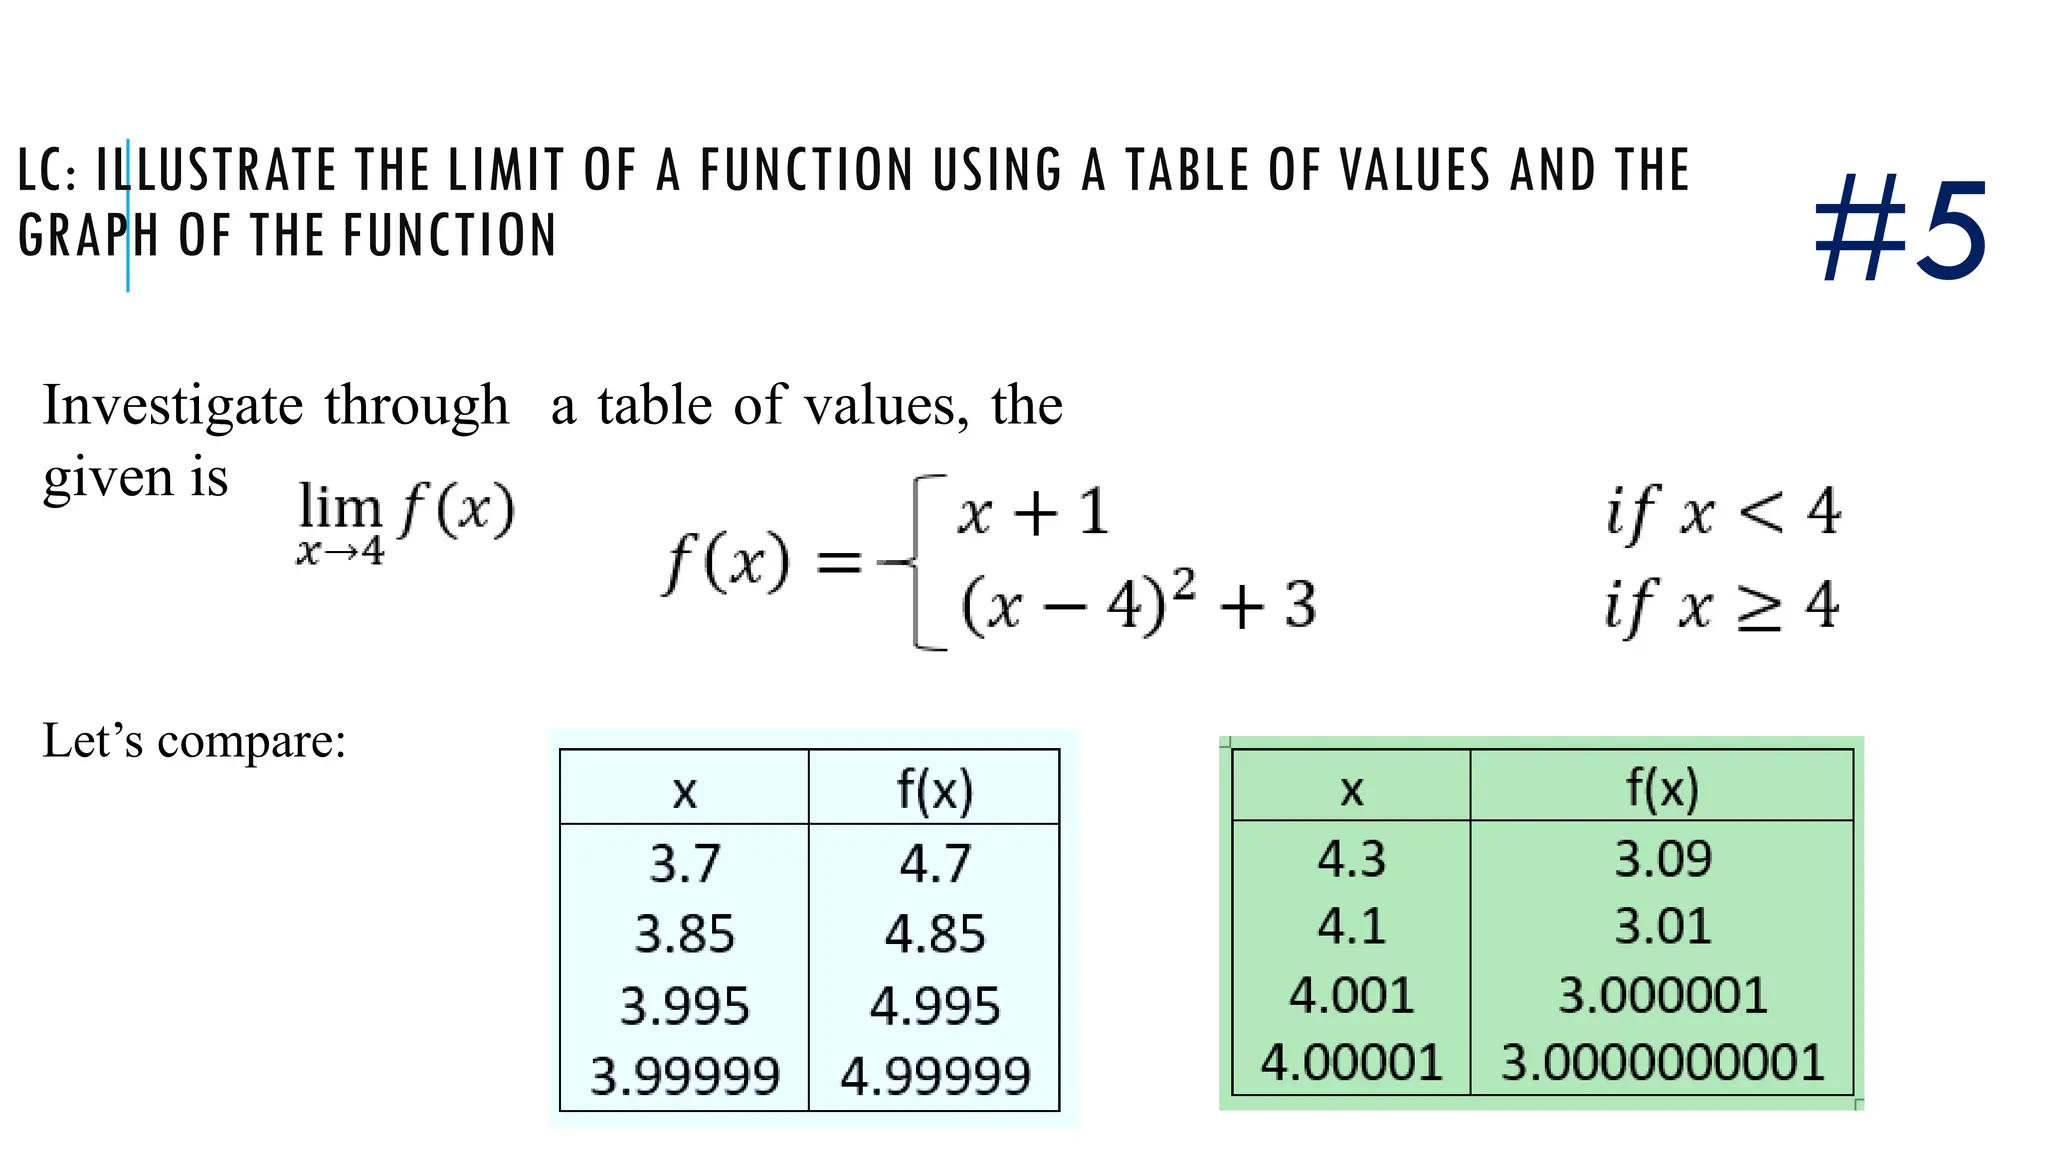
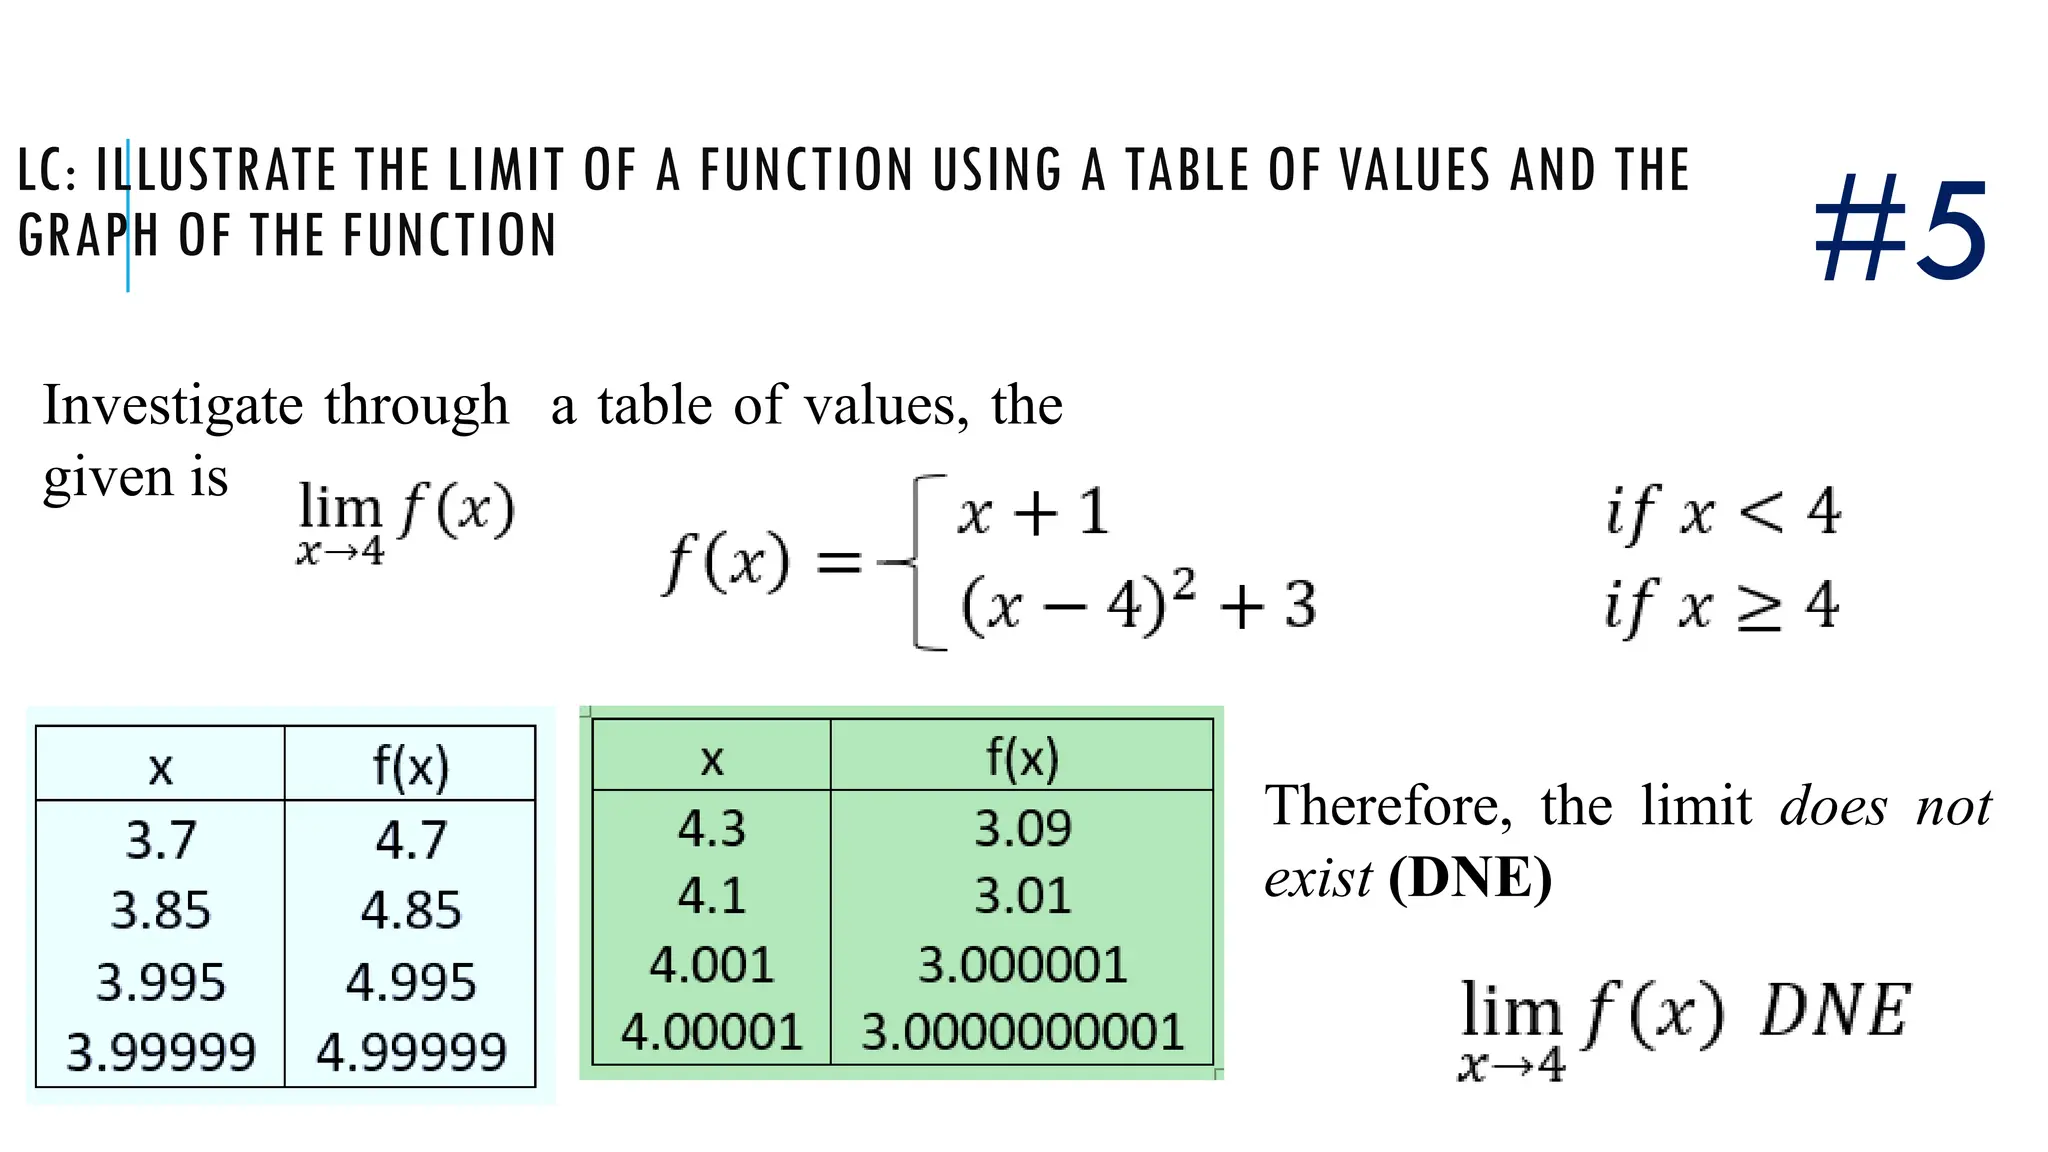
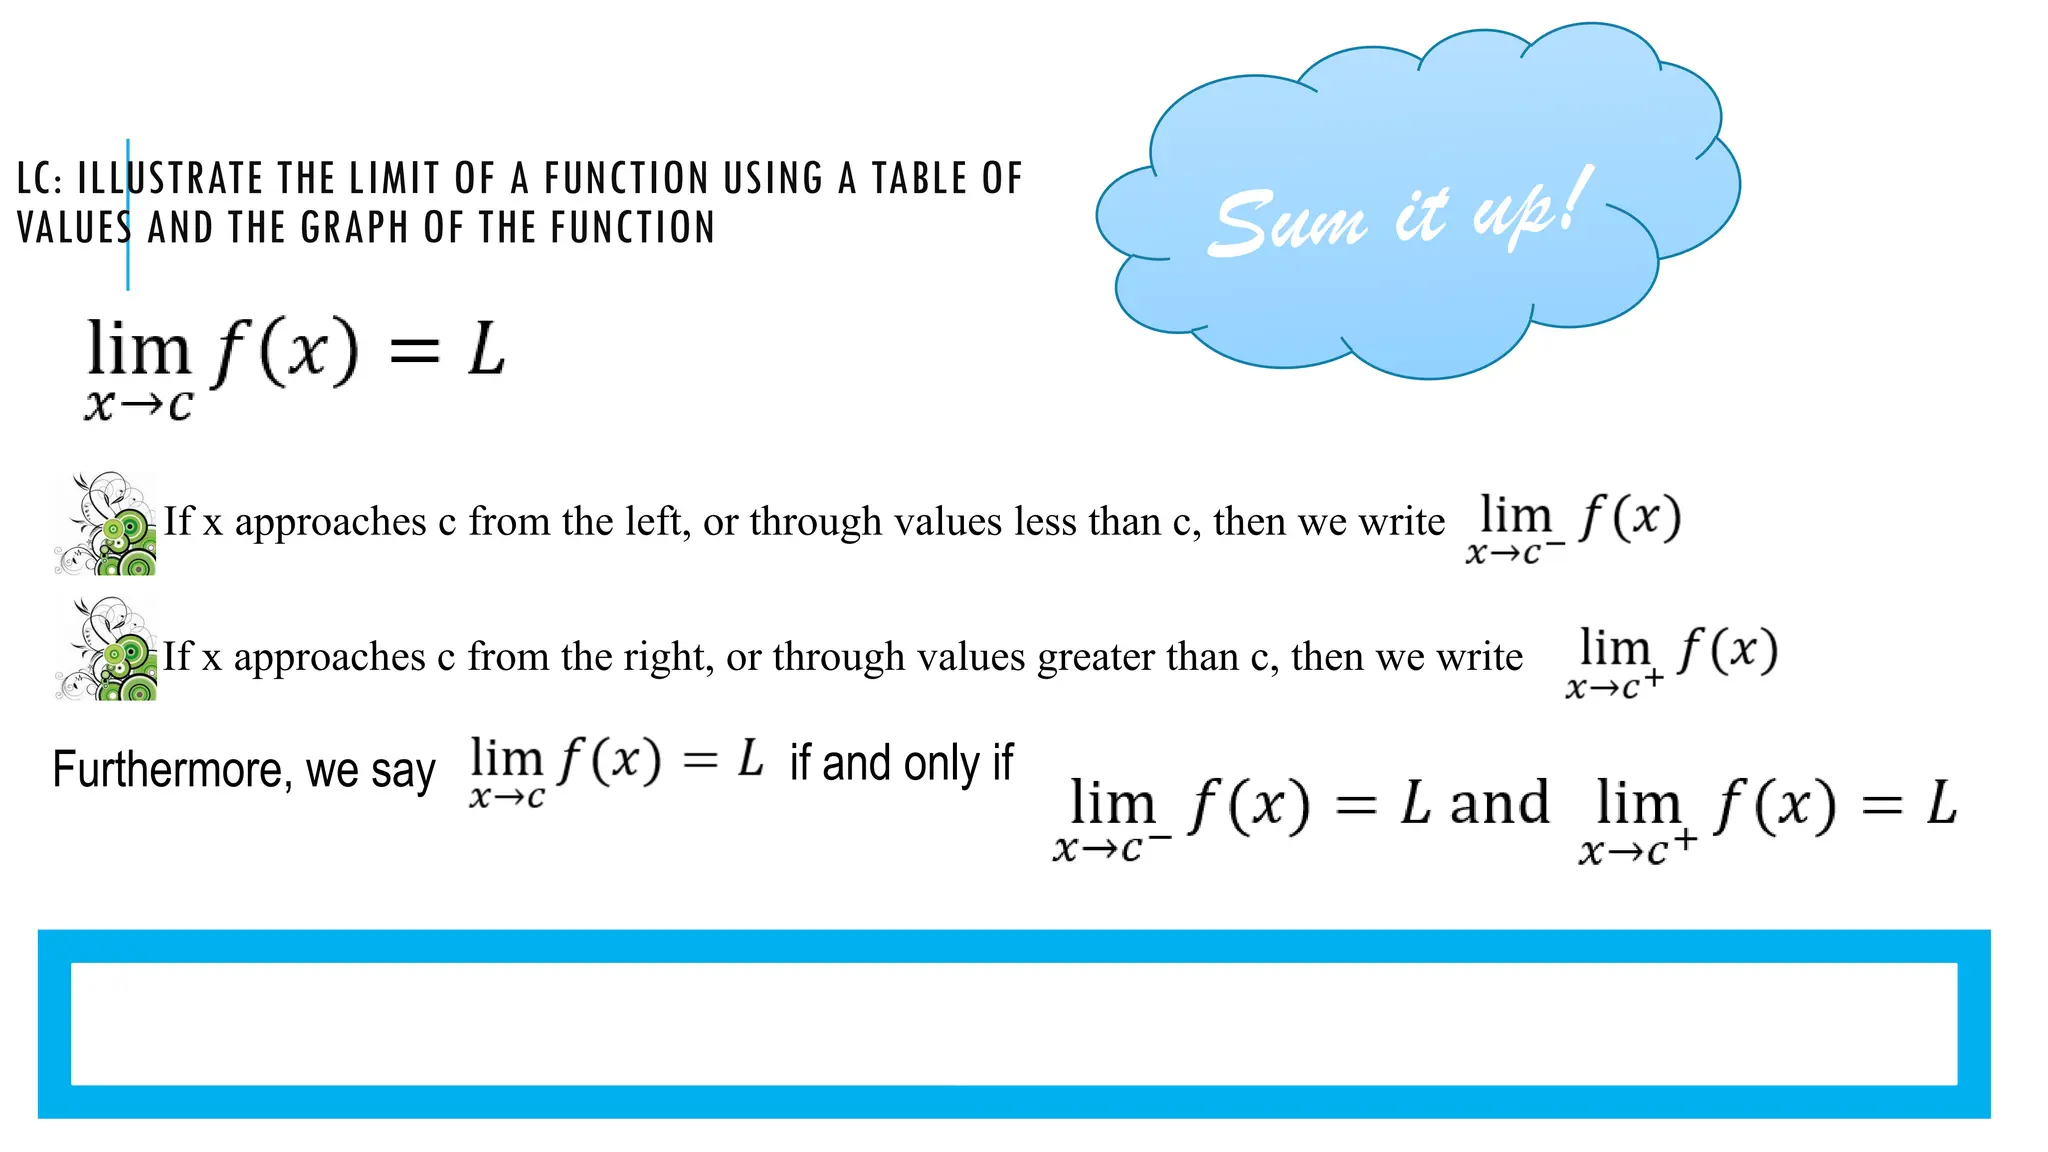
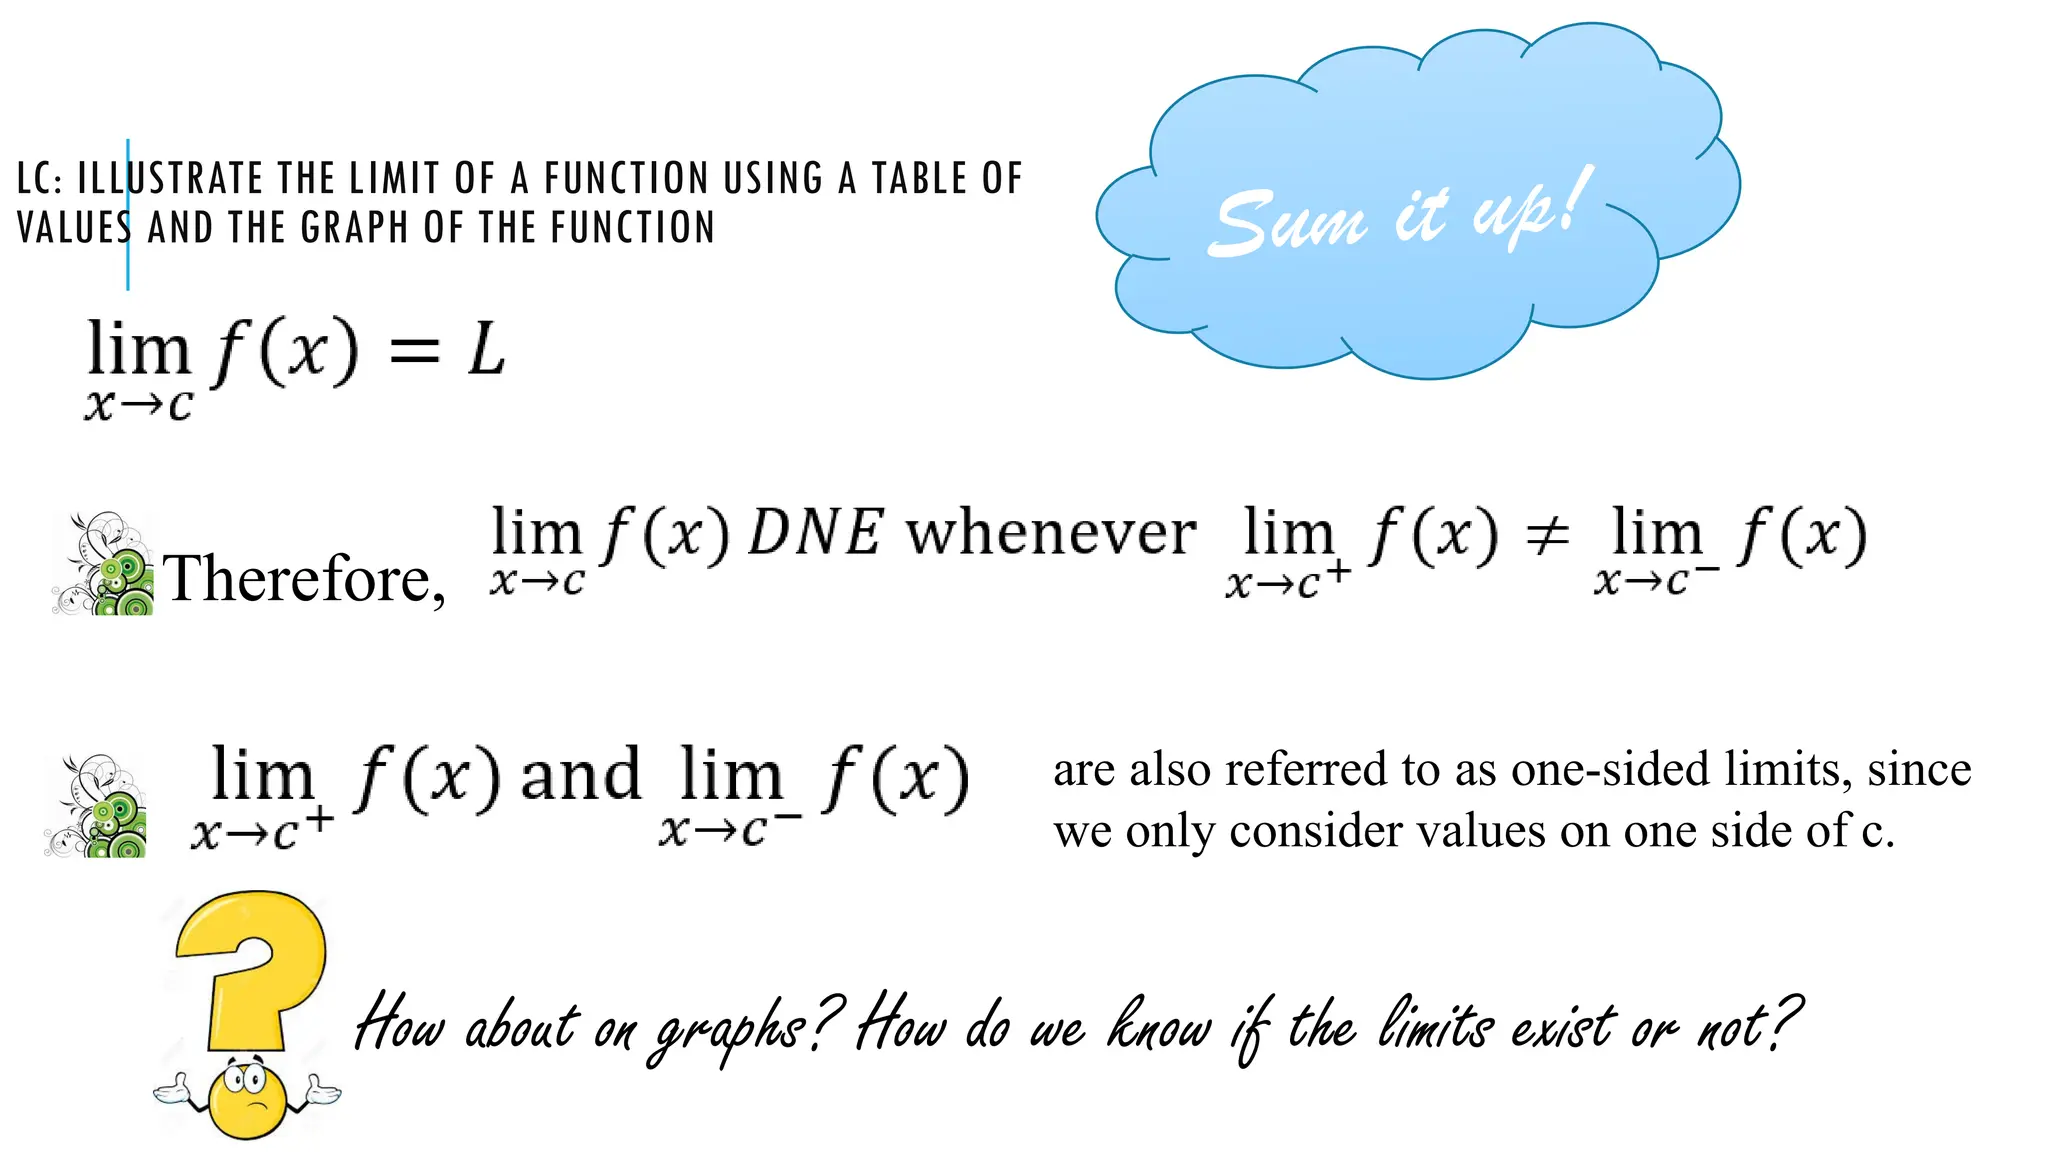
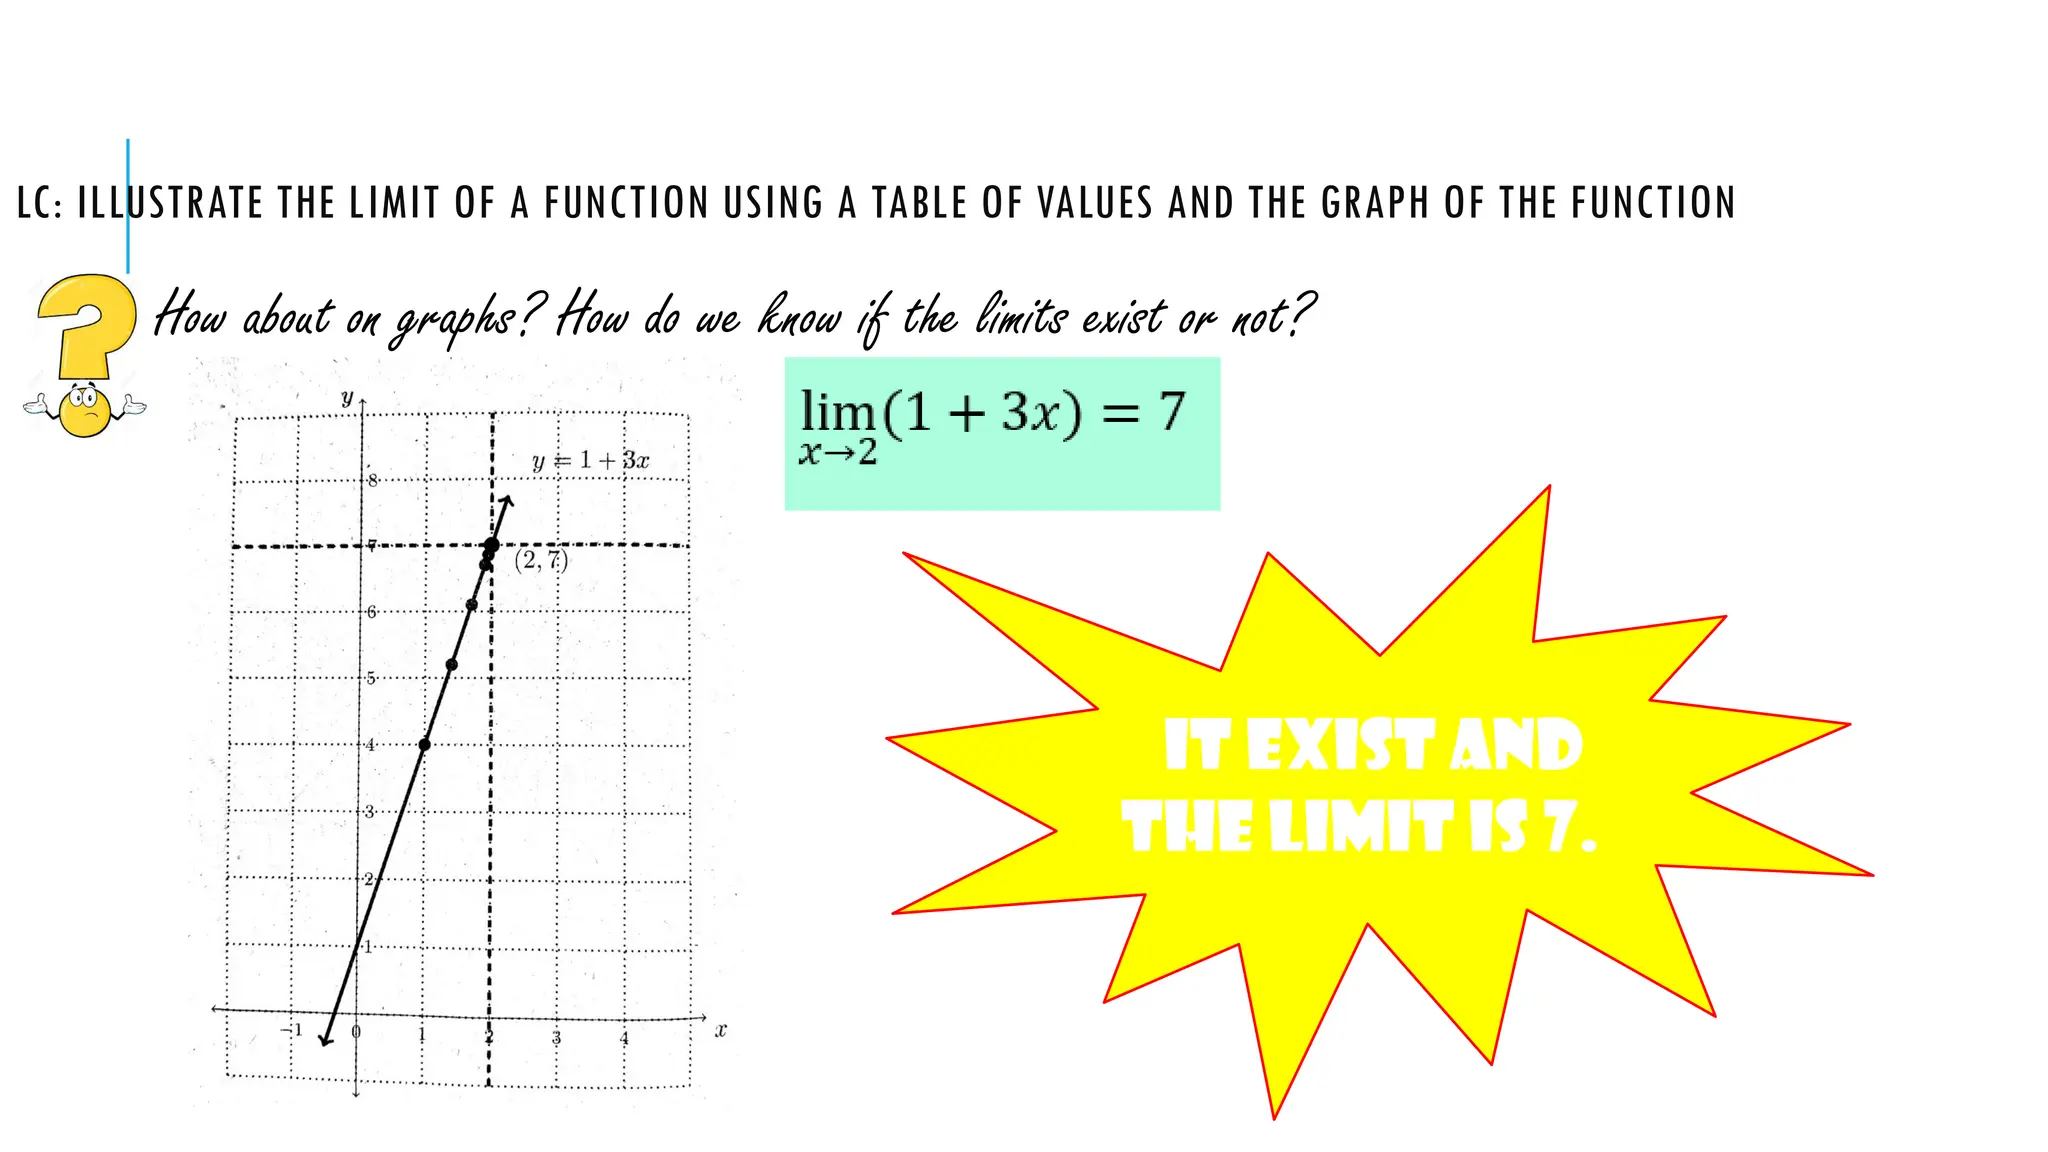
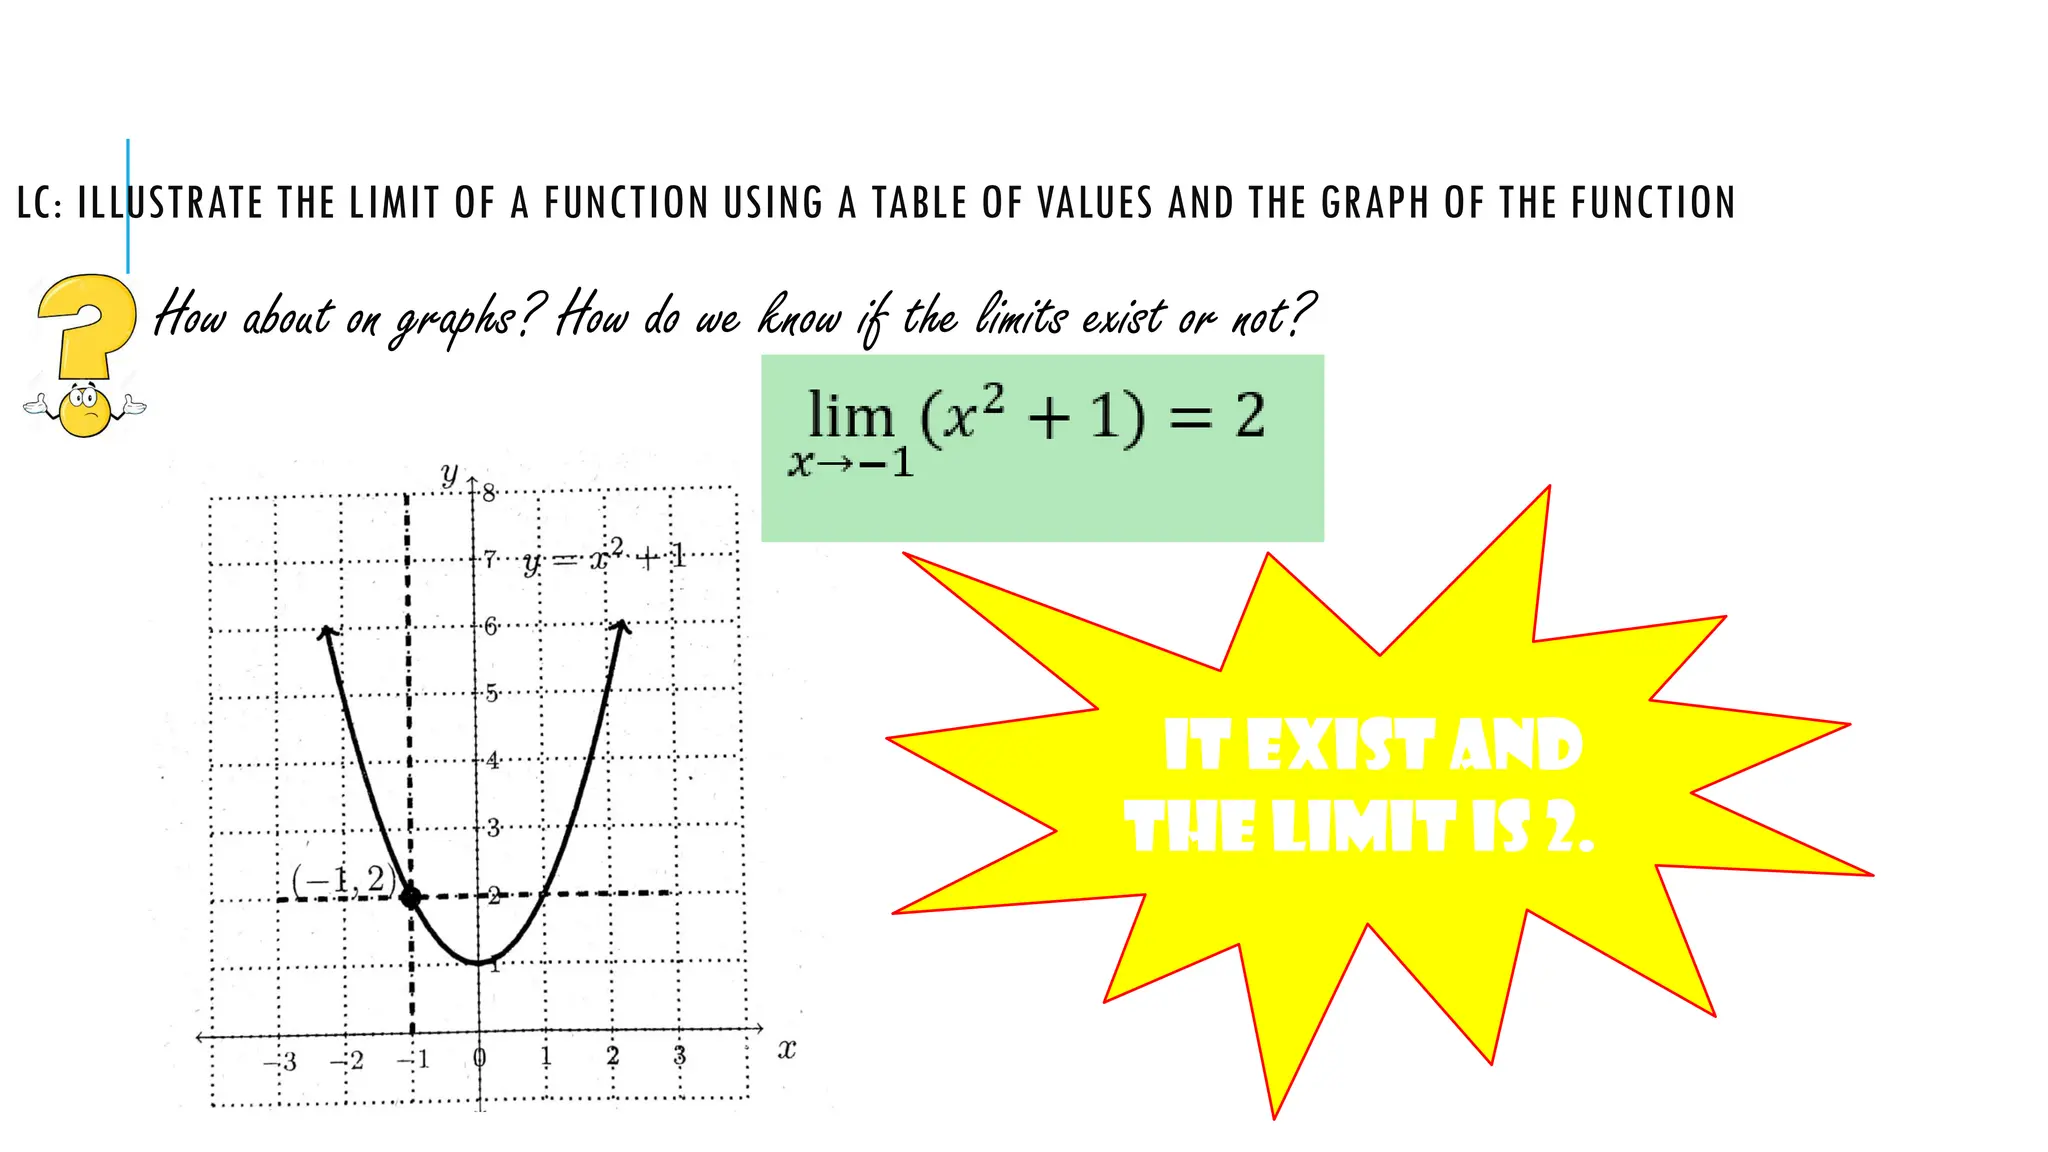
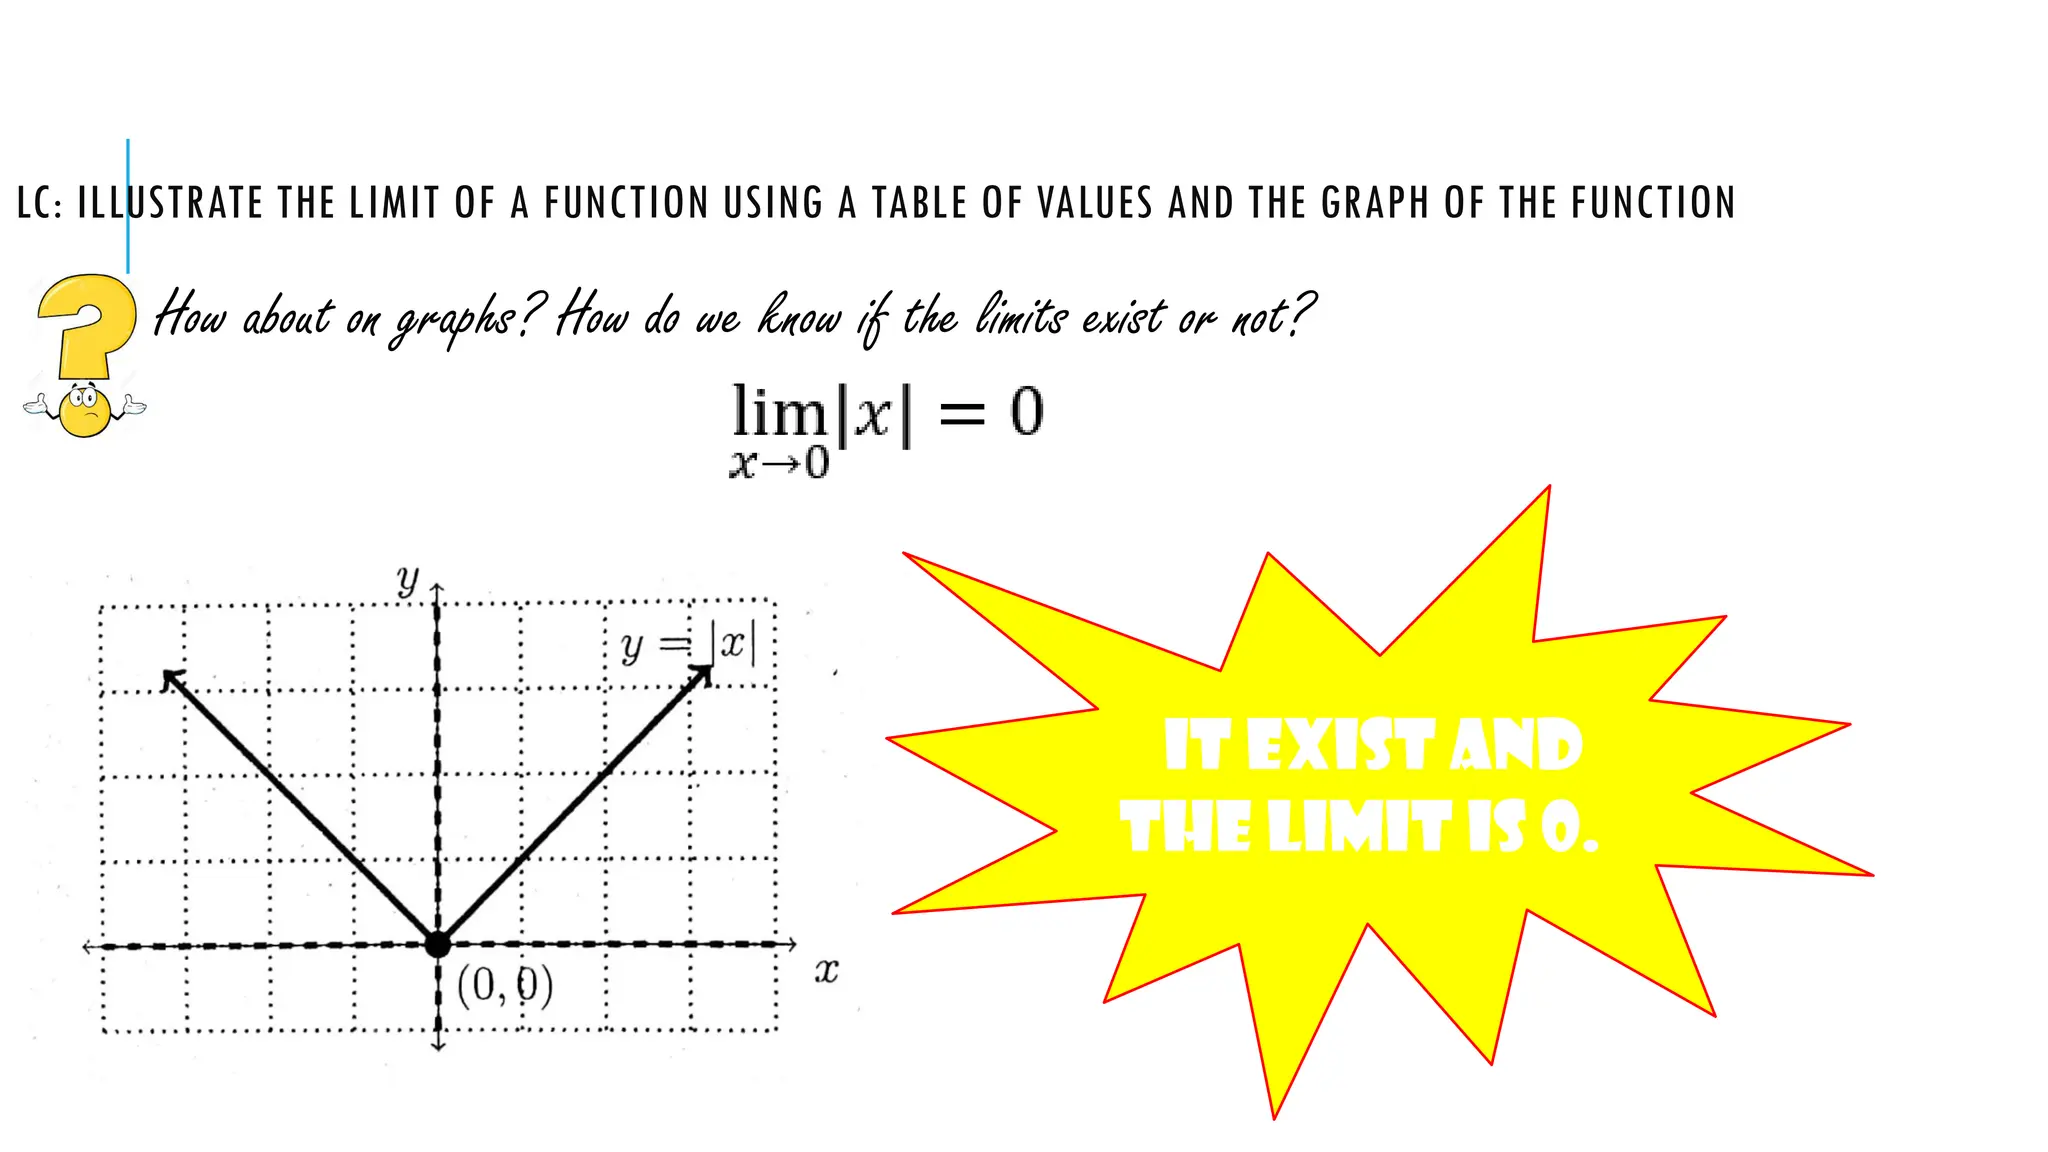
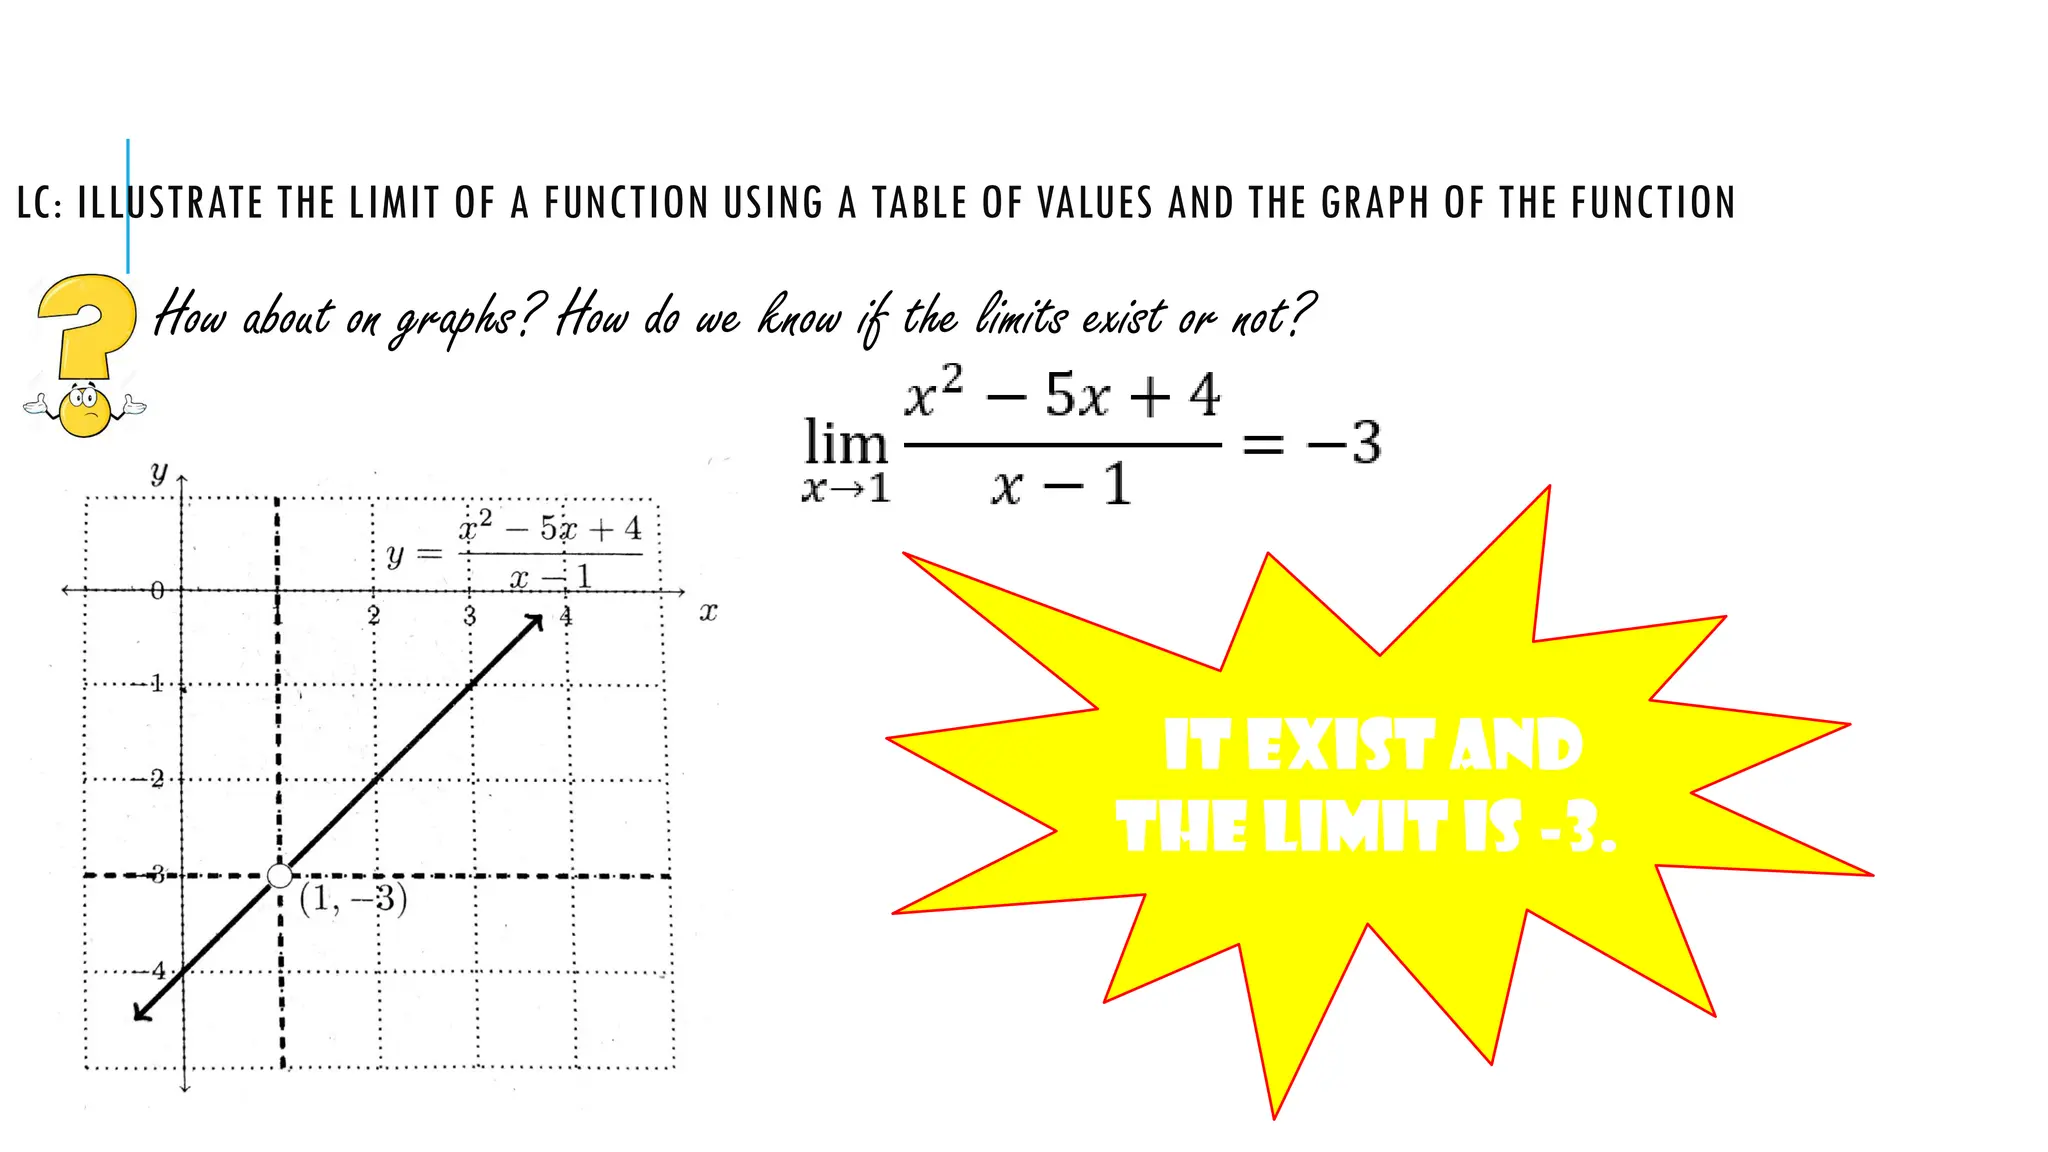
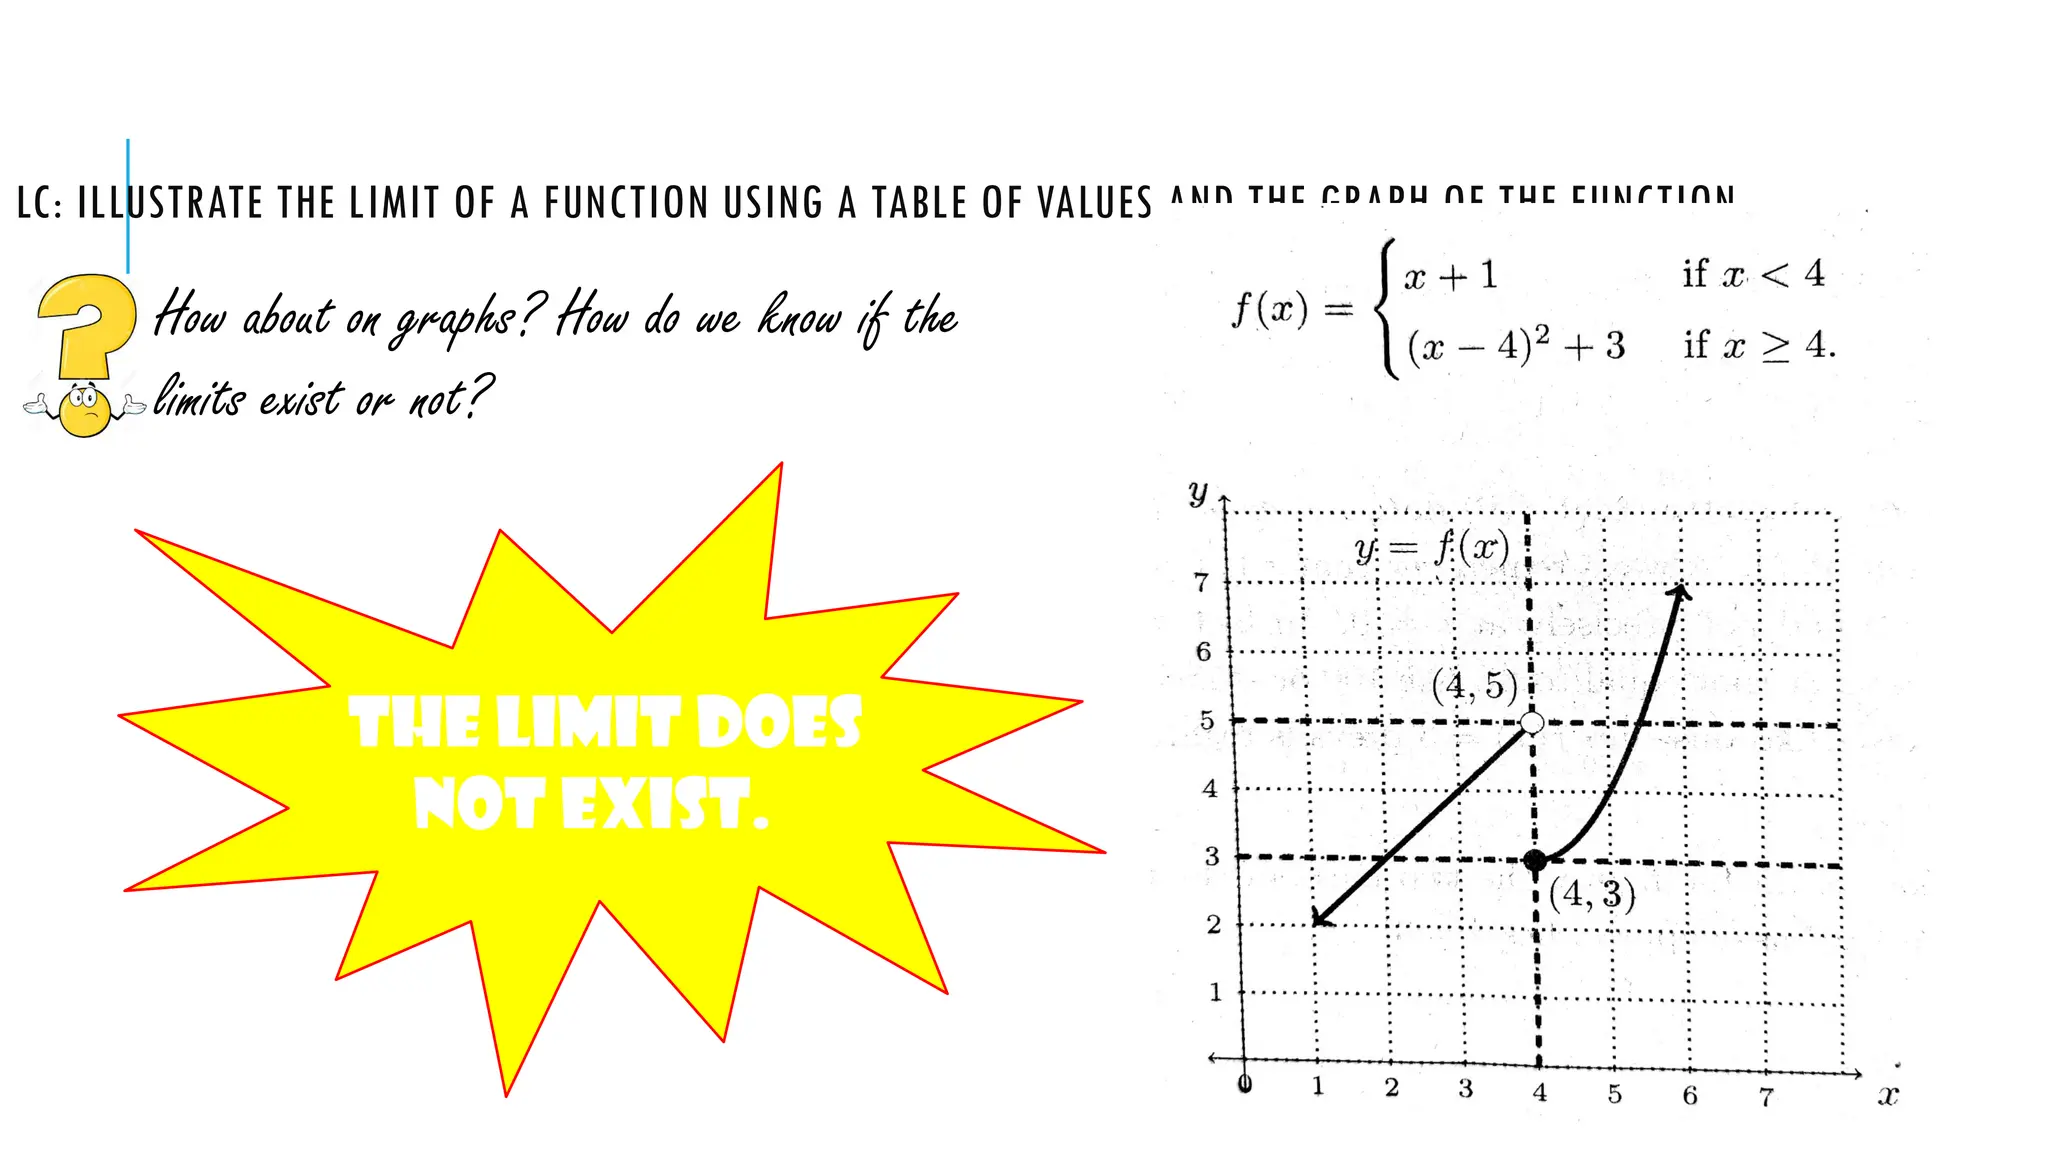
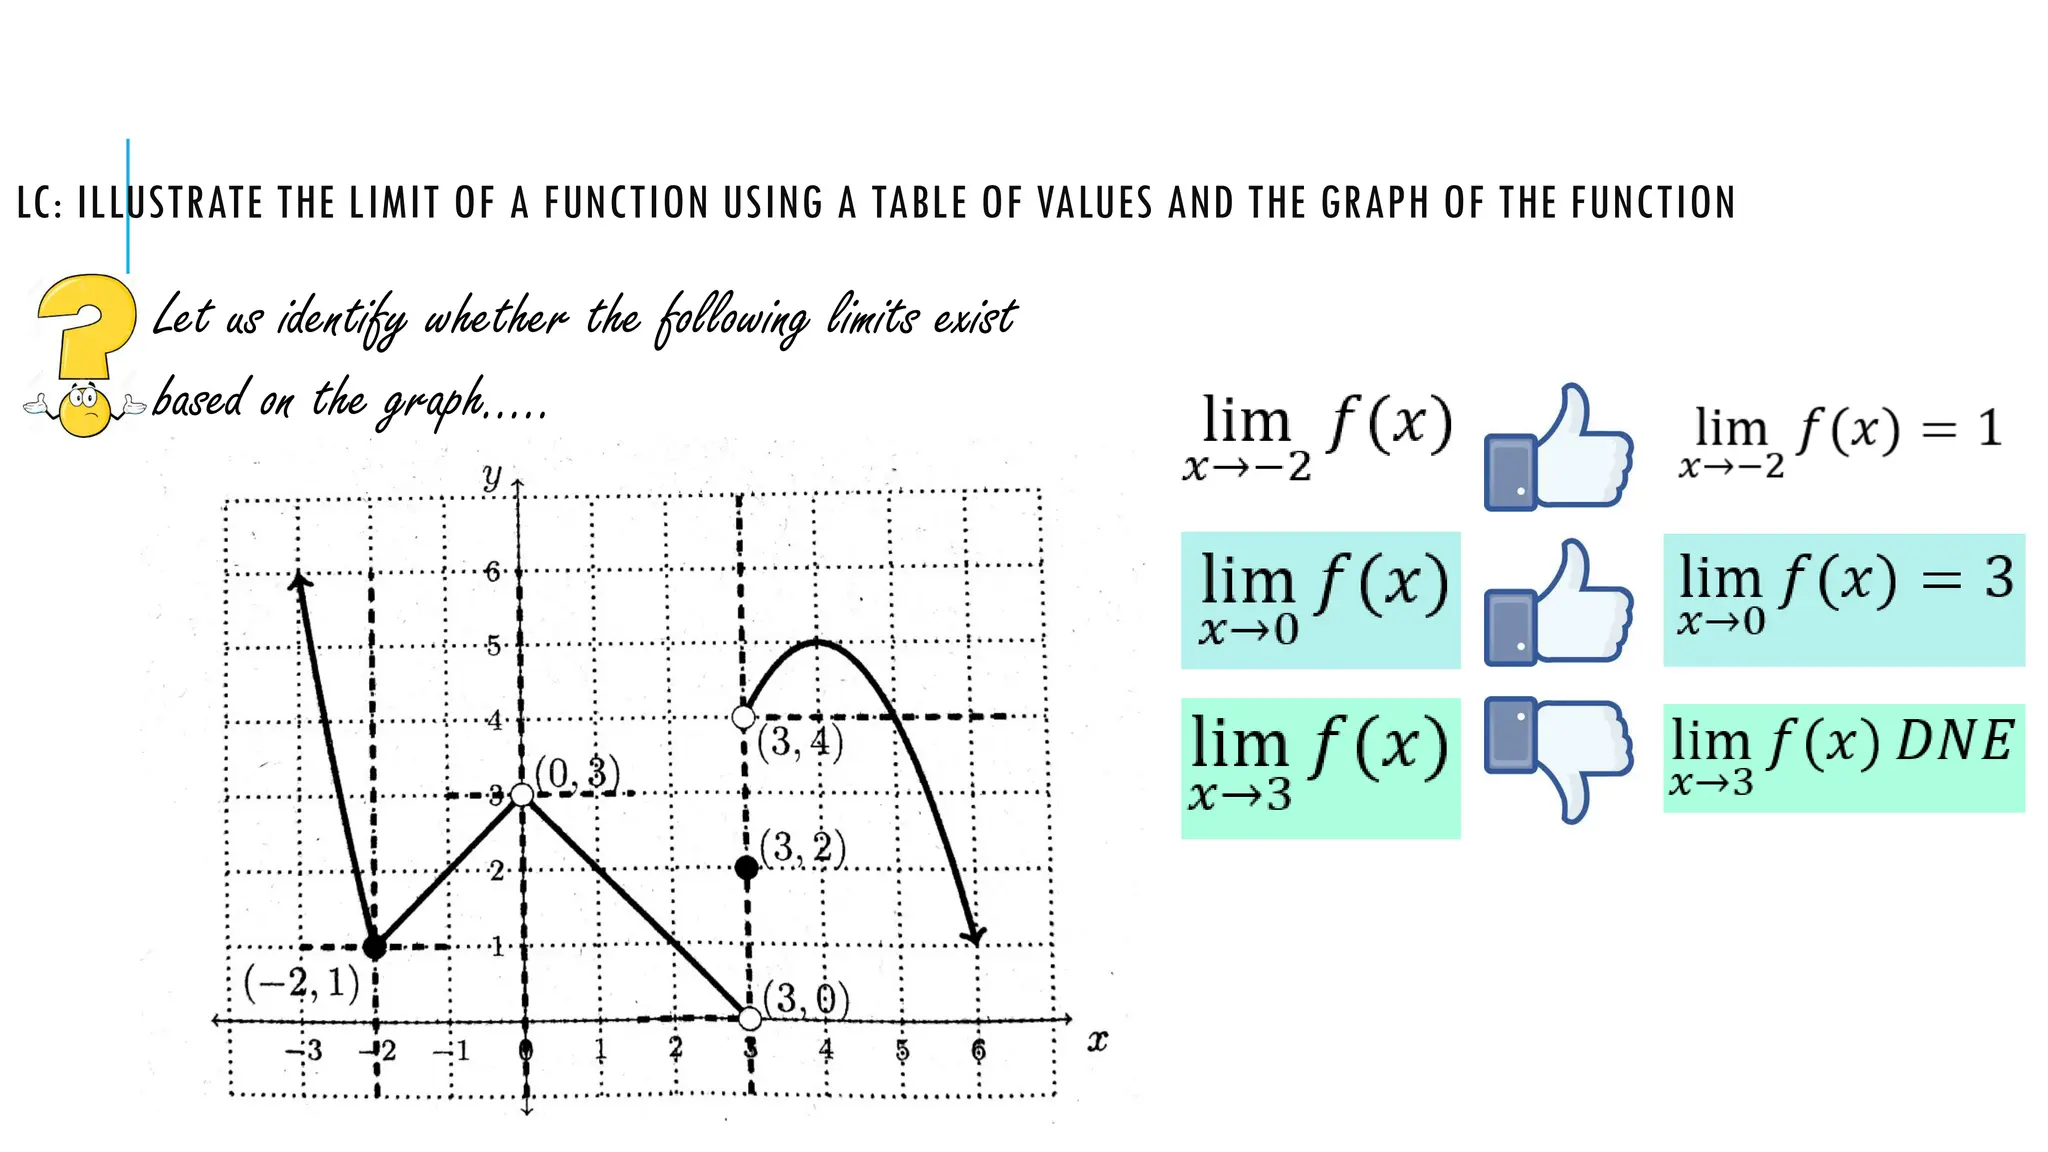
THE LIMIT OF A FUNCTION TOPIC 1.1
LC: ILLUSTRATE THE LIMIT OF A FUNCTION USING A
TABLE OF VALUES AND THE GRAPH OF THE FUNCTION
Consider a function f of a single
variable x. Consider a constant c which
the variable x will approach (c may or
may not be in the domain of f). The limit,
to be denoted by L, is the unique real
value that f(x) will approach as x
approach c. In symbols, we write this
process as
It is read as “The limit of f
of x as x approaches c is
L.”
LC: ILLUSTRATE THE LIMIT OF A FUNCTION USING A
TABLE OF VALUES AND THE GRAPH OF THE FUNCTION
Let us consider
We consider approaching 2 from its left or through values lesser than
but close to 2
x 1 1.4 1.7 1.9 1.95 1.997 1.9999 2
f(x)/y 4 5.2 6.1 6.7 6.85 6.991 6.9997
#1
LC: ILLUSTRATE THE LIMIT OF A FUNCTION USING A
TABLE OF VALUES AND THE GRAPH OF THE FUNCTION
Let us consider
Now, we consider approaching 2 from its right or through values
greater than but close to 2
x 2 2.0000001 2.009 2.03 2.1 2.2 2.5 3
f(x)/y 7.0000003 7.027 7.09 7.3 7.6 8.5 10
Therefore;
#1
LC: ILLUSTRATE THE LIMIT OF A FUNCTION USING A TABLE OF VALUES AND THE
GRAPH OF THE FUNCTION
Investigate
By constructing table values, we have values of x approaching -1 from
left
#2
x -1.5 -1.2 -1.01 -1.0001 -1
f(x)/y 3.25 2.44 2.0201
2.0002000
1
LC: ILLUSTRATE THE LIMIT OF A FUNCTION USING A TABLE OF VALUES AND THE
GRAPH OF THE FUNCTION
Investigate
By constructing table values, we have values of x approaching -1 from
right
#2
x -1 -0.999 -0.99 -0.8 -.05
f(x)/y 1.99980001 1.9801 1.64 1.25
Therefore;
LC: ILLUSTRATE THE LIMIT OF A FUNCTION USING A TABLE OF VALUES AND THE
GRAPH OF THE FUNCTION
Investigate through a table of values, the
given is Approaching 0 from the left and from the right, we
get the following tables
#3
Therefore;
LC: ILLUSTRATE THE LIMIT OF A FUNCTION USING A TABLE OF VALUES AND THE
GRAPH OF THE FUNCTION
Investigate through a table of values, the
given is Take note that 1 is not a domain of the given
function.
#4
Approach 1 from the left: Approach 1 from the right:
Therefore;
LC: ILLUSTRATE THE LIMIT OF A FUNCTION USING A TABLE OF VALUES AND THE
GRAPH OF THE FUNCTION
Investigate through a table of values, the
given is
#5
When x approaches 4 from the left, then we use
the first equation
LC: ILLUSTRATE THE LIMIT OF A FUNCTION USING A TABLE OF VALUES AND THE
GRAPH OF THE FUNCTION
Investigate through a table of values, the
given is
#5
When x approaches 4 from the right, then we use
the second equation
LC: ILLUSTRATE THE LIMIT OF A FUNCTION USING A TABLE OF VALUES AND THE
GRAPH OF THE FUNCTION
Investigate through a table of values, the
given is
#5
Let’s compare:
LC: ILLUSTRATE THE LIMIT OF A FUNCTION USING A TABLE OF VALUES AND THE
GRAPH OF THE FUNCTION
Investigate through a table of values, the
given is
#5
Therefore, the limit does not
exist (DNE)
LC: ILLUSTRATE THE LIMIT OF A FUNCTION USING A TABLE OF
VALUES AND THE GRAPH OF THE FUNCTION
If x approaches c from the left, or through values less than c, then we write
Sum it up!
If x approaches c from the right, or through values greater than c, then we write
Furthermore, we say if and only if
In other words, for a limit L to exist, the limits from the left and from the right must both exist and be
equal to L
LC: ILLUSTRATE THE LIMIT OF A FUNCTION USING A TABLE OF
VALUES AND THE GRAPH OF THE FUNCTION
Therefore,
Sum it up!
are also referred to as one-sided limits, since
we only consider values on one side of c.
How about on graphs? How do we know if the limits exist or not?
LC: ILLUSTRATE THE LIMIT OF A FUNCTION USING A TABLE OF VALUES AND THE GRAPH OF THE FUNCTION
How about on graphs? How do we know if the limits exist or not?
It exist and
the limit is 7.
LC: ILLUSTRATE THE LIMIT OF A FUNCTION USING A TABLE OF VALUES AND THE GRAPH OF THE FUNCTION
How about on graphs? How do we know if the limits exist or not?
It exist and
the limit is 2.
LC: ILLUSTRATE THE LIMIT OF A FUNCTION USING A TABLE OF VALUES AND THE GRAPH OF THE FUNCTION
How about on graphs? How do we know if the limits exist or not?
It exist and
the limit is 0.
LC: ILLUSTRATE THE LIMIT OF A FUNCTION USING A TABLE OF VALUES AND THE GRAPH OF THE FUNCTION
How about on graphs? How do we know if the limits exist or not?
It exist and
the limit is -3.
LC: ILLUSTRATE THE LIMIT OF A FUNCTION USING A TABLE OF VALUES AND THE GRAPH OF THE FUNCTION
How about on graphs? How do we know if the
limits exist or not?
The limit does
not exist.
LC: ILLUSTRATE THE LIMIT OF A FUNCTION USING A TABLE OF VALUES AND THE GRAPH OF THE FUNCTION
Let us identify whether the following limits exist
based on the graph…..
Finding the limit of function by table of values.pptx

Finding the limit of function by table of values.pptx

  • 1.
    THE LIMIT OFA FUNCTION TOPIC 1.1
  • 4.
    LC: ILLUSTRATE THELIMIT OF A FUNCTION USING A TABLE OF VALUES AND THE GRAPH OF THE FUNCTION Consider a function f of a single variable x. Consider a constant c which the variable x will approach (c may or may not be in the domain of f). The limit, to be denoted by L, is the unique real value that f(x) will approach as x approach c. In symbols, we write this process as It is read as “The limit of f of x as x approaches c is L.”
  • 5.
    LC: ILLUSTRATE THELIMIT OF A FUNCTION USING A TABLE OF VALUES AND THE GRAPH OF THE FUNCTION Let us consider We consider approaching 2 from its left or through values lesser than but close to 2 x 1 1.4 1.7 1.9 1.95 1.997 1.9999 2 f(x)/y 4 5.2 6.1 6.7 6.85 6.991 6.9997 #1
  • 6.
    LC: ILLUSTRATE THELIMIT OF A FUNCTION USING A TABLE OF VALUES AND THE GRAPH OF THE FUNCTION Let us consider Now, we consider approaching 2 from its right or through values greater than but close to 2 x 2 2.0000001 2.009 2.03 2.1 2.2 2.5 3 f(x)/y 7.0000003 7.027 7.09 7.3 7.6 8.5 10 Therefore; #1
  • 7.
    LC: ILLUSTRATE THELIMIT OF A FUNCTION USING A TABLE OF VALUES AND THE GRAPH OF THE FUNCTION Investigate By constructing table values, we have values of x approaching -1 from left #2 x -1.5 -1.2 -1.01 -1.0001 -1 f(x)/y 3.25 2.44 2.0201 2.0002000 1
  • 8.
    LC: ILLUSTRATE THELIMIT OF A FUNCTION USING A TABLE OF VALUES AND THE GRAPH OF THE FUNCTION Investigate By constructing table values, we have values of x approaching -1 from right #2 x -1 -0.999 -0.99 -0.8 -.05 f(x)/y 1.99980001 1.9801 1.64 1.25 Therefore;
  • 9.
    LC: ILLUSTRATE THELIMIT OF A FUNCTION USING A TABLE OF VALUES AND THE GRAPH OF THE FUNCTION Investigate through a table of values, the given is Approaching 0 from the left and from the right, we get the following tables #3 Therefore;
  • 10.
    LC: ILLUSTRATE THELIMIT OF A FUNCTION USING A TABLE OF VALUES AND THE GRAPH OF THE FUNCTION Investigate through a table of values, the given is Take note that 1 is not a domain of the given function. #4 Approach 1 from the left: Approach 1 from the right: Therefore;
  • 11.
    LC: ILLUSTRATE THELIMIT OF A FUNCTION USING A TABLE OF VALUES AND THE GRAPH OF THE FUNCTION Investigate through a table of values, the given is #5 When x approaches 4 from the left, then we use the first equation
  • 12.
    LC: ILLUSTRATE THELIMIT OF A FUNCTION USING A TABLE OF VALUES AND THE GRAPH OF THE FUNCTION Investigate through a table of values, the given is #5 When x approaches 4 from the right, then we use the second equation
  • 13.
    LC: ILLUSTRATE THELIMIT OF A FUNCTION USING A TABLE OF VALUES AND THE GRAPH OF THE FUNCTION Investigate through a table of values, the given is #5 Let’s compare:
  • 14.
    LC: ILLUSTRATE THELIMIT OF A FUNCTION USING A TABLE OF VALUES AND THE GRAPH OF THE FUNCTION Investigate through a table of values, the given is #5 Therefore, the limit does not exist (DNE)
  • 15.
    LC: ILLUSTRATE THELIMIT OF A FUNCTION USING A TABLE OF VALUES AND THE GRAPH OF THE FUNCTION If x approaches c from the left, or through values less than c, then we write Sum it up! If x approaches c from the right, or through values greater than c, then we write Furthermore, we say if and only if In other words, for a limit L to exist, the limits from the left and from the right must both exist and be equal to L
  • 16.
    LC: ILLUSTRATE THELIMIT OF A FUNCTION USING A TABLE OF VALUES AND THE GRAPH OF THE FUNCTION Therefore, Sum it up! are also referred to as one-sided limits, since we only consider values on one side of c. How about on graphs? How do we know if the limits exist or not?
  • 17.
    LC: ILLUSTRATE THELIMIT OF A FUNCTION USING A TABLE OF VALUES AND THE GRAPH OF THE FUNCTION How about on graphs? How do we know if the limits exist or not? It exist and the limit is 7.
  • 18.
    LC: ILLUSTRATE THELIMIT OF A FUNCTION USING A TABLE OF VALUES AND THE GRAPH OF THE FUNCTION How about on graphs? How do we know if the limits exist or not? It exist and the limit is 2.
  • 19.
    LC: ILLUSTRATE THELIMIT OF A FUNCTION USING A TABLE OF VALUES AND THE GRAPH OF THE FUNCTION How about on graphs? How do we know if the limits exist or not? It exist and the limit is 0.
  • 20.
    LC: ILLUSTRATE THELIMIT OF A FUNCTION USING A TABLE OF VALUES AND THE GRAPH OF THE FUNCTION How about on graphs? How do we know if the limits exist or not? It exist and the limit is -3.
  • 21.
    LC: ILLUSTRATE THELIMIT OF A FUNCTION USING A TABLE OF VALUES AND THE GRAPH OF THE FUNCTION How about on graphs? How do we know if the limits exist or not? The limit does not exist.
  • 22.
    LC: ILLUSTRATE THELIMIT OF A FUNCTION USING A TABLE OF VALUES AND THE GRAPH OF THE FUNCTION Let us identify whether the following limits exist based on the graph…..