The document discusses financial statements and ratios that are used to analyze companies. It includes:
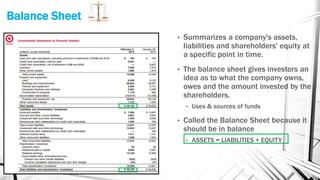
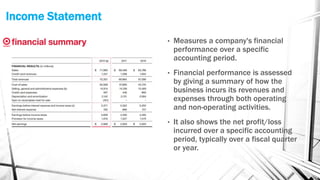
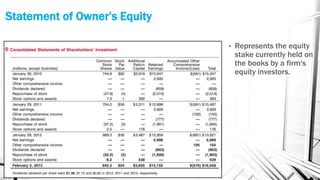
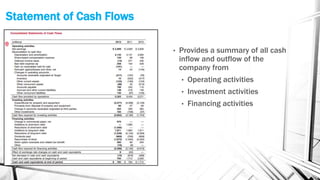
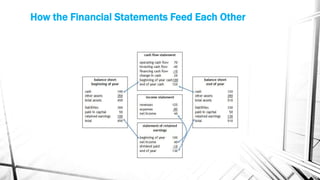
1) The 4 main financial statements - the balance sheet, income statement, statement of owner's equity, and statement of cash flows - and what each measures.
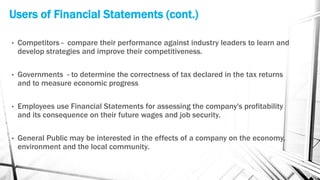
2) Users of financial statements like investors, banks, customers etc. and the types of analyses they conduct.
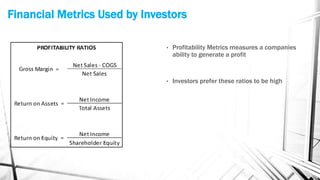
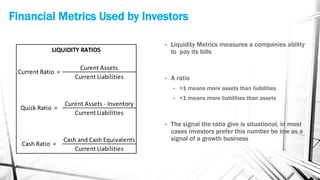
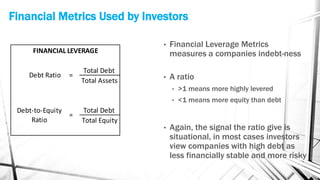
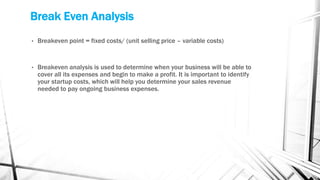
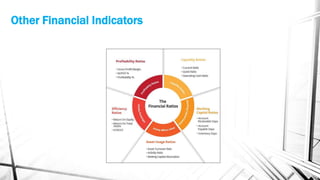
3) Common financial metrics and ratios used by investors to evaluate companies like liquidity ratios, financial leverage ratios, and profitability ratios.
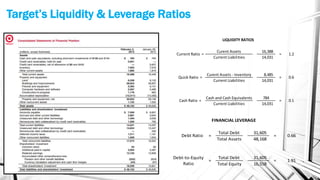
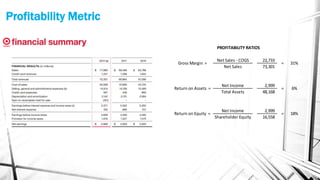
4) An example analysis of Target's financial statements, calculating various ratios to assess its liquidity, leverage, and profitability.